| Param | Original file | Final file |
|---|---|---|
| Filename | modeM0/AS1A11_059T09_9000004888_34253cztM0_level2.evt | modeM0/AS1A11_059T09_9000004888_34253cztM0_level2_quad_clean.evt |
| Size (bytes) | 862,300,800 | 121,659,840 |
| Size | 822.4 MB | 116.0 MB |
| Events in quadrant A | 4,551,262 | 774,518 |
| Events in quadrant B | 5,807,947 | 779,292 |
| Events in quadrant C | 6,657,167 | 720,513 |
| Events in quadrant D | 8,420,409 | 714,279 |
| Mode M0 | |||
|---|---|---|---|
| Quadrant | BADHDUFLAG | Total packets | Discarded packets |
| A | 0 | 20288 | 0 |
| B | 0 | 23774 | 0 |
| C | 0 | 26183 | 0 |
| D | 0 | 32069 | 0 |
| Mode SS | |||
|---|---|---|---|
| Quadrant | BADHDUFLAG | Total packets | Discarded packets |
| A | 0 | 206 | 0 |
| B | 0 | 206 | 0 |
| C | 0 | 206 | 0 |
| D | 0 | 206 | 0 |
| Mode M9 | |||
|---|---|---|---|
| Quadrant | BADHDUFLAG | Total packets | Discarded packets |
| A | 0 | 30 | 0 |
| B | 0 | 30 | 0 |
| C | 0 | 30 | 0 |
| D | 0 | 30 | 0 |
| Quadrant | Total seconds | Saturated seconds | Saturation percentage |
|---|---|---|---|
| A | 10032 | 20 | 0.199362% |
| B | 10032 | 245 | 2.442185% |
| C | 10032 | 552 | 5.502392% |
| D | 10032 | 623 | 6.210128% |
Noise dominated data is calculated using 1-second bins in cleaned event files. If a bin has >2000 counts, and if more than 50% of those come from <1% of pixels, then it is considered to be noise-dominated and hence unusable.
| Quadrant | # 1 sec bins | Bins with >0 counts | Bins with >2000 counts | High rate bins dominated by noise | Noise dominated (total time) | Noise dominated (detector-on time) | Marked lightcurve |
|---|---|---|---|---|---|---|---|
| A | 13046 | 10034 | 5 | 5 | 0.04% | 0.05% | 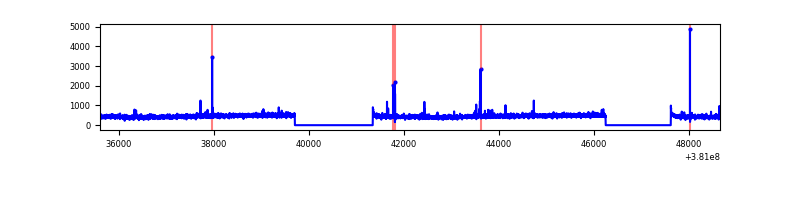 |
| B | 13046 | 10034 | 147 | 147 | 1.13% | 1.47% | 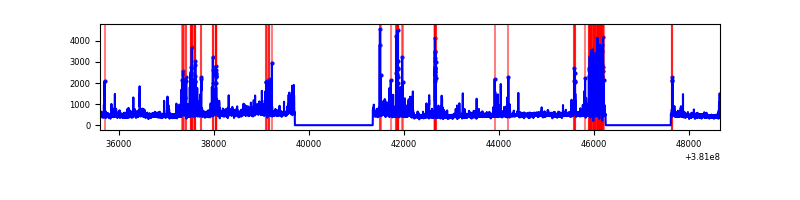 |
| C | 13046 | 10034 | 331 | 331 | 2.54% | 3.30% | 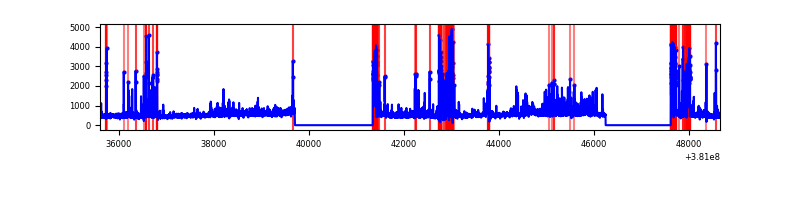 |
| D | 13046 | 10034 | 574 | 574 | 4.40% | 5.72% | 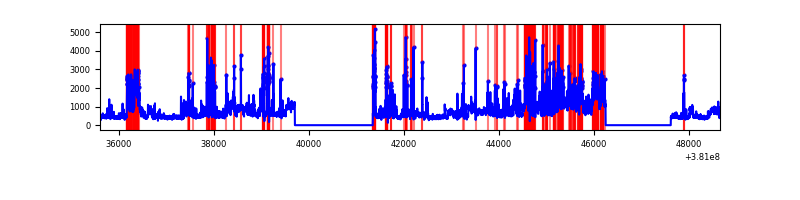 |
Top three noisy pixels from each quadrant. If the there are fewer than three noisy pixels in the level2.evt file, extra rows are filled as -1
| Pixel properties | Quadrant properties | ||||||
|---|---|---|---|---|---|---|---|
| Quadrant | DetID | PixID | Counts | Sigma | Mean | Median | Sigma |
| A | 9 | 143 | 56474 | 239.48 | 1148 | 1125 | 231.1 |
| A | 10 | 83 | 27924 | 115.95 | 1148 | 1125 | 231.1 |
| A | 13 | 254 | 18040 | 73.19 | 1148 | 1125 | 231.1 |
| B | 5 | 172 | 776588 | 3569.14 | 1132 | 1102 | 217.3 |
| B | 0 | 189 | 323346 | 1483.11 | 1132 | 1102 | 217.3 |
| B | 4 | 251 | 92530 | 420.79 | 1132 | 1102 | 217.3 |
| C | 14 | 254 | 1052883 | 4273.2 | 1073 | 1079 | 246.1 |
| C | 0 | 207 | 452671 | 1834.7 | 1073 | 1079 | 246.1 |
| C | 0 | 10 | 443171 | 1796.1 | 1073 | 1079 | 246.1 |
| D | 8 | 195 | 1755567 | 6572.08 | 1086 | 1054 | 267.0 |
| D | 12 | 227 | 1047190 | 3918.63 | 1086 | 1054 | 267.0 |
| D | 7 | 80 | 698054 | 2610.83 | 1086 | 1054 | 267.0 |
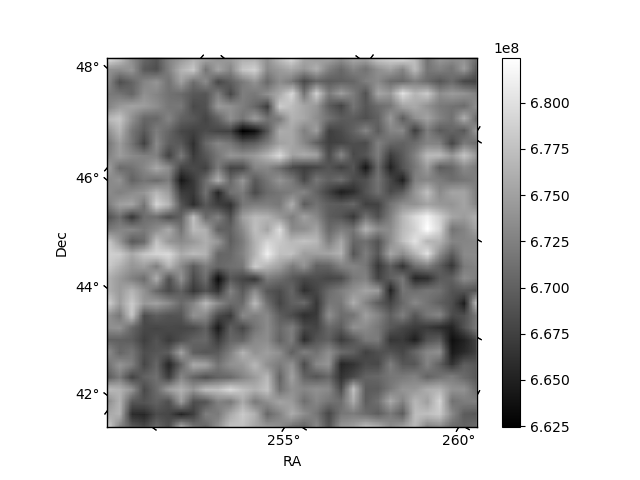
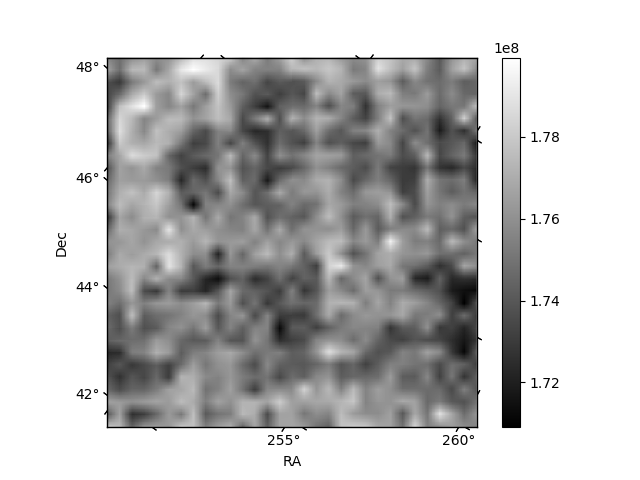
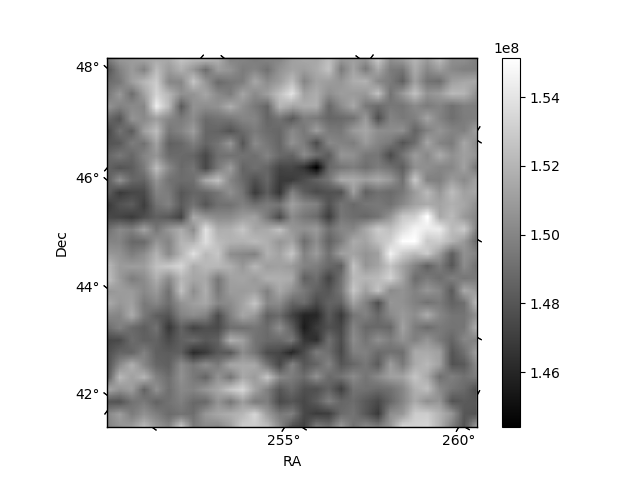
Histogram calculated using DETX and DETY for each event in the final _common_clean file
| Quadrant A | 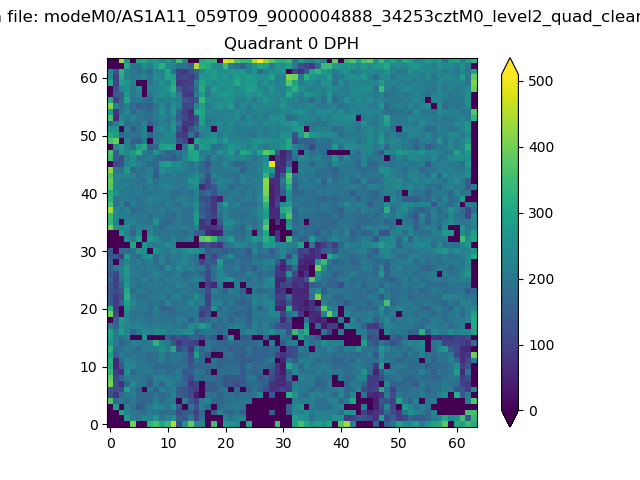 |
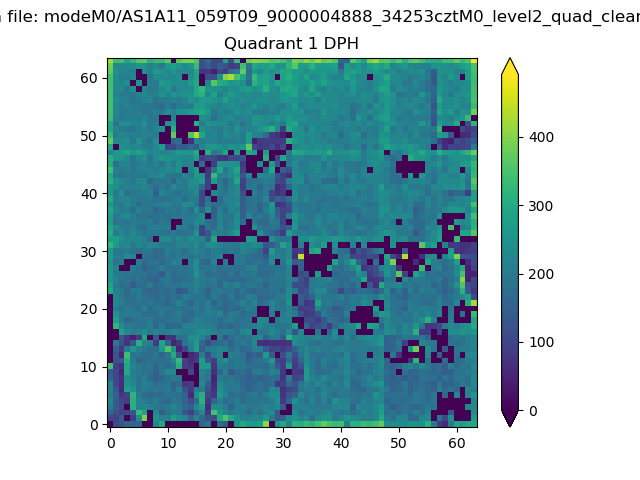 |
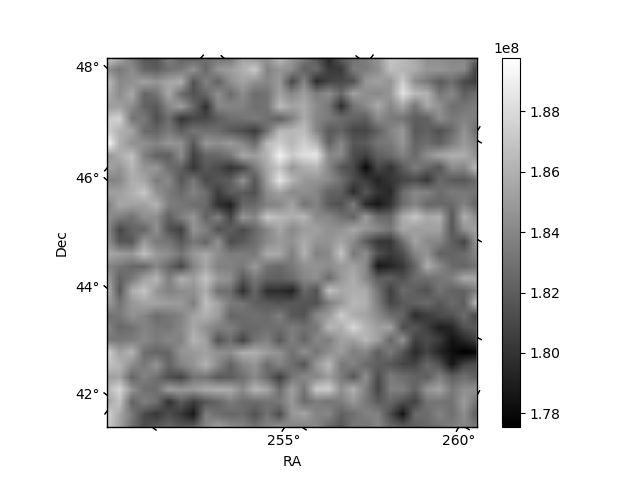
Quadrant B |
|---|---|---|---|
| Quadrant D | 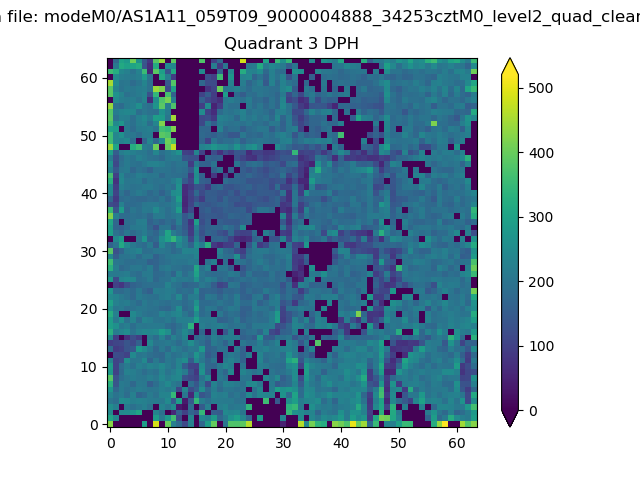 |
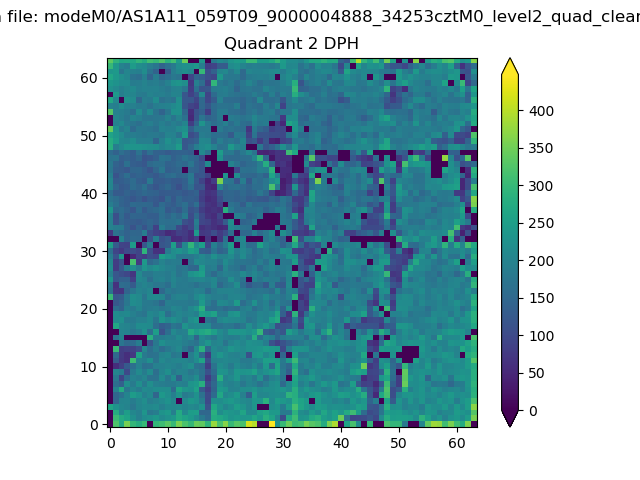 |
Quadrant C |
| Plot type | Count rate plots | Images |
|---|---|---|
| Comparison with Poisson distribution Blue bars denote a histogram of data divided into 1 sec bins. Red curve is a Poisson curve with rate = median count rate of data. |
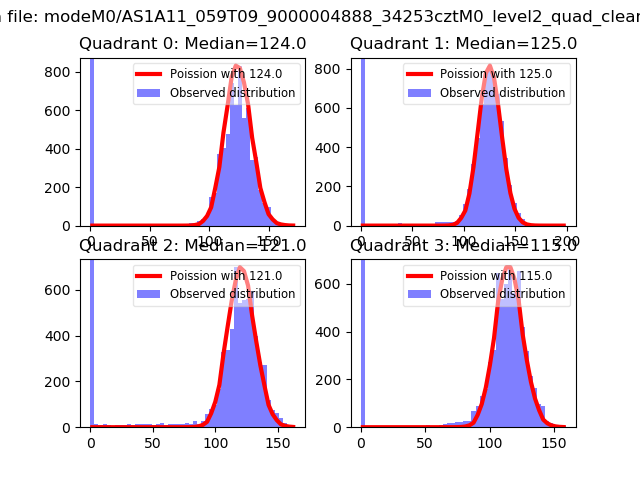 |
 |
| Quadrant-wise count rates Data is divided into 100 sec bins |
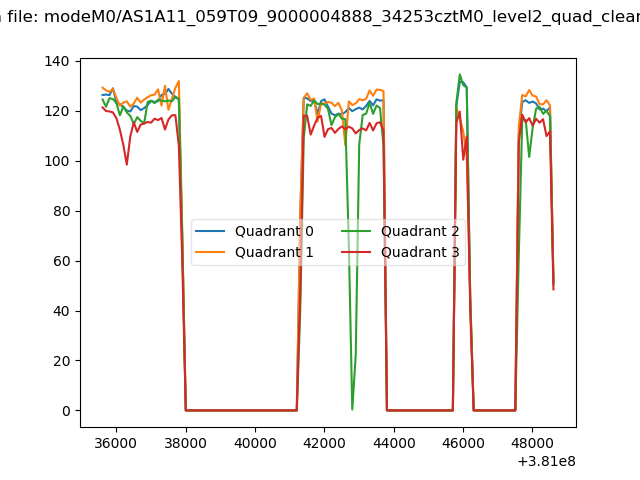 |
|
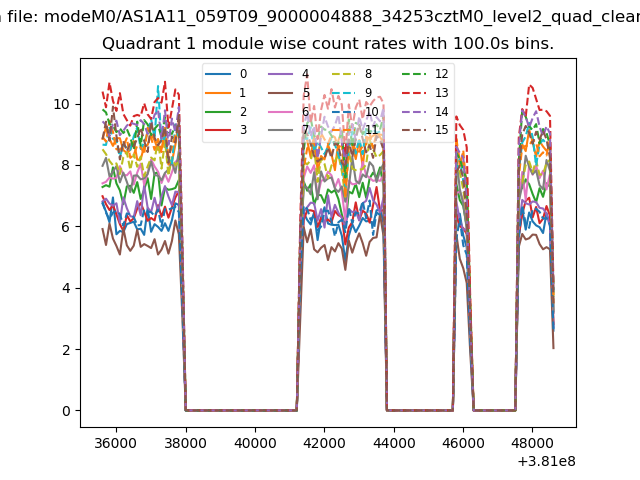
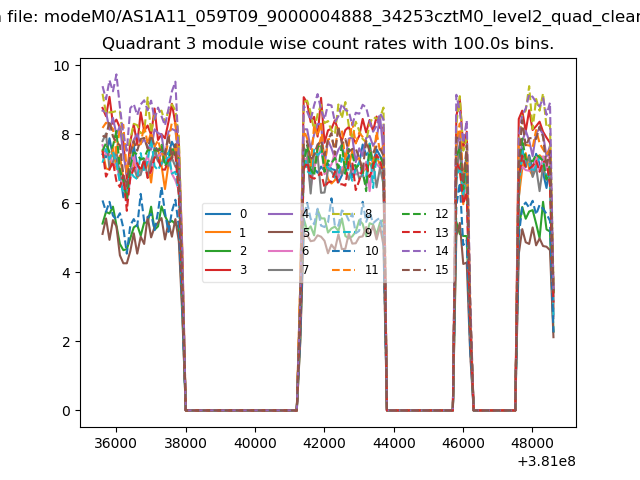
| Module-wise count rates for Quadrant A Data is divided into 100 sec bins |
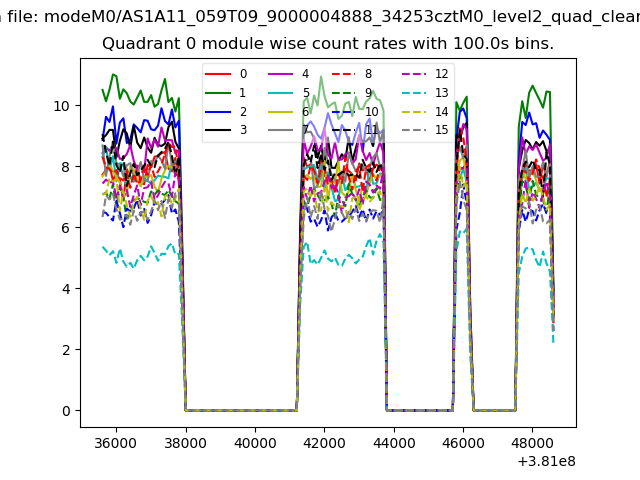 |
 |
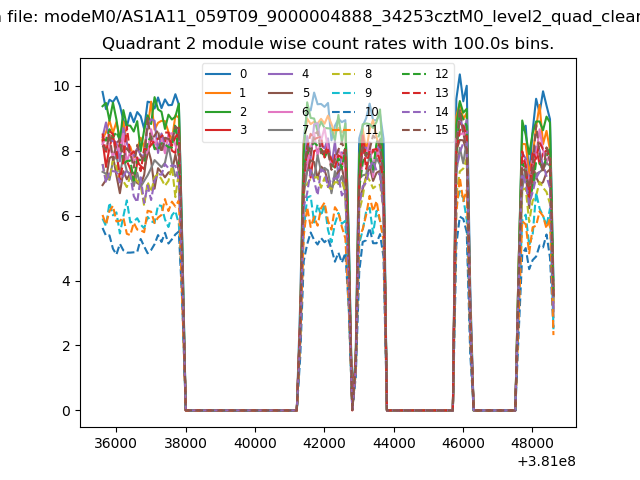
| Module-wise count rates for Quadrant B Data is divided into 100 sec bins |
 |
 |
| Module-wise count rates for Quadrant C Data is divided into 100 sec bins |
 |
 |
| Module-wise count rates for Quadrant D Data is divided into 100 sec bins |
 |
 |
| Parameter | Plot |
|---|---|
| CZT HV Monitor | 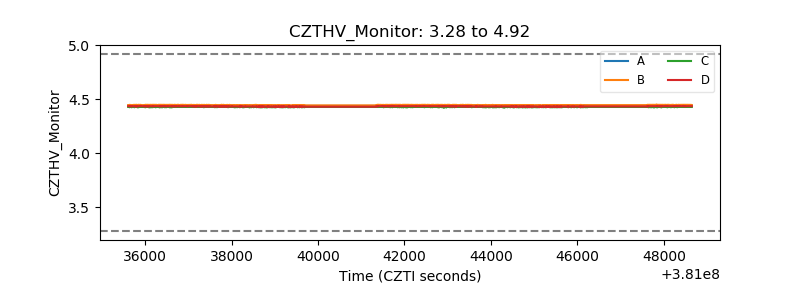 |
| D_VDD | 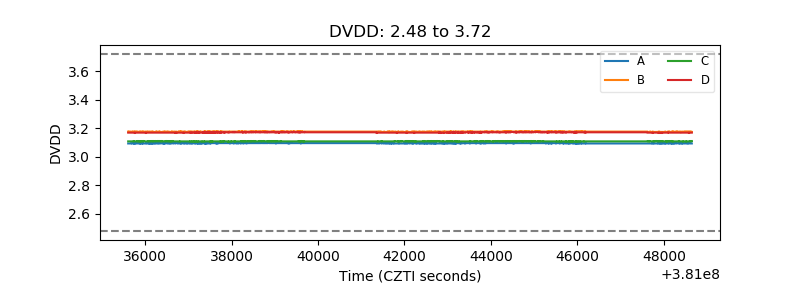 |
| Temperature 1 | 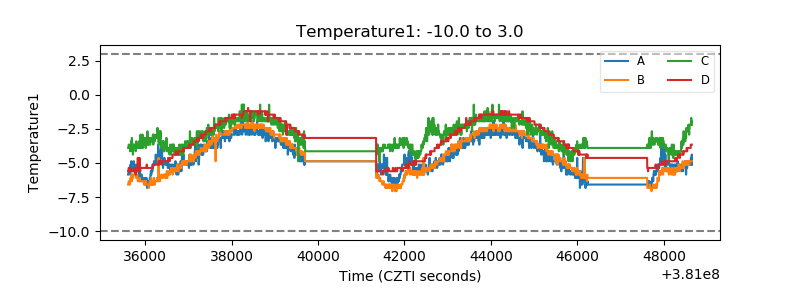 |
| Veto HV Monitor | 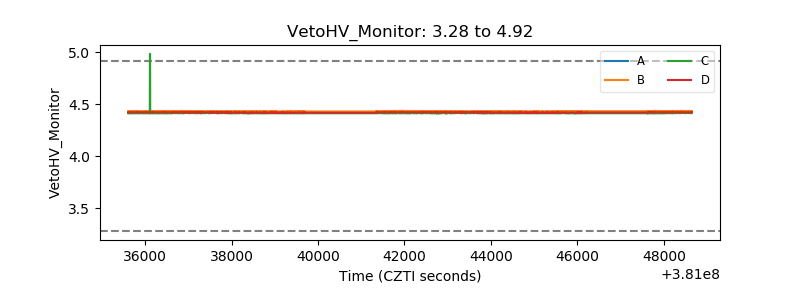 |
| Veto LLD | 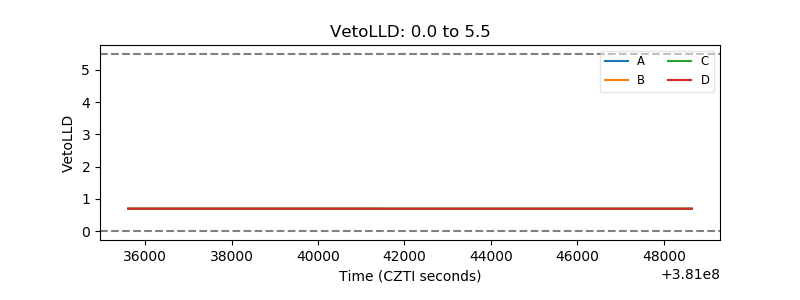 |
| Alpha Counter | 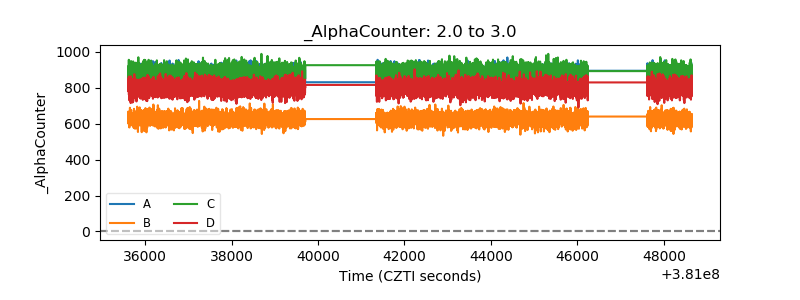 |
| _CPM_Rate | 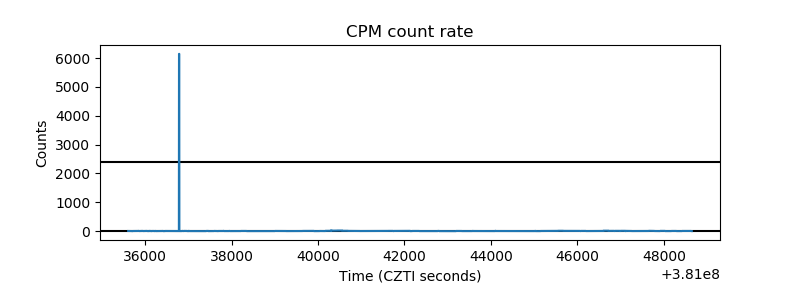 |
| CZT Counter | 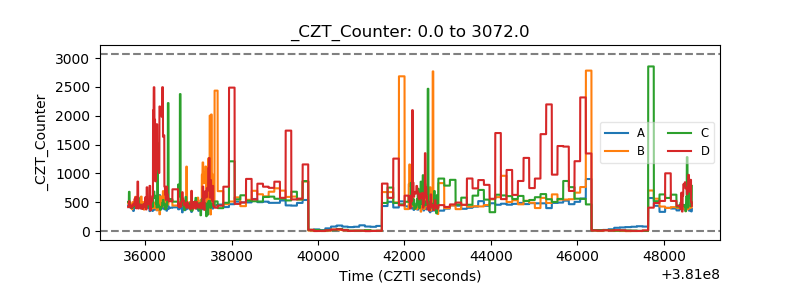 |
| +2.5 Volts monitor | 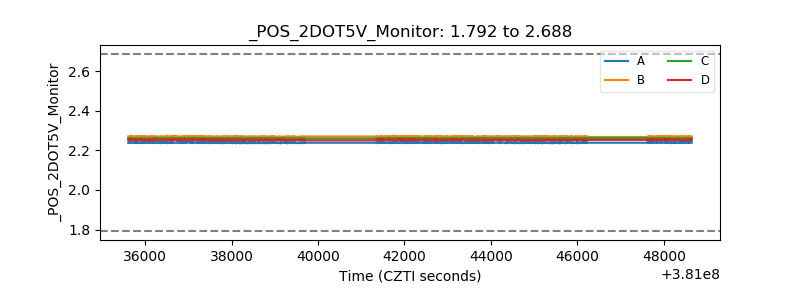 |
| +5 Volts monitor | 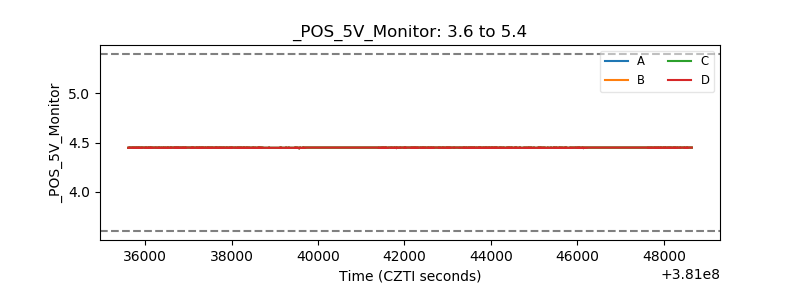 |
| _ROLL_ROT | 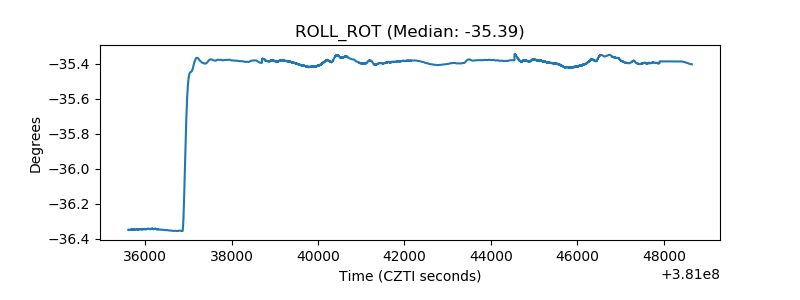 |
| _Roll_DEC | 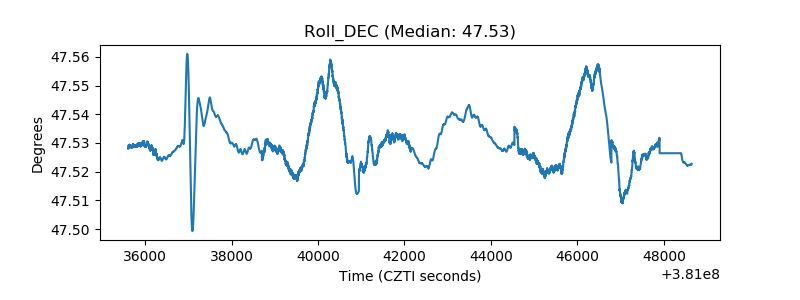 |
| _Roll_RA | 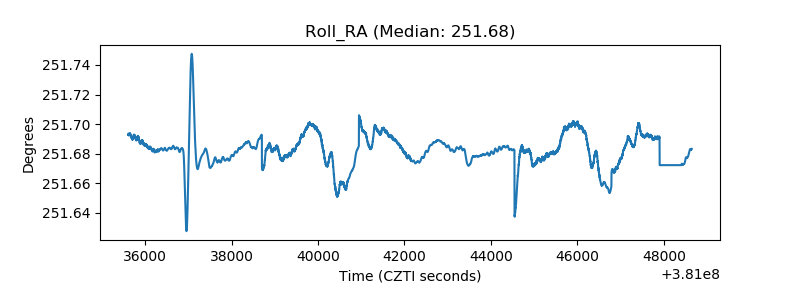 |
| Veto Counter | 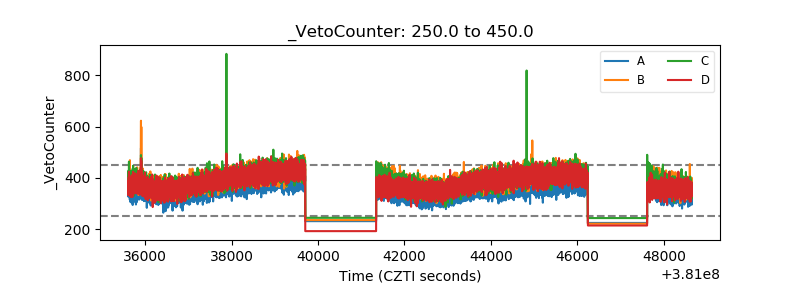 |