| Param | Original file | Final file |
|---|---|---|
| Filename | modeM0/AS1A11_059T09_9000004888_34251cztM0_level2.evt | modeM0/AS1A11_059T09_9000004888_34251cztM0_level2_quad_clean.evt |
| Size (bytes) | 443,056,320 | 80,524,800 |
| Size | 422.5 MB | 76.8 MB |
| Events in quadrant A | 2,336,533 | 534,768 |
| Events in quadrant B | 3,223,667 | 543,808 |
| Events in quadrant C | 3,448,087 | 508,650 |
| Events in quadrant D | 4,062,277 | 492,567 |
| Mode M0 | |||
|---|---|---|---|
| Quadrant | BADHDUFLAG | Total packets | Discarded packets |
| A | 0 | 10396 | 0 |
| B | 0 | 12949 | 0 |
| C | 0 | 13429 | 0 |
| D | 0 | 15645 | 0 |
| Mode SS | |||
|---|---|---|---|
| Quadrant | BADHDUFLAG | Total packets | Discarded packets |
| A | 0 | 104 | 0 |
| B | 0 | 104 | 0 |
| C | 0 | 104 | 0 |
| D | 0 | 104 | 0 |
| Mode M9 | |||
|---|---|---|---|
| Quadrant | BADHDUFLAG | Total packets | Discarded packets |
| A | 0 | 35 | 0 |
| B | 0 | 35 | 0 |
| C | 0 | 35 | 0 |
| D | 0 | 36 | 0 |
| Quadrant | Total seconds | Saturated seconds | Saturation percentage |
|---|---|---|---|
| A | 5117 | 5 | 0.097714% |
| B | 5117 | 161 | 3.146375% |
| C | 5117 | 289 | 5.647841% |
| D | 5117 | 436 | 8.520618% |
Noise dominated data is calculated using 1-second bins in cleaned event files. If a bin has >2000 counts, and if more than 50% of those come from <1% of pixels, then it is considered to be noise-dominated and hence unusable.
| Quadrant | # 1 sec bins | Bins with >0 counts | Bins with >2000 counts | High rate bins dominated by noise | Noise dominated (total time) | Noise dominated (detector-on time) | Marked lightcurve |
|---|---|---|---|---|---|---|---|
| A | 7090 | 5118 | 0 | 0 | 0.00% | 0.00% | 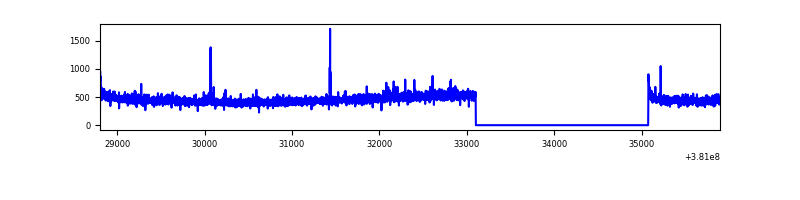 |
| B | 7090 | 5118 | 82 | 82 | 1.16% | 1.60% | 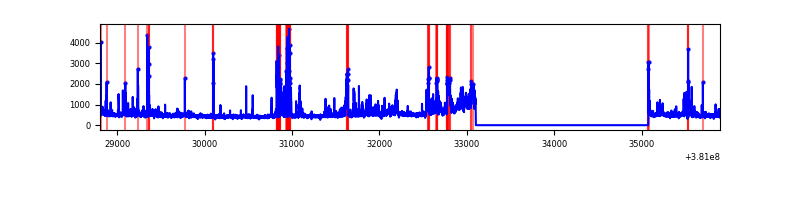 |
| C | 7090 | 5118 | 195 | 195 | 2.75% | 3.81% | 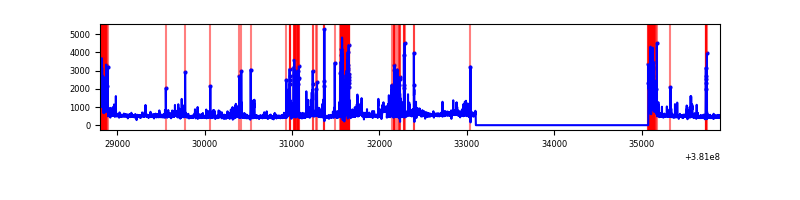 |
| D | 7090 | 5118 | 351 | 351 | 4.95% | 6.86% | 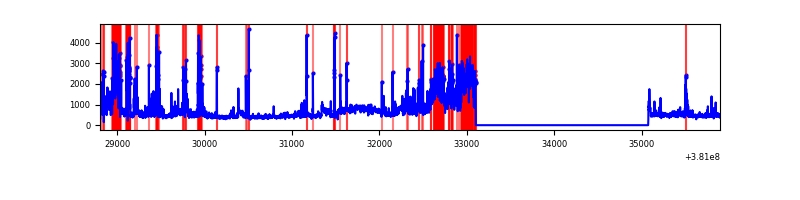 |
Top three noisy pixels from each quadrant. If the there are fewer than three noisy pixels in the level2.evt file, extra rows are filled as -1
| Pixel properties | Quadrant properties | ||||||
|---|---|---|---|---|---|---|---|
| Quadrant | DetID | PixID | Counts | Sigma | Mean | Median | Sigma |
| A | 7 | 16 | 27369 | 226.87 | 588 | 578 | 118.1 |
| A | 10 | 83 | 22995 | 189.83 | 588 | 578 | 118.1 |
| A | 15 | 47 | 11979 | 96.54 | 588 | 578 | 118.1 |
| B | 0 | 189 | 399267 | 3554.64 | 584 | 568 | 112.2 |
| B | 5 | 172 | 390380 | 3475.41 | 584 | 568 | 112.2 |
| B | 0 | 229 | 78680 | 696.42 | 584 | 568 | 112.2 |
| C | 14 | 254 | 383235 | 2990.42 | 549 | 554 | 128.0 |
| C | 0 | 10 | 351036 | 2738.81 | 549 | 554 | 128.0 |
| C | 0 | 207 | 315475 | 2460.92 | 549 | 554 | 128.0 |
| D | 12 | 227 | 546449 | 4015.11 | 548 | 533 | 136.0 |
| D | 8 | 195 | 515792 | 3789.64 | 548 | 533 | 136.0 |
| D | 7 | 80 | 483996 | 3555.78 | 548 | 533 | 136.0 |
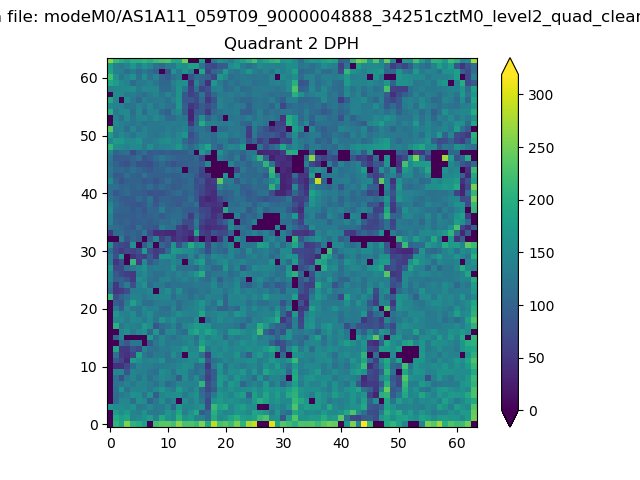
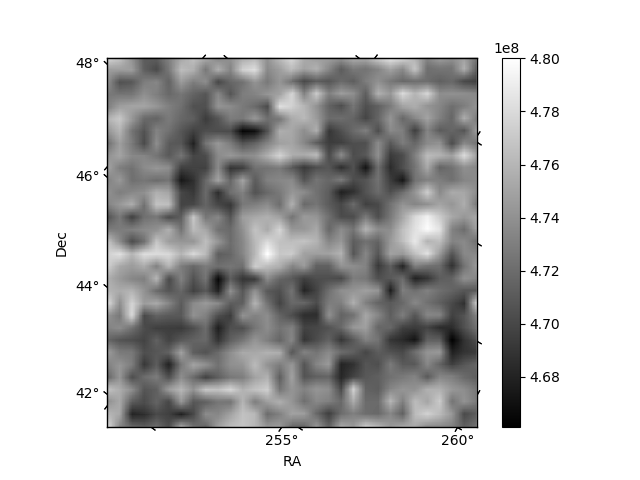
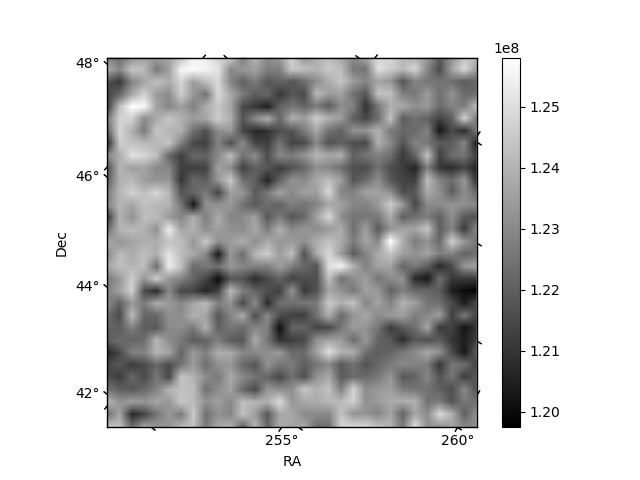
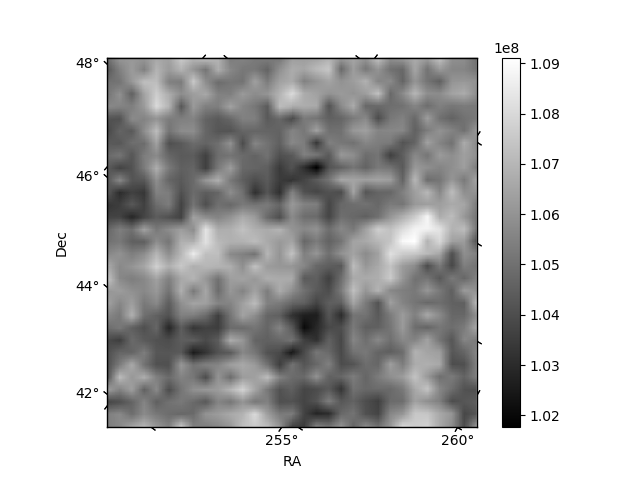
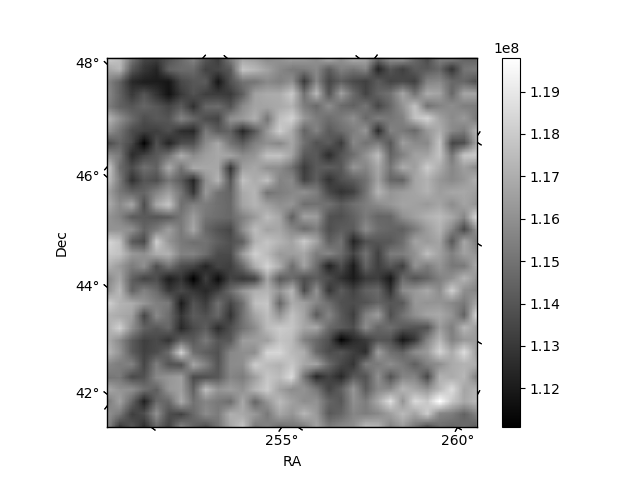
Histogram calculated using DETX and DETY for each event in the final _common_clean file
| Quadrant A | 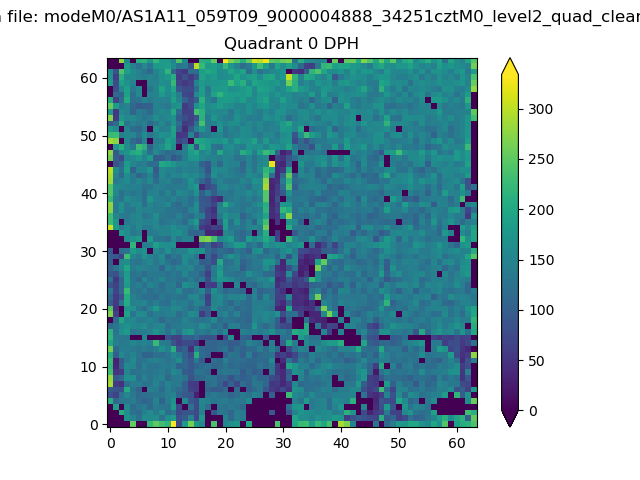 |
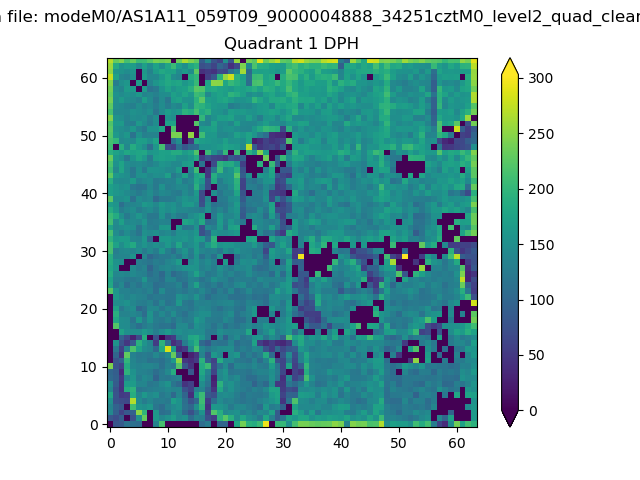 |
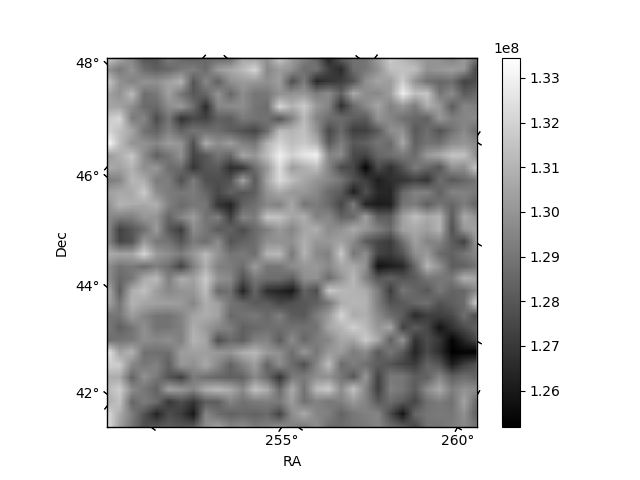
Quadrant B |
|---|---|---|---|
| Quadrant D | 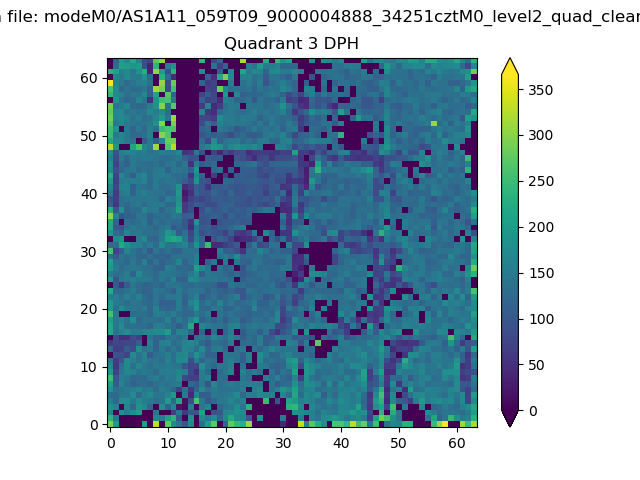 |
 |
Quadrant C |
| Plot type | Count rate plots | Images |
|---|---|---|
| Comparison with Poisson distribution Blue bars denote a histogram of data divided into 1 sec bins. Red curve is a Poisson curve with rate = median count rate of data. |
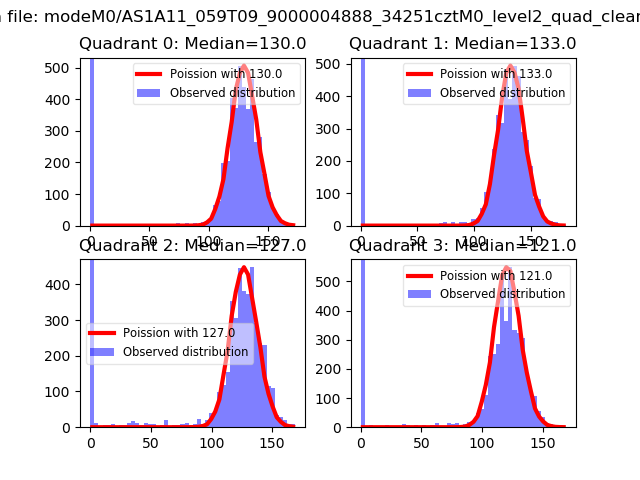 |
 |
| Quadrant-wise count rates Data is divided into 100 sec bins |
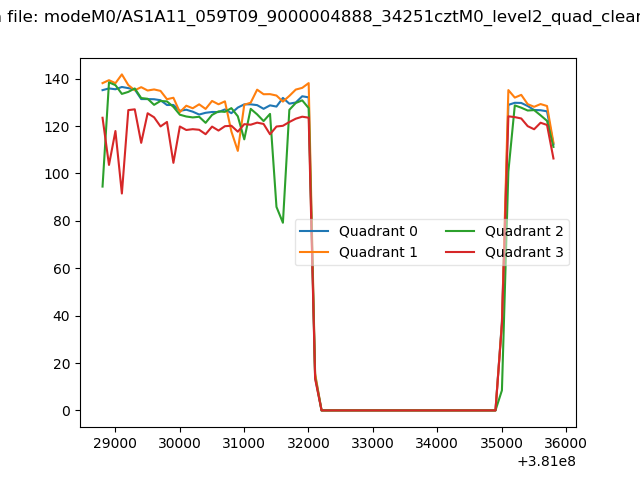 |
|
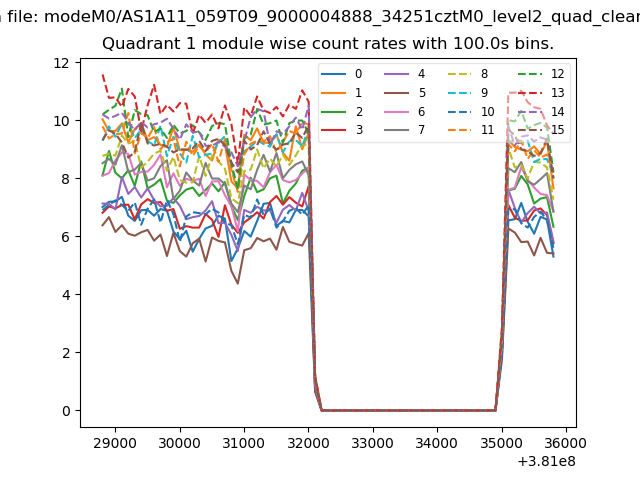
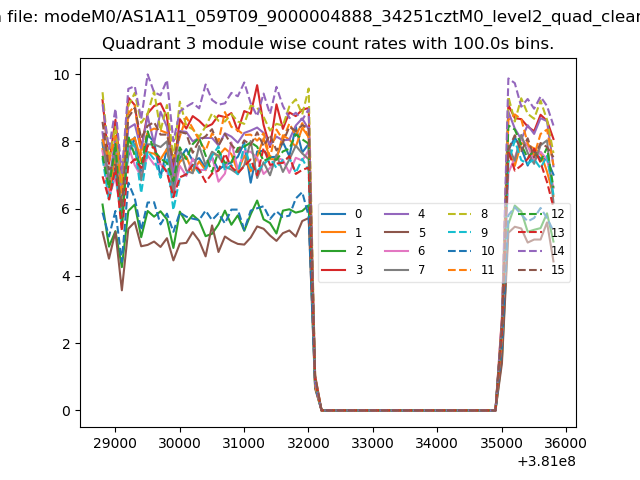
| Module-wise count rates for Quadrant A Data is divided into 100 sec bins |
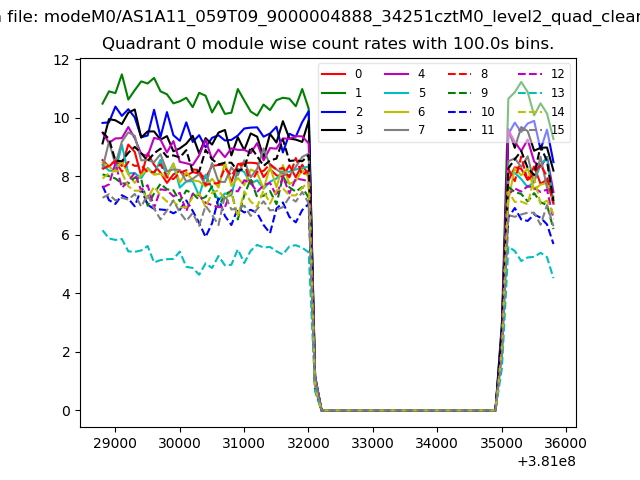 |
 |
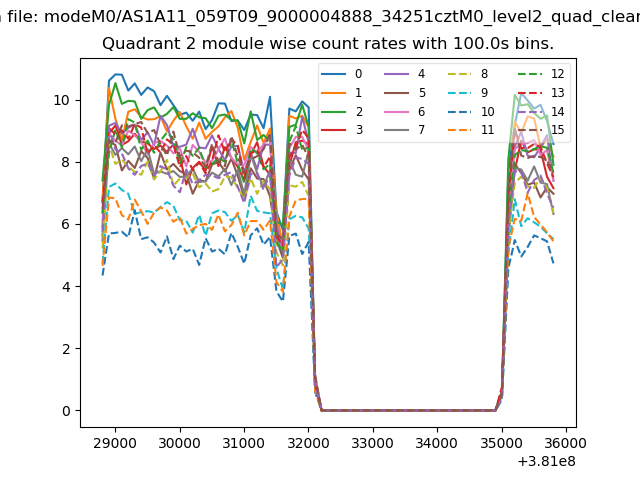
| Module-wise count rates for Quadrant B Data is divided into 100 sec bins |
 |
 |
| Module-wise count rates for Quadrant C Data is divided into 100 sec bins |
 |
 |
| Module-wise count rates for Quadrant D Data is divided into 100 sec bins |
 |
 |
| Parameter | Plot |
|---|---|
| CZT HV Monitor | 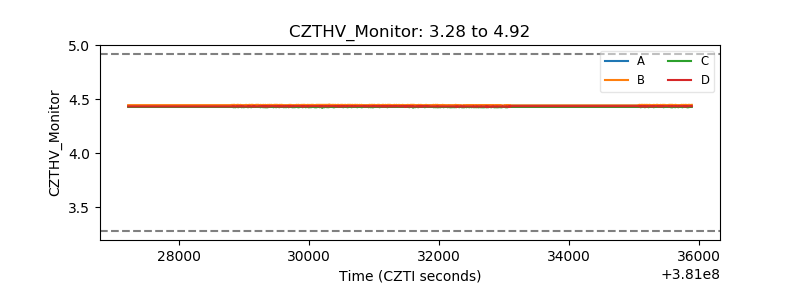 |
| D_VDD | 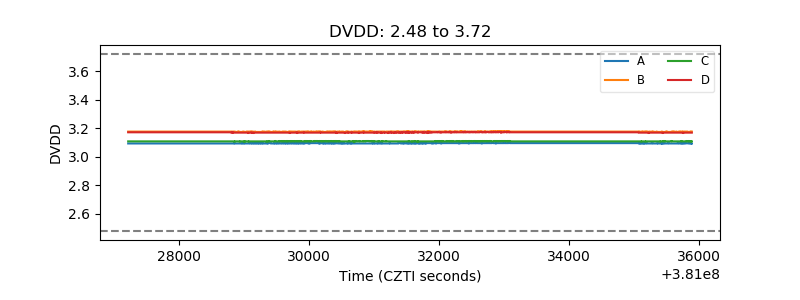 |
| Temperature 1 | 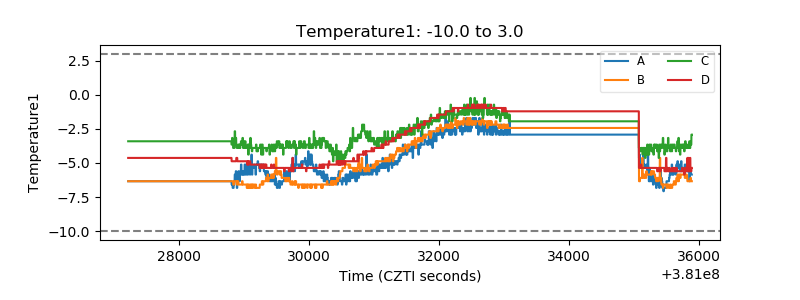 |
| Veto HV Monitor | 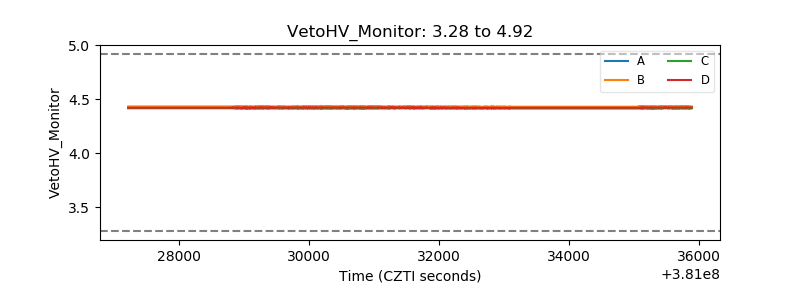 |
| Veto LLD | 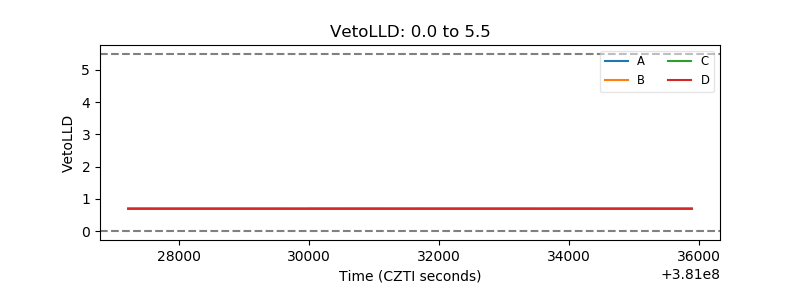 |
| Alpha Counter | 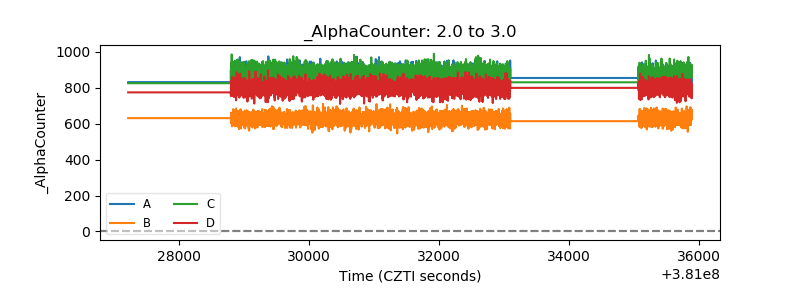 |
| _CPM_Rate | 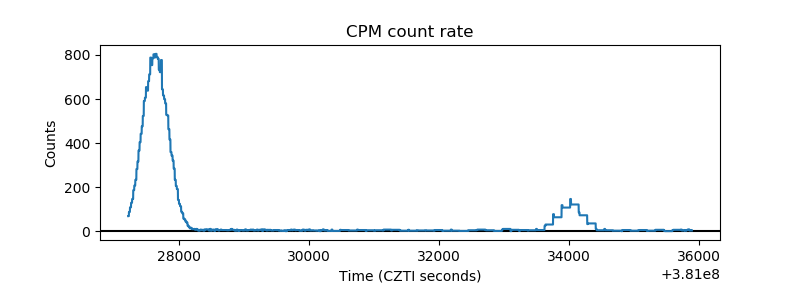 |
| CZT Counter | 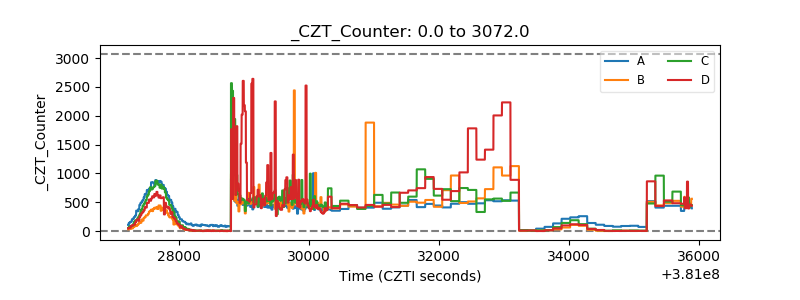 |
| +2.5 Volts monitor | 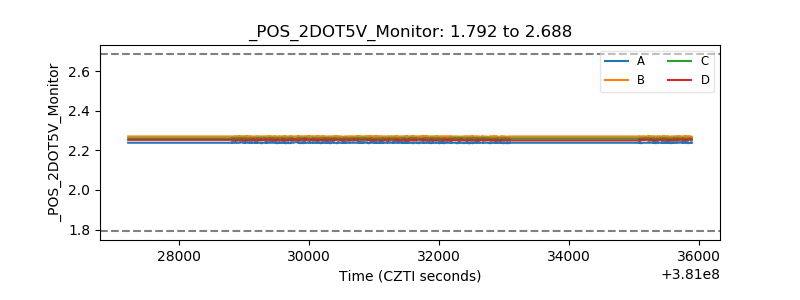 |
| +5 Volts monitor | 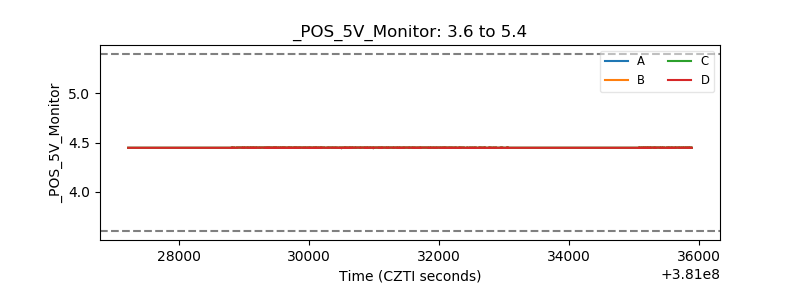 |
| _ROLL_ROT | 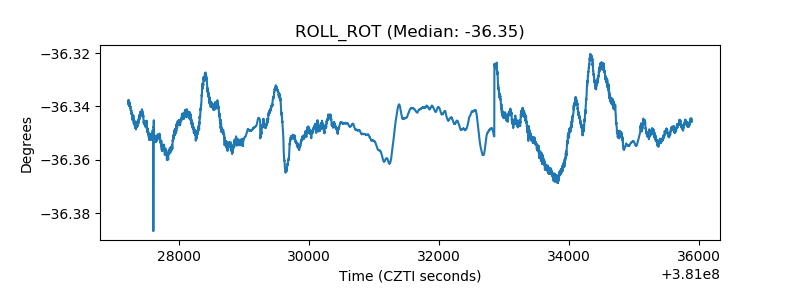 |
| _Roll_DEC | 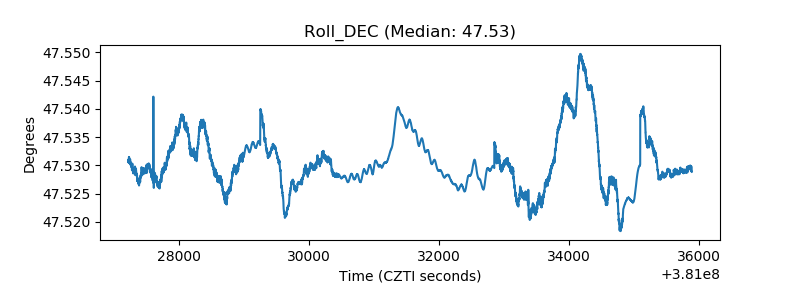 |
| _Roll_RA | 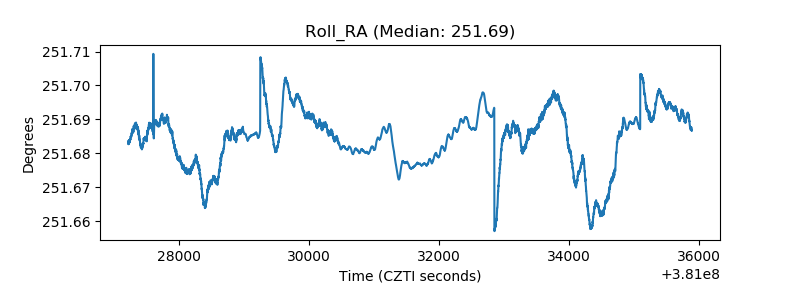 |
| Veto Counter | 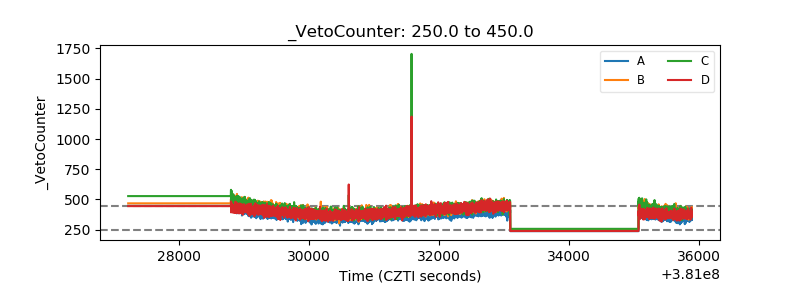 |