| Param | Original file | Final file |
|---|---|---|
| Filename | modeM0/AS1A11_059T09_9000004888_34249cztM0_level2.evt | modeM0/AS1A11_059T09_9000004888_34249cztM0_level2_quad_clean.evt |
| Size (bytes) | 468,743,040 | 95,996,160 |
| Size | 447.0 MB | 91.5 MB |
| Events in quadrant A | 2,963,918 | 649,439 |
| Events in quadrant B | 3,571,725 | 659,829 |
| Events in quadrant C | 3,247,724 | 651,809 |
| Events in quadrant D | 4,082,331 | 604,530 |
| Mode M0 | |||
|---|---|---|---|
| Quadrant | BADHDUFLAG | Total packets | Discarded packets |
| A | 0 | 12052 | 0 |
| B | 0 | 13696 | 0 |
| C | 0 | 12652 | 0 |
| D | 0 | 15466 | 0 |
| Mode SS | |||
|---|---|---|---|
| Quadrant | BADHDUFLAG | Total packets | Discarded packets |
| A | 0 | 98 | 0 |
| B | 0 | 98 | 0 |
| C | 0 | 98 | 0 |
| D | 0 | 98 | 0 |
| Mode M9 | |||
|---|---|---|---|
| Quadrant | BADHDUFLAG | Total packets | Discarded packets |
| A | 0 | 41 | 0 |
| B | 0 | 41 | 0 |
| C | 0 | 41 | 0 |
| D | 0 | 42 | 0 |
| Quadrant | Total seconds | Saturated seconds | Saturation percentage |
|---|---|---|---|
| A | 4873 | 6 | 0.123127% |
| B | 4873 | 379 | 7.777550% |
| C | 4873 | 196 | 4.022163% |
| D | 4873 | 337 | 6.915658% |
Noise dominated data is calculated using 1-second bins in cleaned event files. If a bin has >2000 counts, and if more than 50% of those come from <1% of pixels, then it is considered to be noise-dominated and hence unusable.
| Quadrant | # 1 sec bins | Bins with >0 counts | Bins with >2000 counts | High rate bins dominated by noise | Noise dominated (total time) | Noise dominated (detector-on time) | Marked lightcurve |
|---|---|---|---|---|---|---|---|
| A | 6997 | 4874 | 3 | 3 | 0.04% | 0.06% | 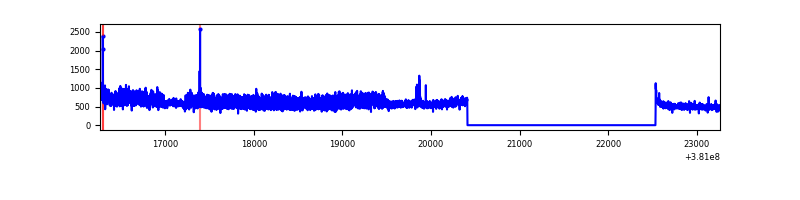 |
| B | 6997 | 4874 | 248 | 248 | 3.54% | 5.09% | 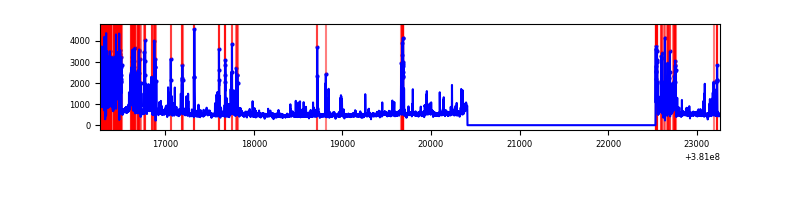 |
| C | 6997 | 4874 | 134 | 134 | 1.92% | 2.75% | 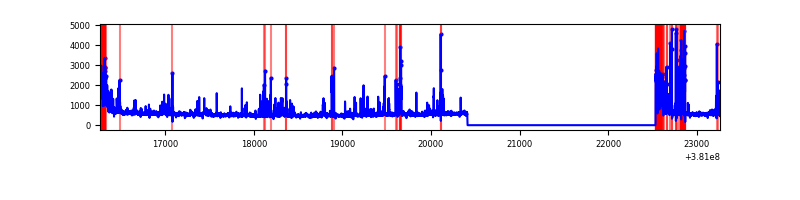 |
| D | 6997 | 4874 | 278 | 278 | 3.97% | 5.70% | 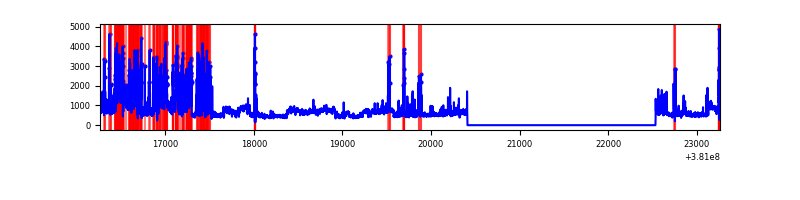 |
Top three noisy pixels from each quadrant. If the there are fewer than three noisy pixels in the level2.evt file, extra rows are filled as -1
| Pixel properties | Quadrant properties | ||||||
|---|---|---|---|---|---|---|---|
| Quadrant | DetID | PixID | Counts | Sigma | Mean | Median | Sigma |
| A | 15 | 47 | 606809 | 5123.97 | 599 | 589 | 118.3 |
| A | 10 | 83 | 23622 | 194.68 | 599 | 589 | 118.3 |
| A | 9 | 143 | 12582 | 101.37 | 599 | 589 | 118.3 |
| B | 5 | 172 | 817591 | 7493.86 | 582 | 569 | 109.0 |
| B | 4 | 251 | 176487 | 1613.55 | 582 | 569 | 109.0 |
| B | 15 | 222 | 88401 | 805.61 | 582 | 569 | 109.0 |
| C | 0 | 10 | 337385 | 2534.19 | 579 | 584 | 132.9 |
| C | 0 | 207 | 252712 | 1897.09 | 579 | 584 | 132.9 |
| C | 15 | 214 | 208174 | 1561.97 | 579 | 584 | 132.9 |
| D | 7 | 80 | 868711 | 6178.27 | 570 | 555 | 140.5 |
| D | 8 | 195 | 645530 | 4589.99 | 570 | 555 | 140.5 |
| D | 13 | 249 | 135911 | 963.26 | 570 | 555 | 140.5 |
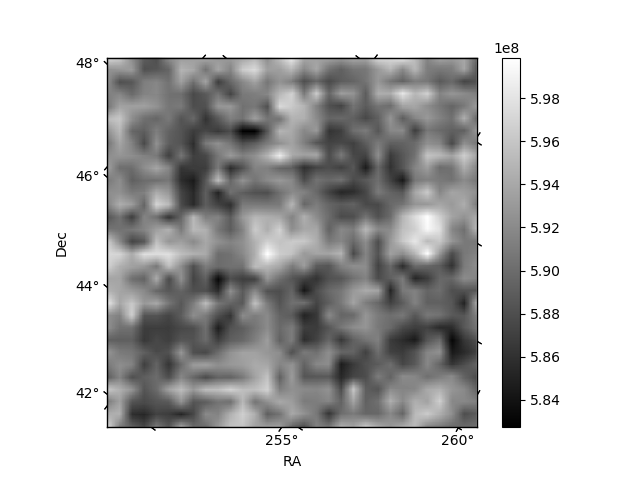
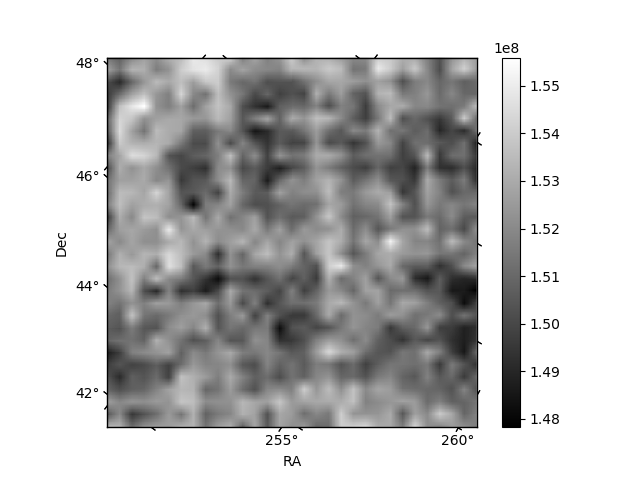
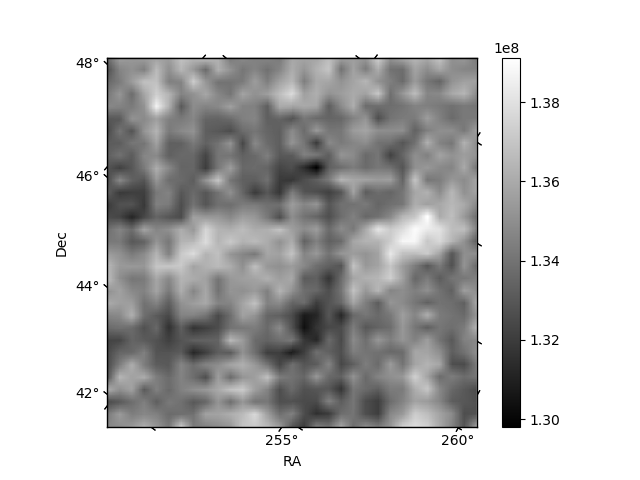
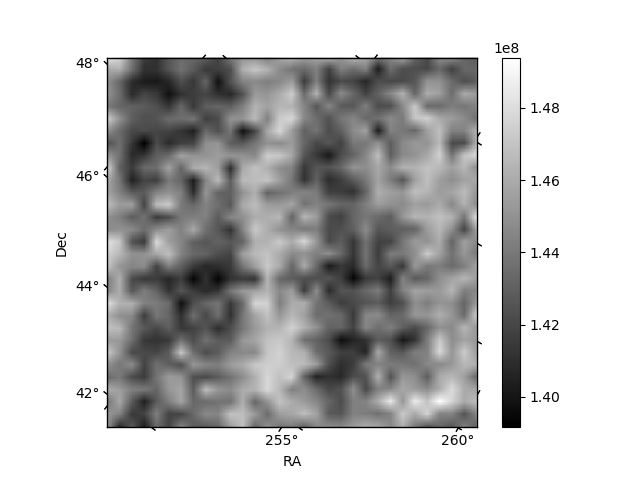
Histogram calculated using DETX and DETY for each event in the final _common_clean file
| Quadrant A | 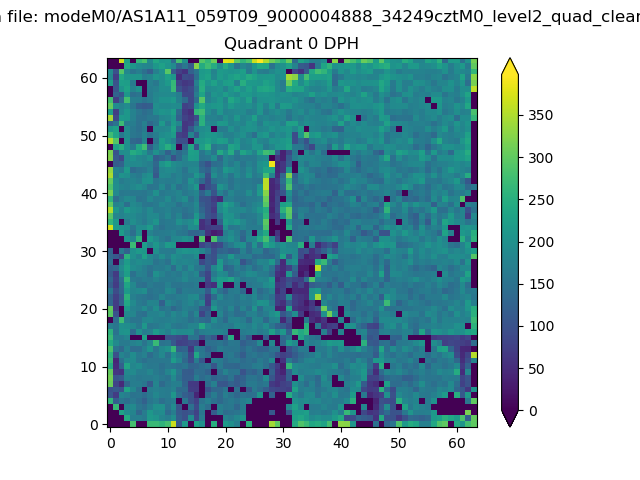 |
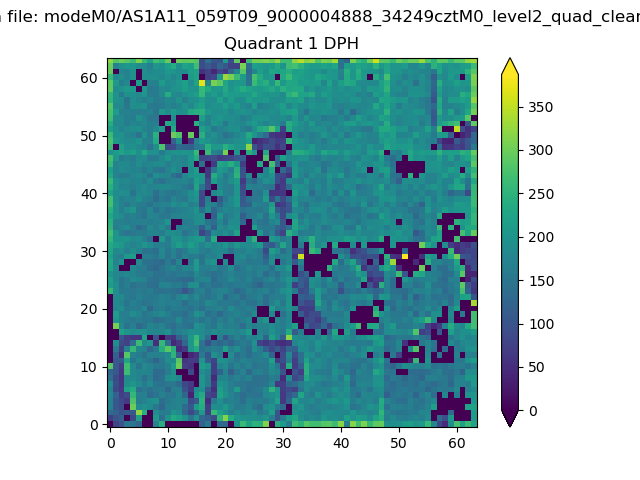 |
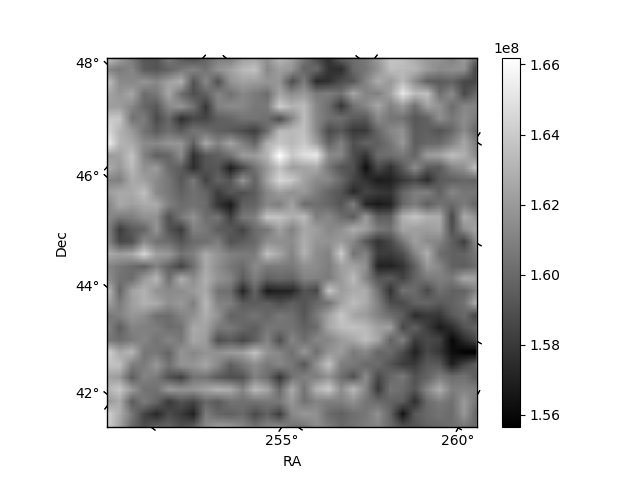
Quadrant B |
|---|---|---|---|
| Quadrant D | 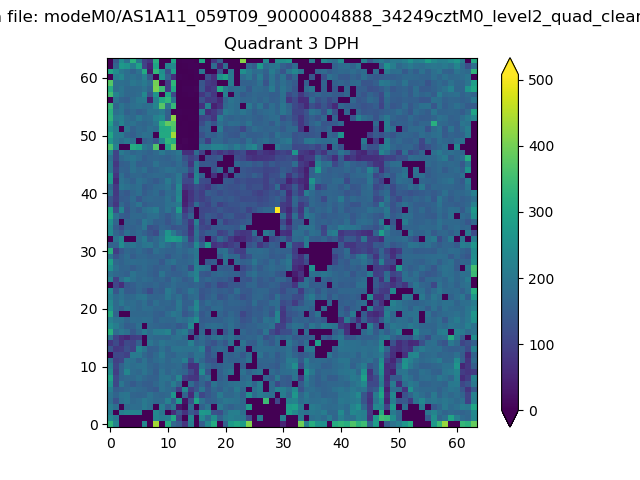 |
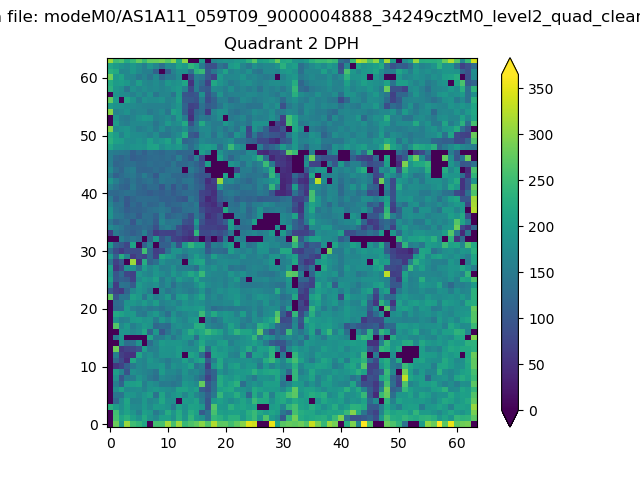 |
Quadrant C |
| Plot type | Count rate plots | Images |
|---|---|---|
| Comparison with Poisson distribution Blue bars denote a histogram of data divided into 1 sec bins. Red curve is a Poisson curve with rate = median count rate of data. |
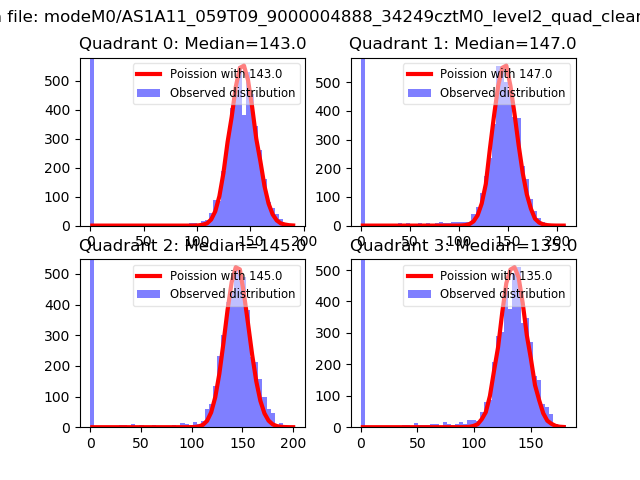 |
 |
| Quadrant-wise count rates Data is divided into 100 sec bins |
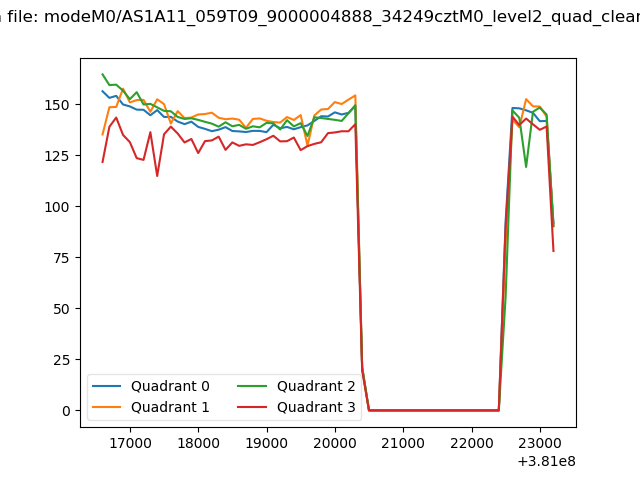 |
|
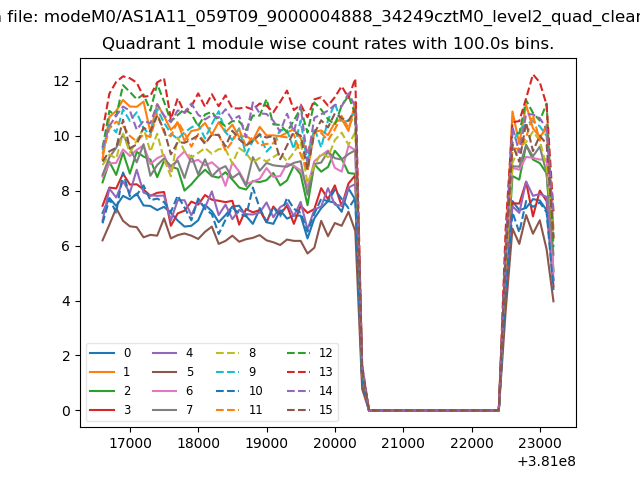
| Module-wise count rates for Quadrant A Data is divided into 100 sec bins |
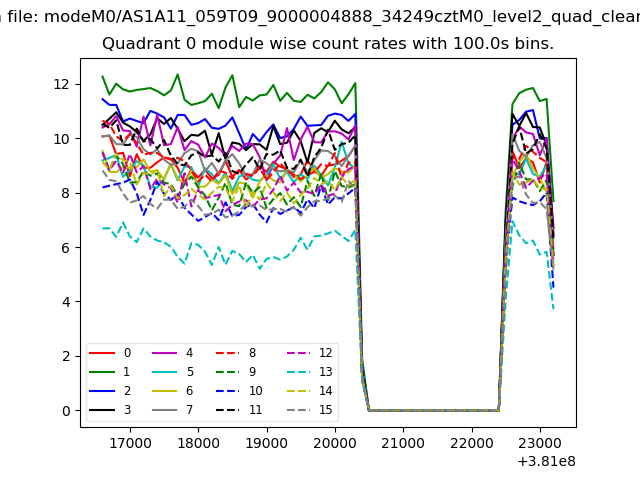 |
 |
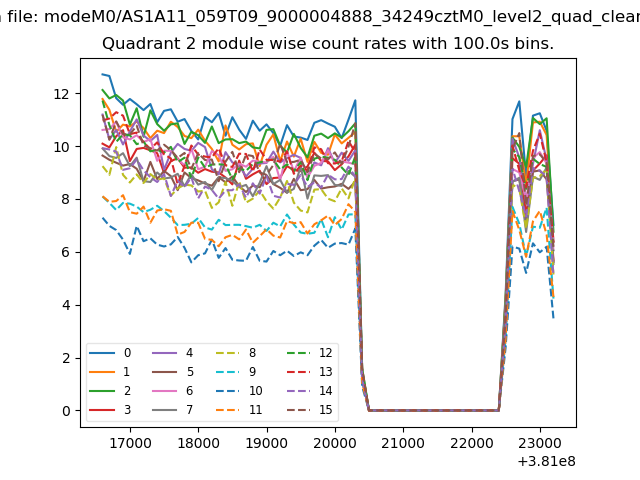
| Module-wise count rates for Quadrant B Data is divided into 100 sec bins |
 |
 |
| Module-wise count rates for Quadrant C Data is divided into 100 sec bins |
 |
 |
| Module-wise count rates for Quadrant D Data is divided into 100 sec bins |
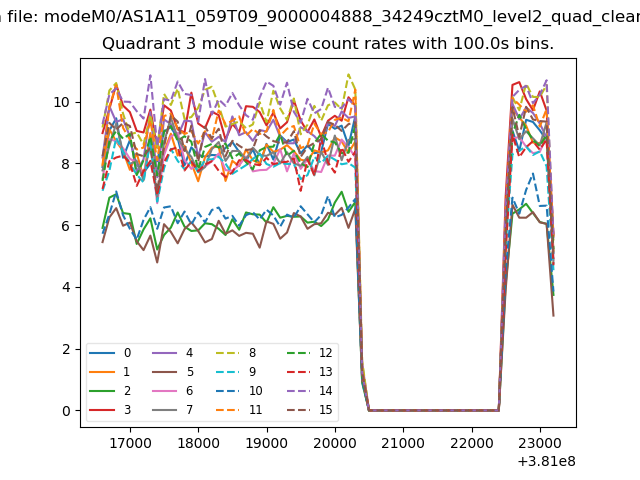 |
 |
| Parameter | Plot |
|---|---|
| CZT HV Monitor | 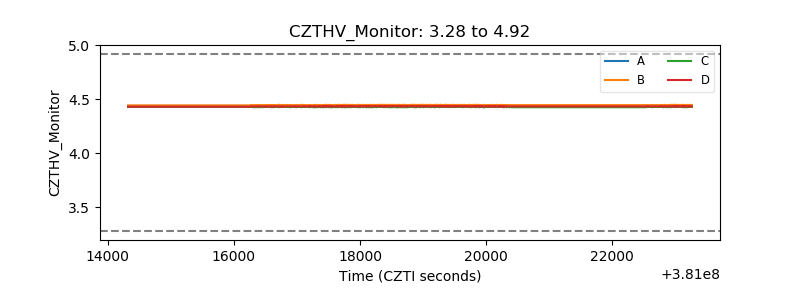 |
| D_VDD | 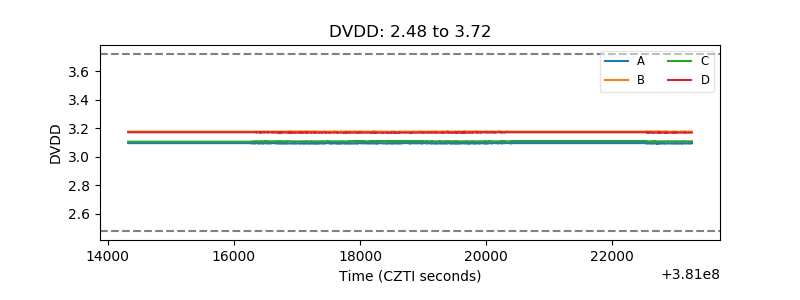 |
| Temperature 1 | 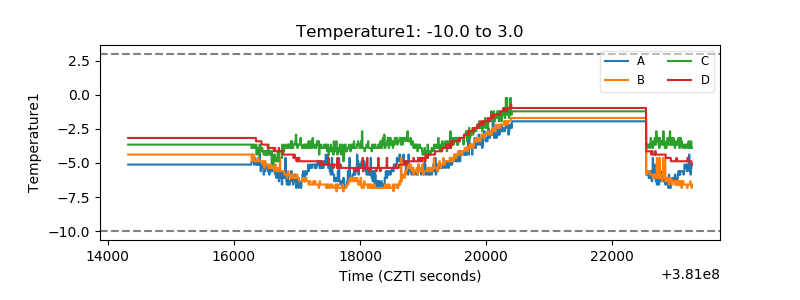 |
| Veto HV Monitor | 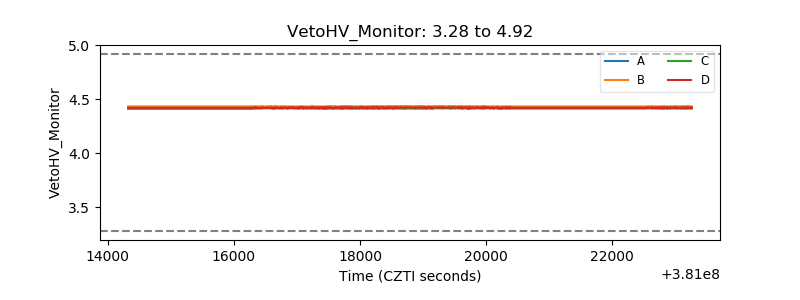 |
| Veto LLD | 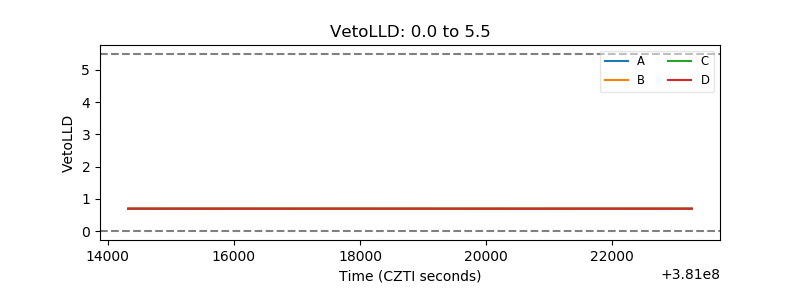 |
| Alpha Counter | 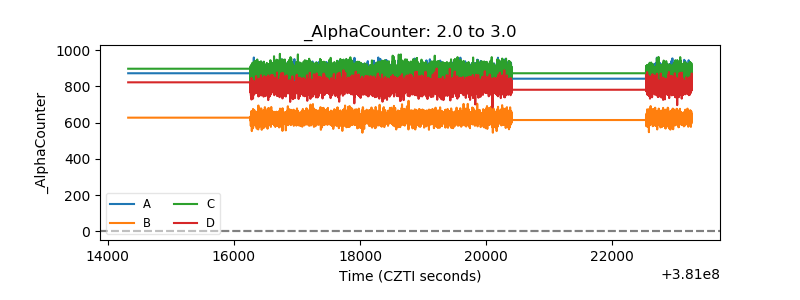 |
| _CPM_Rate | 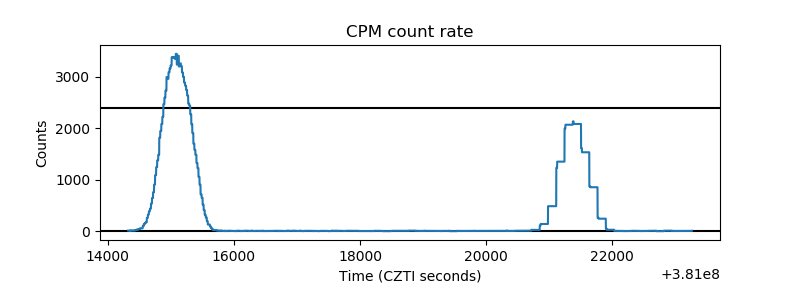 |
| CZT Counter | 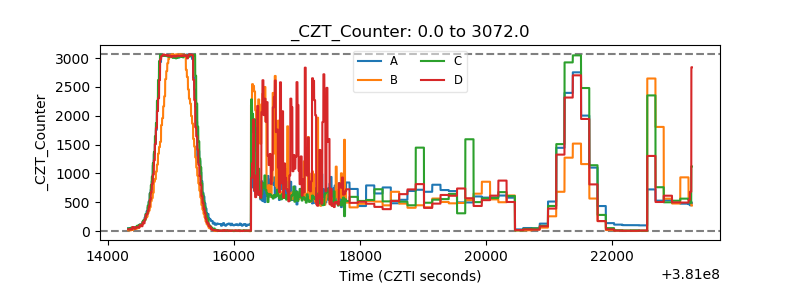 |
| +2.5 Volts monitor | 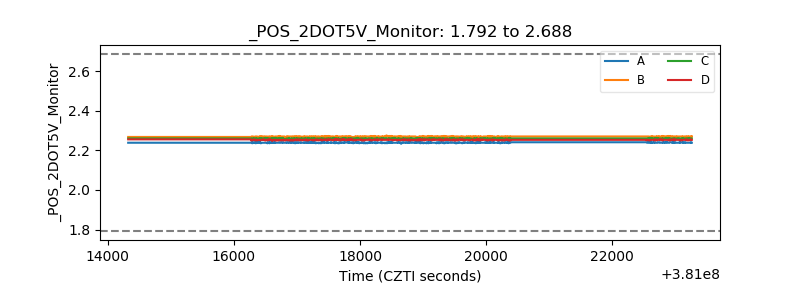 |
| +5 Volts monitor | 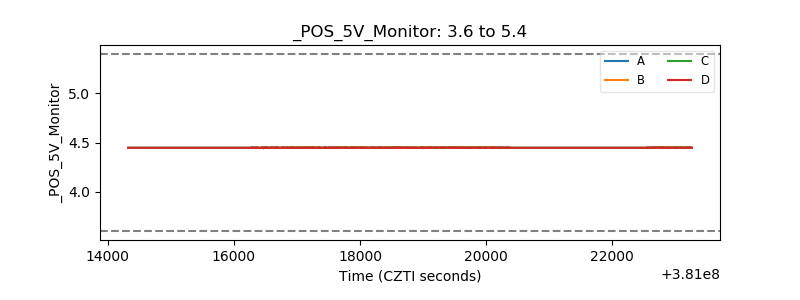 |
| _ROLL_ROT | 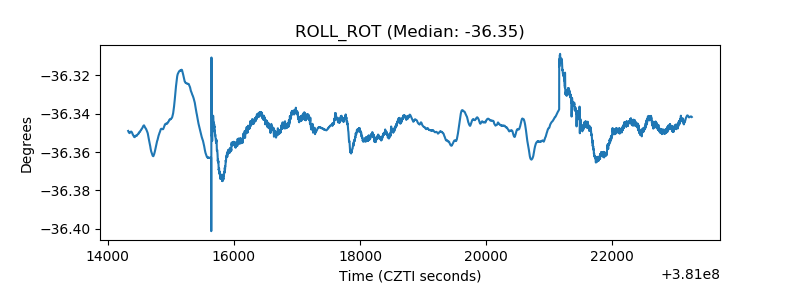 |
| _Roll_DEC | 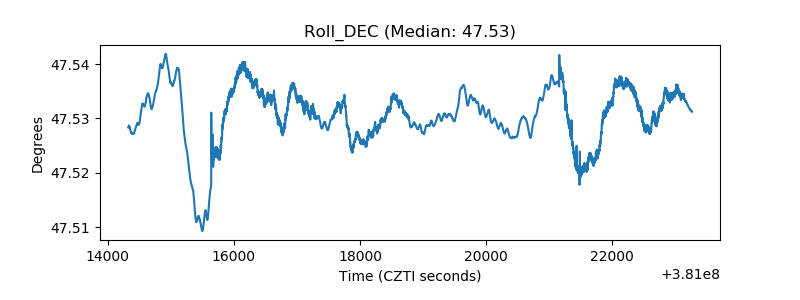 |
| _Roll_RA | 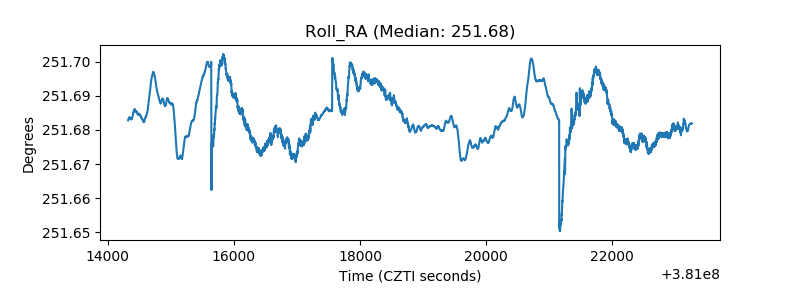 |
| Veto Counter | 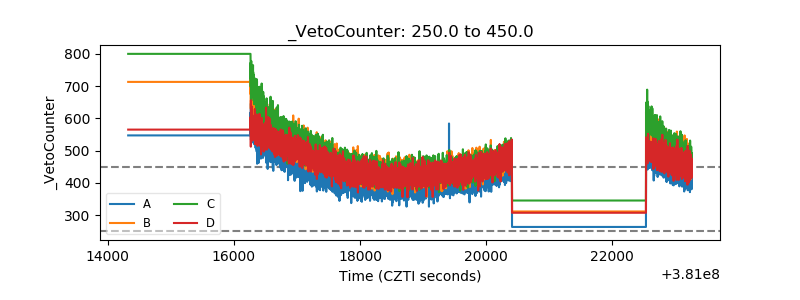 |