| Param | Original file | Final file |
|---|---|---|
| Filename | modeM0/AS1A11_059T09_9000004888_34247cztM0_level2.evt | modeM0/AS1A11_059T09_9000004888_34247cztM0_level2_quad_clean.evt |
| Size (bytes) | 472,864,320 | 68,094,720 |
| Size | 451.0 MB | 64.9 MB |
| Events in quadrant A | 2,567,924 | 435,720 |
| Events in quadrant B | 3,255,292 | 441,418 |
| Events in quadrant C | 4,348,326 | 423,421 |
| Events in quadrant D | 3,806,997 | 407,520 |
| Mode M0 | |||
|---|---|---|---|
| Quadrant | BADHDUFLAG | Total packets | Discarded packets |
| A | 0 | 10833 | 0 |
| B | 0 | 12956 | 0 |
| C | 0 | 16274 | 0 |
| D | 0 | 14727 | 0 |
| Mode SS | |||
|---|---|---|---|
| Quadrant | BADHDUFLAG | Total packets | Discarded packets |
| A | 0 | 102 | 0 |
| B | 0 | 102 | 0 |
| C | 0 | 102 | 0 |
| D | 0 | 102 | 0 |
| Mode M9 | |||
|---|---|---|---|
| Quadrant | BADHDUFLAG | Total packets | Discarded packets |
| A | 0 | 31 | 0 |
| B | 0 | 31 | 0 |
| C | 0 | 31 | 0 |
| D | 0 | 32 | 0 |
| Quadrant | Total seconds | Saturated seconds | Saturation percentage |
|---|---|---|---|
| A | 5049 | 10 | 0.198059% |
| B | 5049 | 138 | 2.733214% |
| C | 5049 | 399 | 7.902555% |
| D | 5049 | 224 | 4.436522% |
Noise dominated data is calculated using 1-second bins in cleaned event files. If a bin has >2000 counts, and if more than 50% of those come from <1% of pixels, then it is considered to be noise-dominated and hence unusable.
| Quadrant | # 1 sec bins | Bins with >0 counts | Bins with >2000 counts | High rate bins dominated by noise | Noise dominated (total time) | Noise dominated (detector-on time) | Marked lightcurve |
|---|---|---|---|---|---|---|---|
| A | 7021 | 5050 | 3 | 3 | 0.04% | 0.06% | 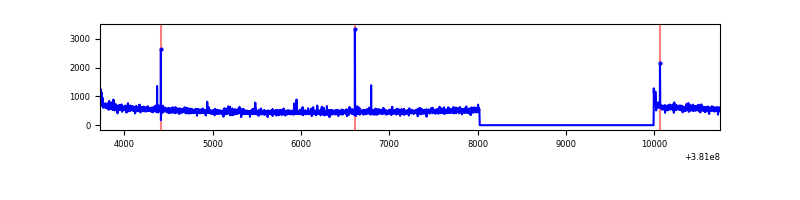 |
| B | 7021 | 5050 | 75 | 75 | 1.07% | 1.49% | 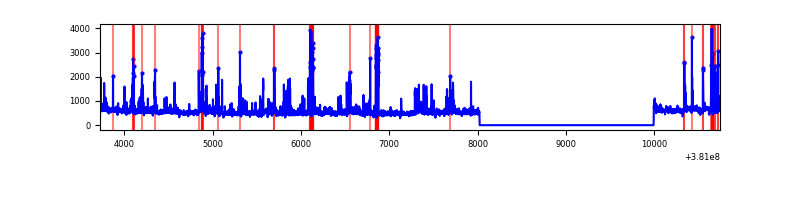 |
| C | 7021 | 5050 | 378 | 378 | 5.38% | 7.49% | 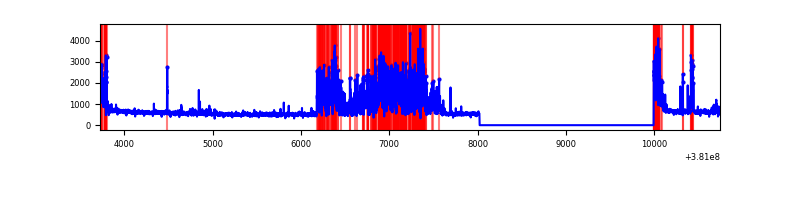 |
| D | 7021 | 5050 | 182 | 182 | 2.59% | 3.60% | 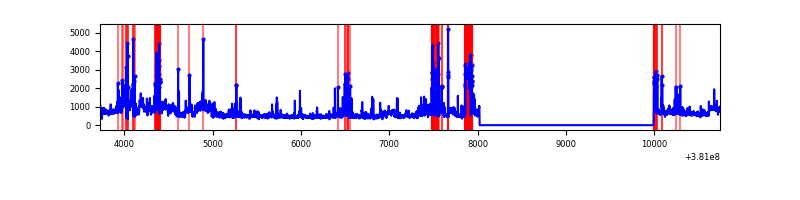 |
Top three noisy pixels from each quadrant. If the there are fewer than three noisy pixels in the level2.evt file, extra rows are filled as -1
| Pixel properties | Quadrant properties | ||||||
|---|---|---|---|---|---|---|---|
| Quadrant | DetID | PixID | Counts | Sigma | Mean | Median | Sigma |
| A | 10 | 83 | 24832 | 188.97 | 642 | 632 | 128.1 |
| A | 9 | 143 | 23505 | 178.61 | 642 | 632 | 128.1 |
| A | 15 | 47 | 16505 | 123.95 | 642 | 632 | 128.1 |
| B | 5 | 172 | 470899 | 3915.76 | 641 | 627 | 120.1 |
| B | 0 | 189 | 90148 | 745.4 | 641 | 627 | 120.1 |
| B | 4 | 171 | 73656 | 608.08 | 641 | 627 | 120.1 |
| C | 14 | 254 | 1306037 | 9174.33 | 621 | 626 | 142.3 |
| C | 0 | 10 | 261648 | 1834.44 | 621 | 626 | 142.3 |
| C | 15 | 214 | 215973 | 1513.44 | 621 | 626 | 142.3 |
| D | 8 | 195 | 576772 | 3884.25 | 618 | 604 | 148.3 |
| D | 7 | 80 | 290052 | 1951.32 | 618 | 604 | 148.3 |
| D | 13 | 249 | 278703 | 1874.81 | 618 | 604 | 148.3 |
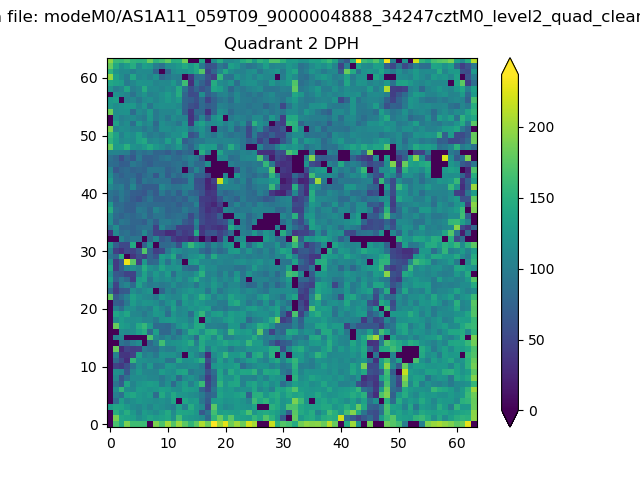
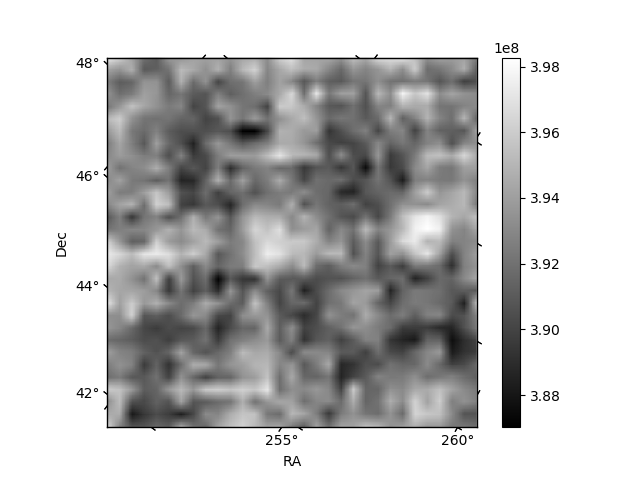
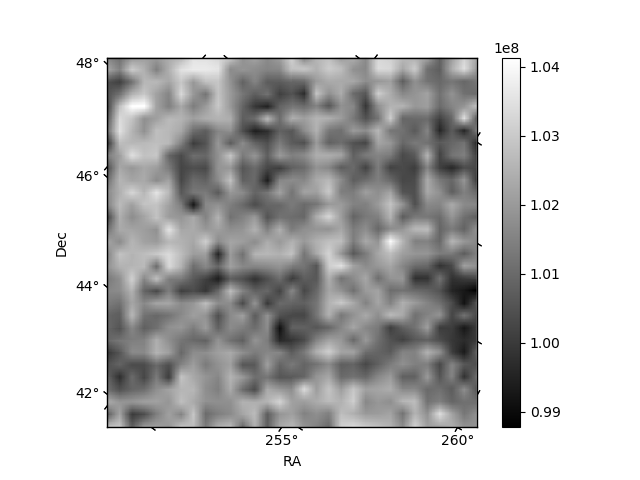
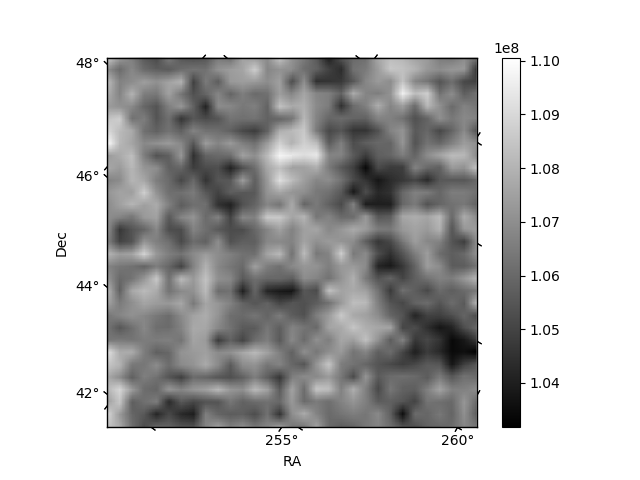
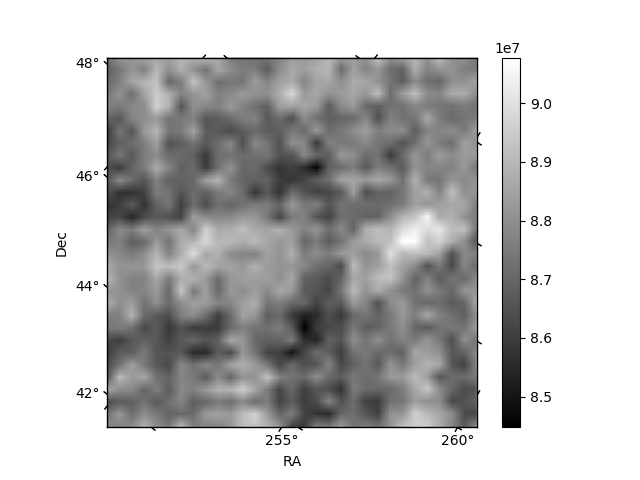
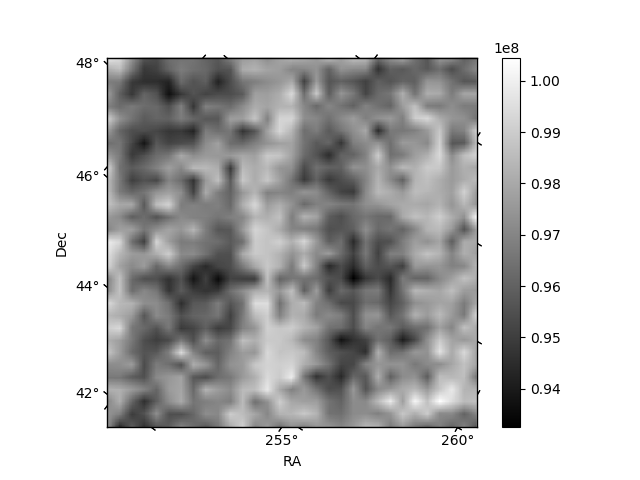
Histogram calculated using DETX and DETY for each event in the final _common_clean file
| Quadrant A | 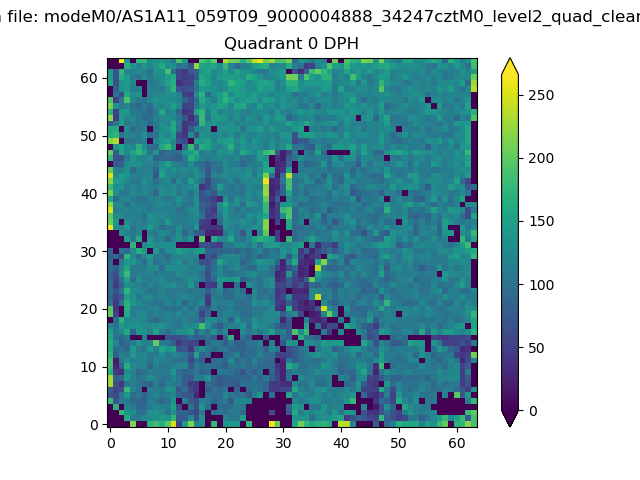 |
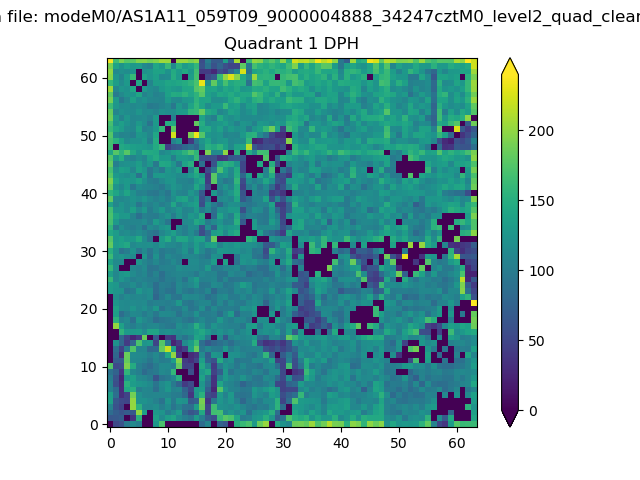 |
Quadrant B |
|---|---|---|---|
| Quadrant D | 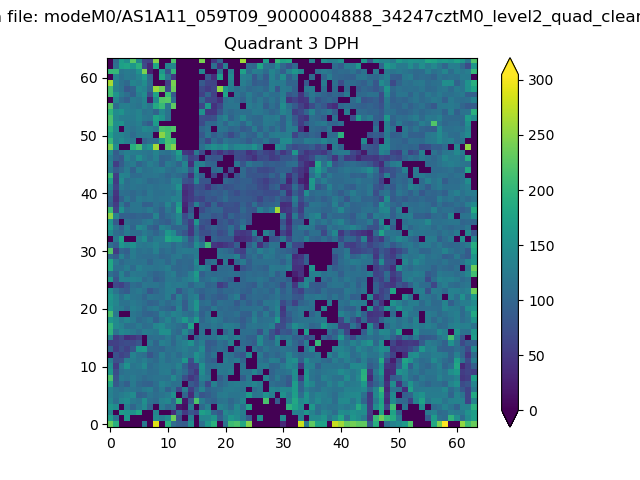 |
 |
Quadrant C |
| Plot type | Count rate plots | Images |
|---|---|---|
| Comparison with Poisson distribution Blue bars denote a histogram of data divided into 1 sec bins. Red curve is a Poisson curve with rate = median count rate of data. |
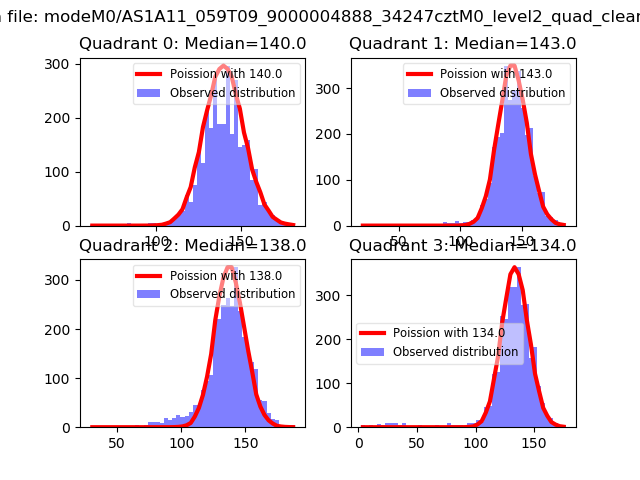 |
 |
| Quadrant-wise count rates Data is divided into 100 sec bins |
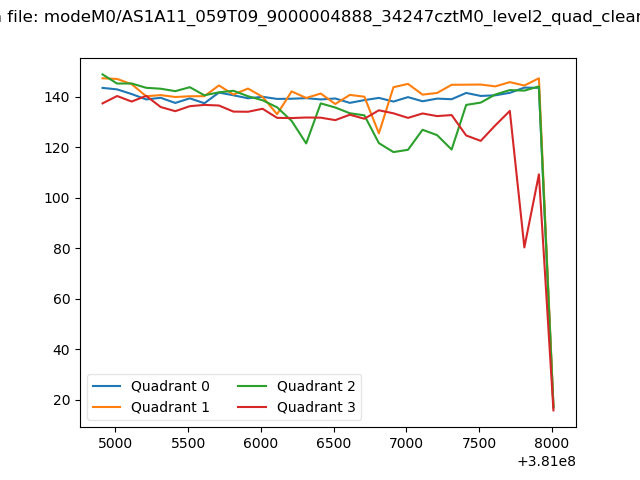 |
|
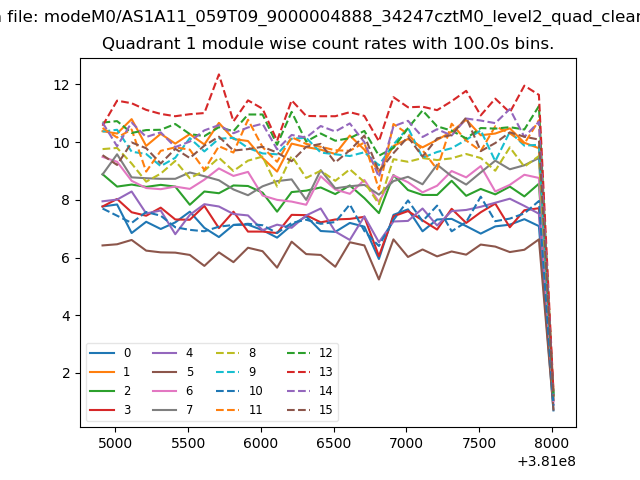
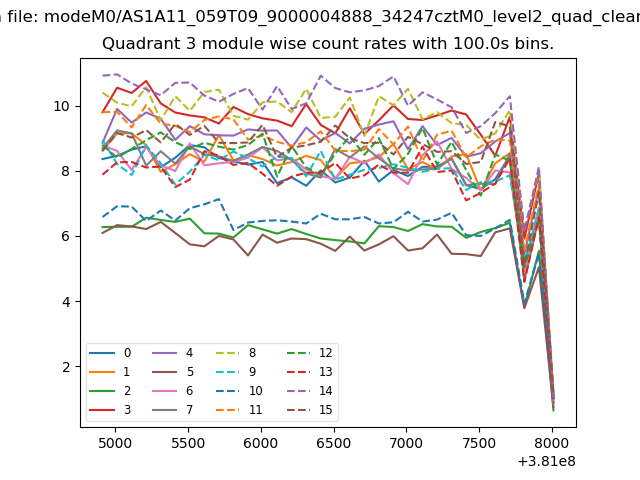
| Module-wise count rates for Quadrant A Data is divided into 100 sec bins |
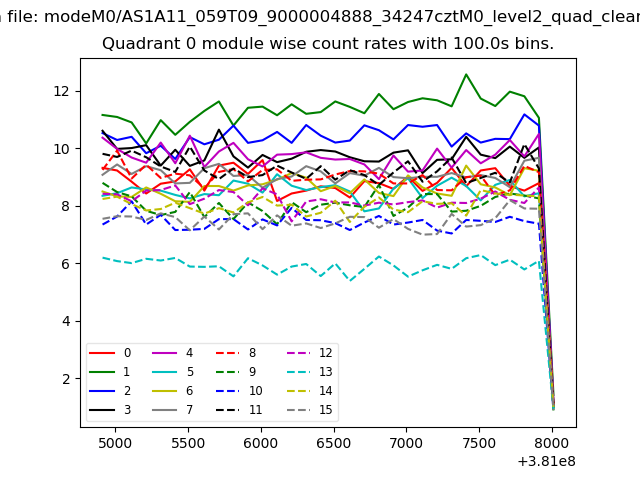 |
 |
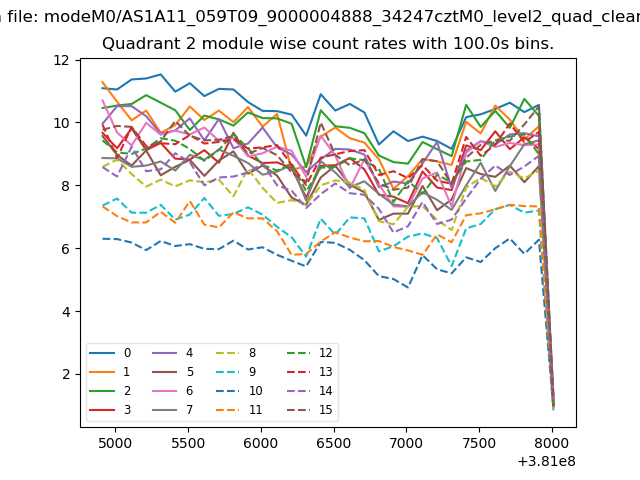
| Module-wise count rates for Quadrant B Data is divided into 100 sec bins |
 |
 |
| Module-wise count rates for Quadrant C Data is divided into 100 sec bins |
 |
 |
| Module-wise count rates for Quadrant D Data is divided into 100 sec bins |
 |
 |
| Parameter | Plot |
|---|---|
| CZT HV Monitor |  |
| D_VDD | 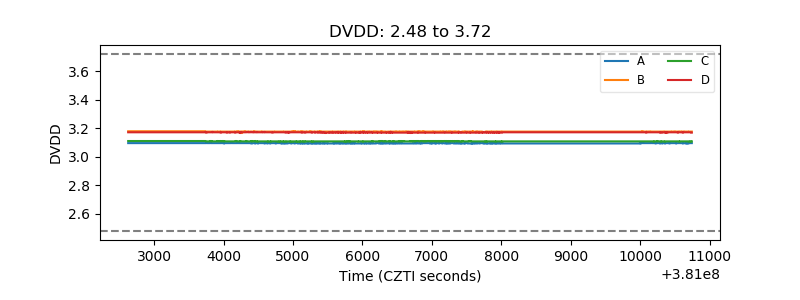 |
| Temperature 1 | 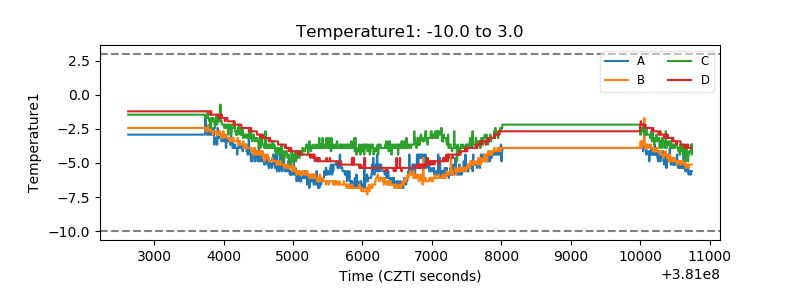 |
| Veto HV Monitor | 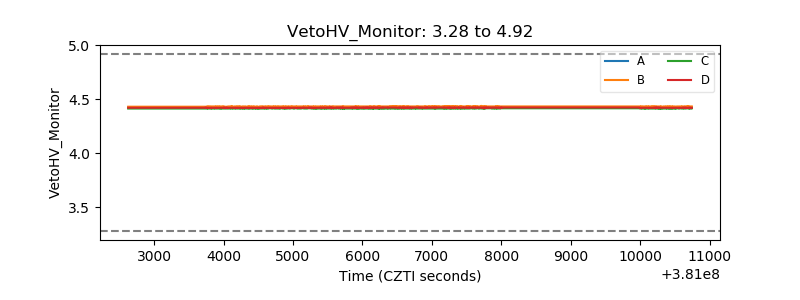 |
| Veto LLD | 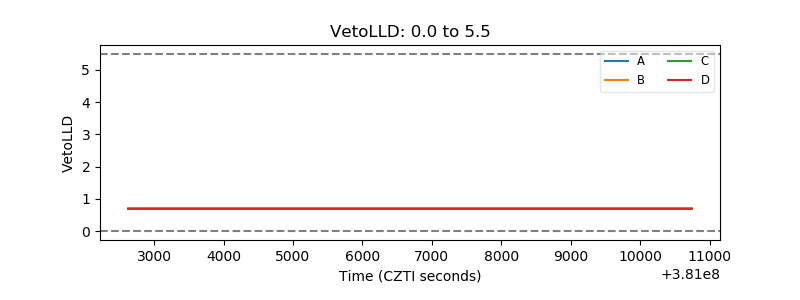 |
| Alpha Counter | 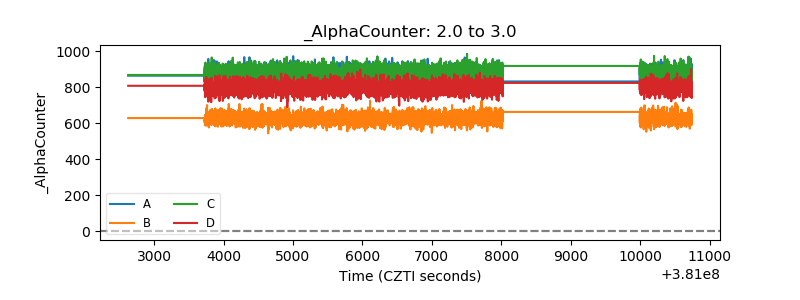 |
| _CPM_Rate | 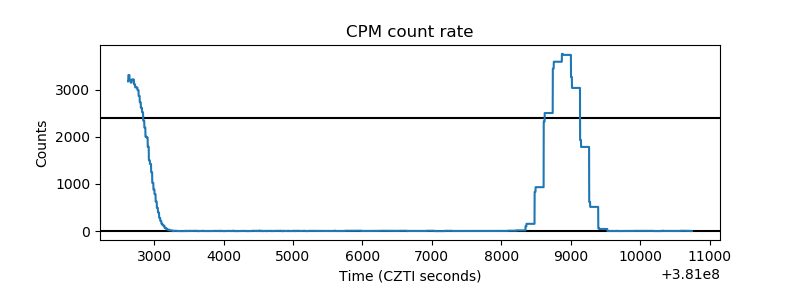 |
| CZT Counter | 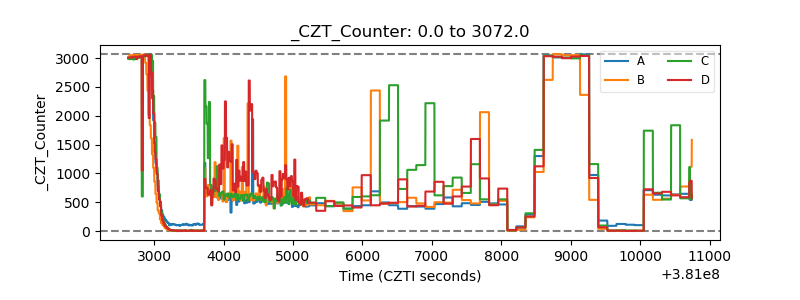 |
| +2.5 Volts monitor |  |
| +5 Volts monitor | 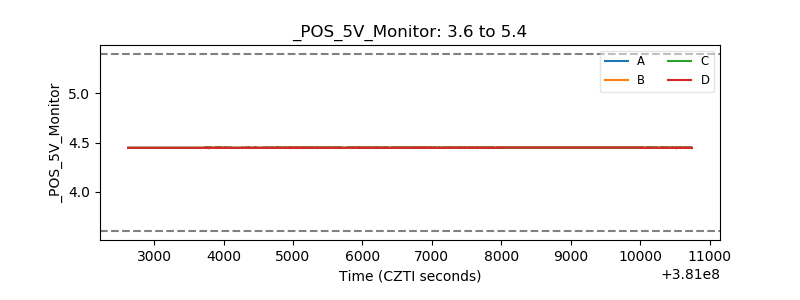 |
| _ROLL_ROT | 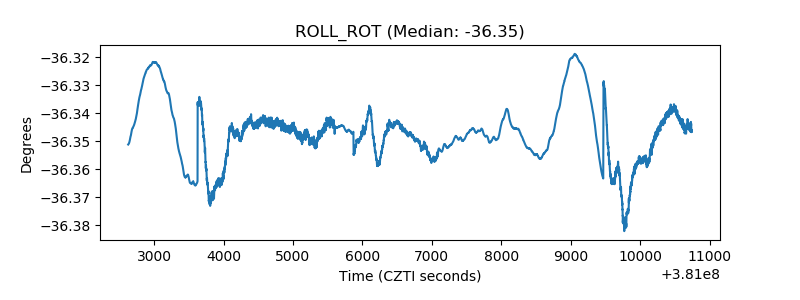 |
| _Roll_DEC | 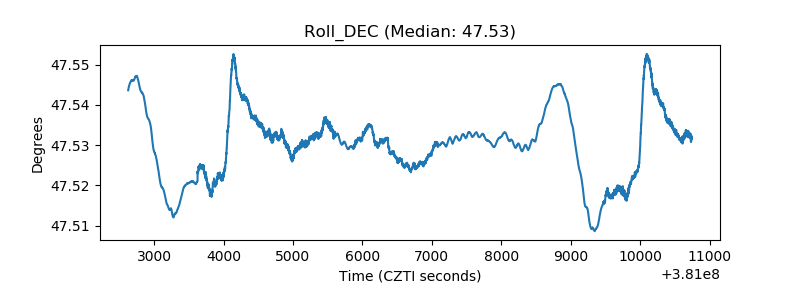 |
| _Roll_RA | 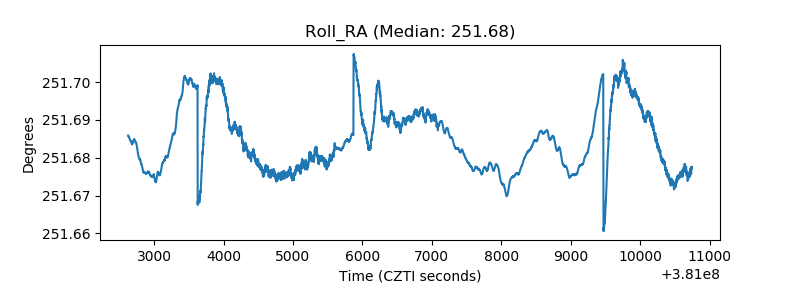 |
| Veto Counter | 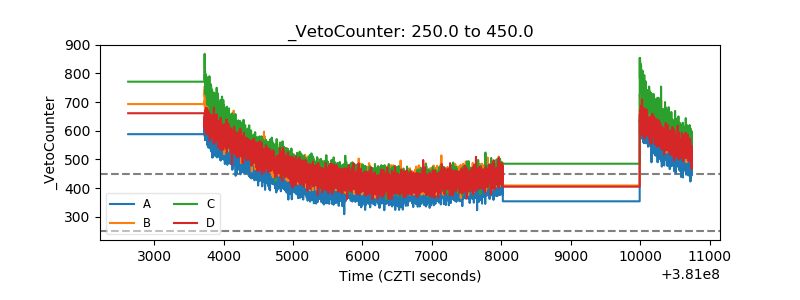 |