| Param | Original file | Final file |
|---|---|---|
| Filename | modeM0/AS1A11_059T09_9000004888_34243cztM0_level2.evt | modeM0/AS1A11_059T09_9000004888_34243cztM0_level2_quad_clean.evt |
| Size (bytes) | 457,554,240 | 57,582,720 |
| Size | 436.4 MB | 54.9 MB |
| Events in quadrant A | 2,626,590 | 344,646 |
| Events in quadrant B | 2,957,584 | 350,202 |
| Events in quadrant C | 3,208,635 | 334,421 |
| Events in quadrant D | 4,683,634 | 321,664 |
| Mode M0 | |||
|---|---|---|---|
| Quadrant | BADHDUFLAG | Total packets | Discarded packets |
| A | 0 | 11447 | 0 |
| B | 0 | 12288 | 0 |
| C | 0 | 12827 | 0 |
| D | 0 | 17793 | 0 |
| Mode SS | |||
|---|---|---|---|
| Quadrant | BADHDUFLAG | Total packets | Discarded packets |
| A | 0 | 114 | 0 |
| B | 0 | 114 | 0 |
| C | 0 | 114 | 0 |
| D | 0 | 114 | 0 |
| Mode M9 | |||
|---|---|---|---|
| Quadrant | BADHDUFLAG | Total packets | Discarded packets |
| A | 0 | 19 | 0 |
| B | 0 | 19 | 0 |
| C | 0 | 19 | 0 |
| D | 0 | 20 | 0 |
| Quadrant | Total seconds | Saturated seconds | Saturation percentage |
|---|---|---|---|
| A | 5610 | 8 | 0.142602% |
| B | 5610 | 42 | 0.748663% |
| C | 5610 | 87 | 1.550802% |
| D | 5610 | 246 | 4.385027% |
Noise dominated data is calculated using 1-second bins in cleaned event files. If a bin has >2000 counts, and if more than 50% of those come from <1% of pixels, then it is considered to be noise-dominated and hence unusable.
| Quadrant | # 1 sec bins | Bins with >0 counts | Bins with >2000 counts | High rate bins dominated by noise | Noise dominated (total time) | Noise dominated (detector-on time) | Marked lightcurve |
|---|---|---|---|---|---|---|---|
| A | 7192 | 5611 | 2 | 2 | 0.03% | 0.04% | 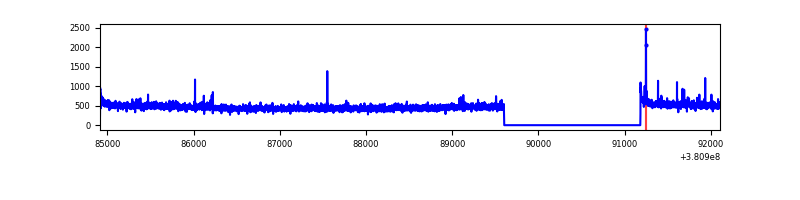 |
| B | 7192 | 5611 | 20 | 20 | 0.28% | 0.36% | 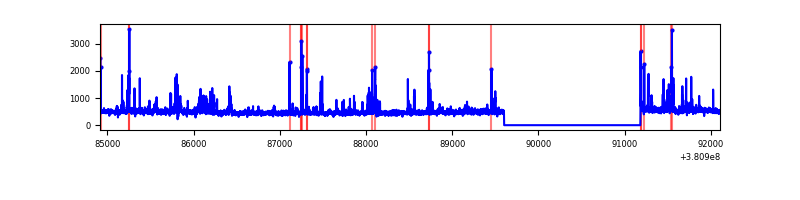 |
| C | 7192 | 5611 | 62 | 62 | 0.86% | 1.10% | 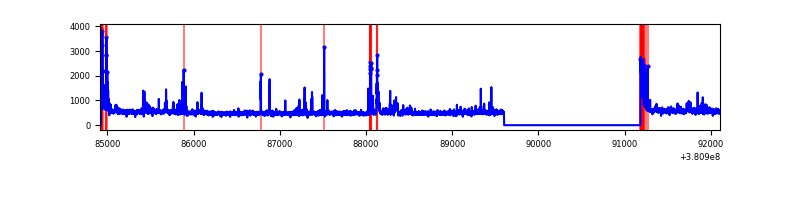 |
| D | 7192 | 5611 | 152 | 152 | 2.11% | 2.71% | 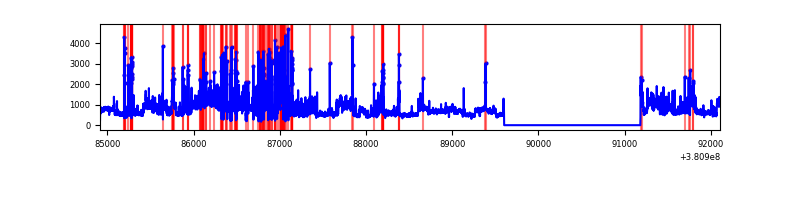 |
Top three noisy pixels from each quadrant. If the there are fewer than three noisy pixels in the level2.evt file, extra rows are filled as -1
| Pixel properties | Quadrant properties | ||||||
|---|---|---|---|---|---|---|---|
| Quadrant | DetID | PixID | Counts | Sigma | Mean | Median | Sigma |
| A | 9 | 143 | 25048 | 180.78 | 664 | 649 | 135.0 |
| A | 10 | 83 | 24429 | 176.19 | 664 | 649 | 135.0 |
| A | 13 | 6 | 12567 | 88.3 | 664 | 649 | 135.0 |
| B | 5 | 172 | 224877 | 1754.42 | 661 | 644 | 127.8 |
| B | 4 | 171 | 67461 | 522.78 | 661 | 644 | 127.8 |
| B | 5 | 255 | 20974 | 159.06 | 661 | 644 | 127.8 |
| C | 15 | 214 | 244795 | 1637.73 | 639 | 645 | 149.1 |
| C | 0 | 10 | 213759 | 1429.54 | 639 | 645 | 149.1 |
| C | 14 | 254 | 152509 | 1018.69 | 639 | 645 | 149.1 |
| D | 8 | 195 | 1184544 | 7546.47 | 632 | 615 | 156.9 |
| D | 7 | 80 | 647115 | 4120.85 | 632 | 615 | 156.9 |
| D | 2 | 249 | 88820 | 562.23 | 632 | 615 | 156.9 |
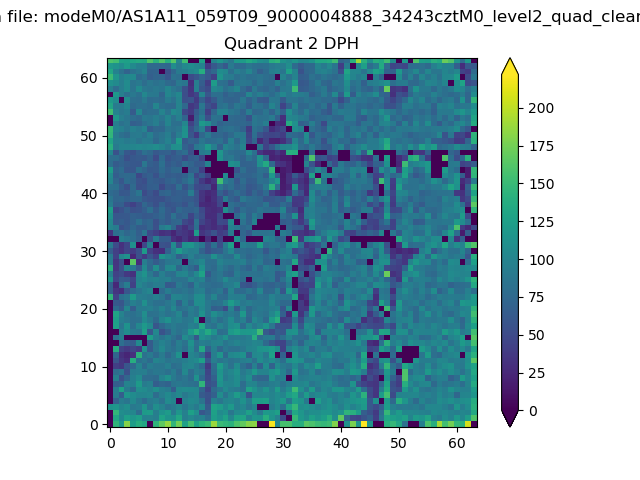
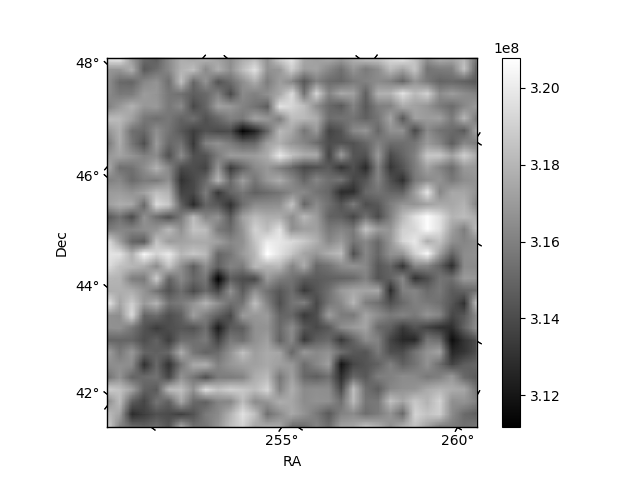
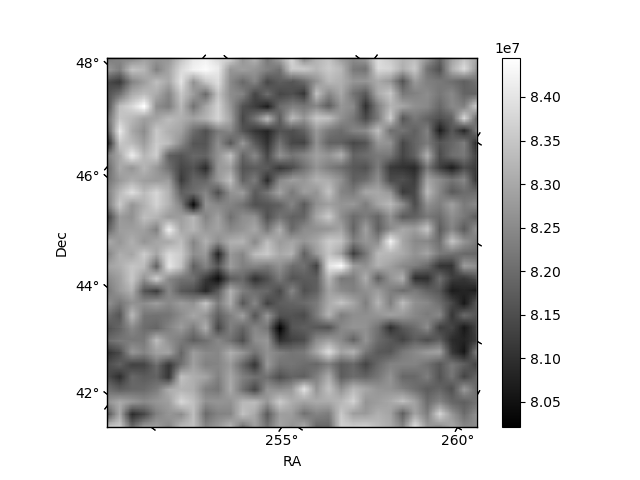
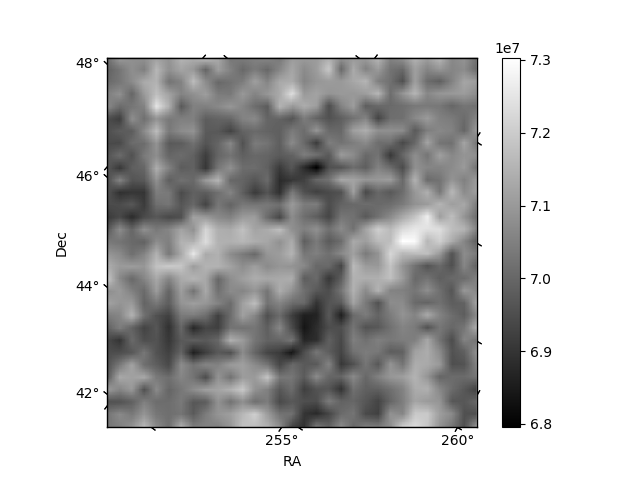
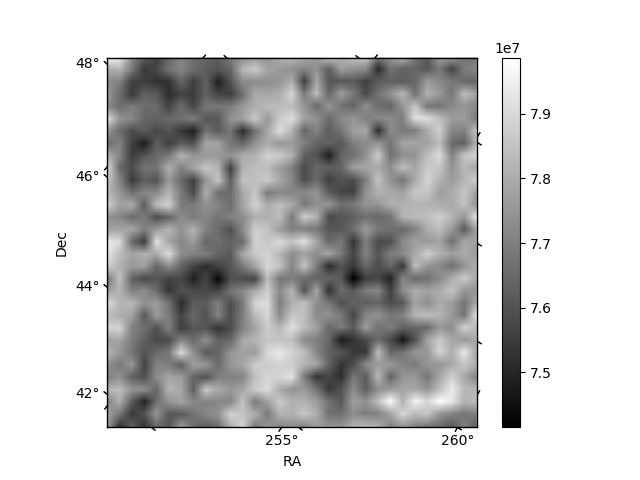
Histogram calculated using DETX and DETY for each event in the final _common_clean file
| Quadrant A | 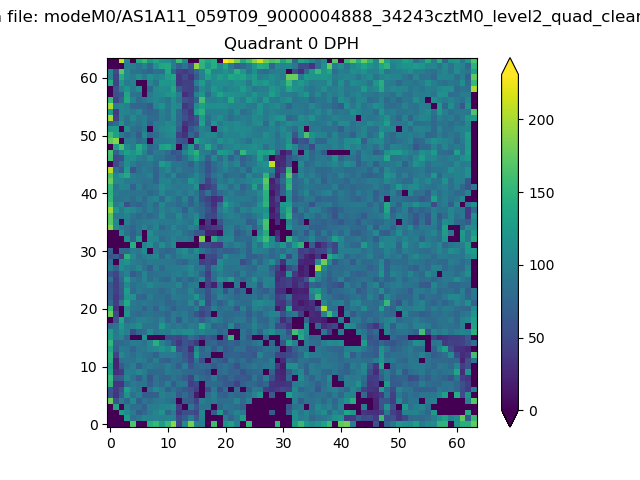 |
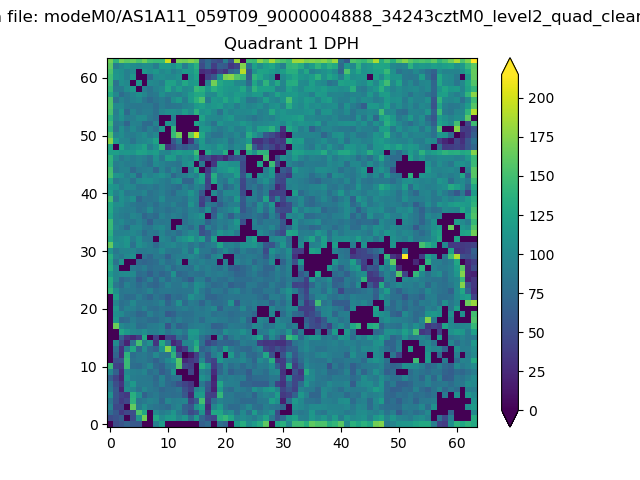 |
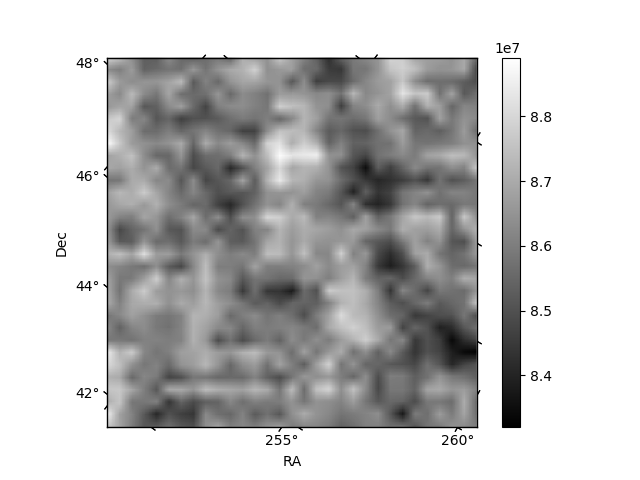
Quadrant B |
|---|---|---|---|
| Quadrant D | 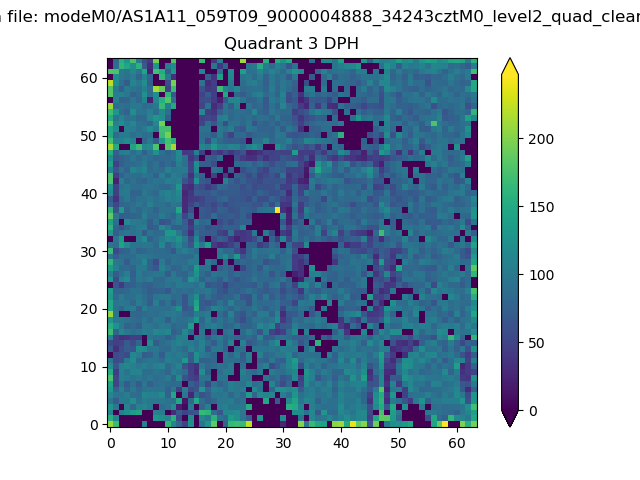 |
 |
Quadrant C |
| Plot type | Count rate plots | Images |
|---|---|---|
| Comparison with Poisson distribution Blue bars denote a histogram of data divided into 1 sec bins. Red curve is a Poisson curve with rate = median count rate of data. |
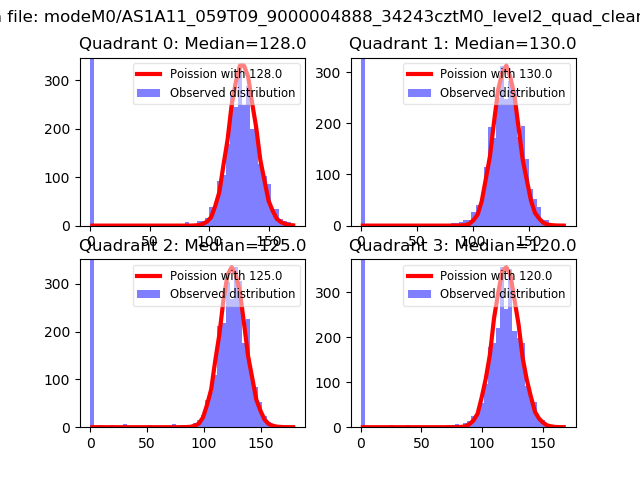 |
 |
| Quadrant-wise count rates Data is divided into 100 sec bins |
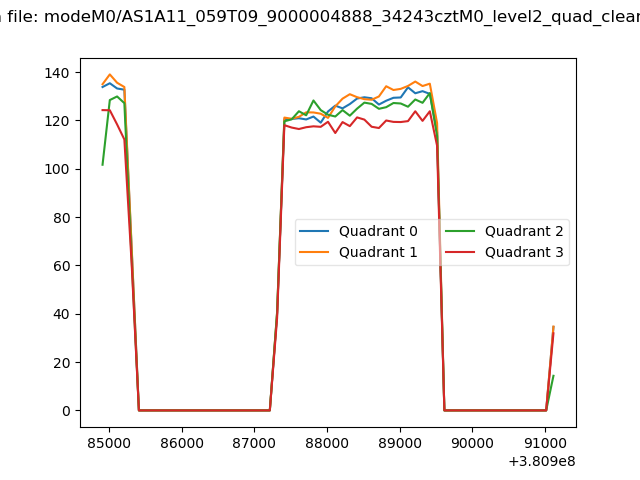 |
|
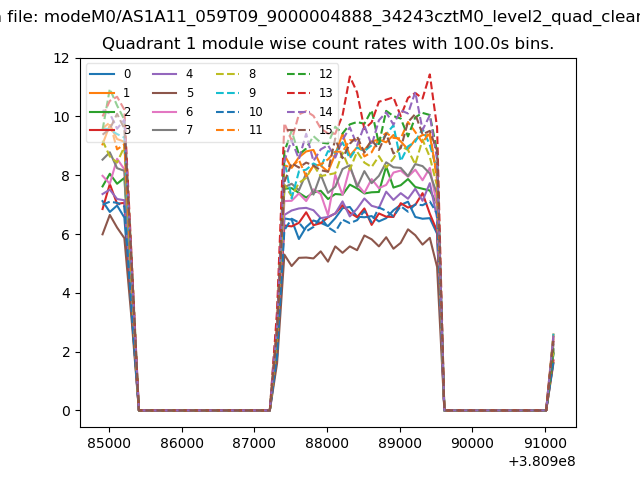
| Module-wise count rates for Quadrant A Data is divided into 100 sec bins |
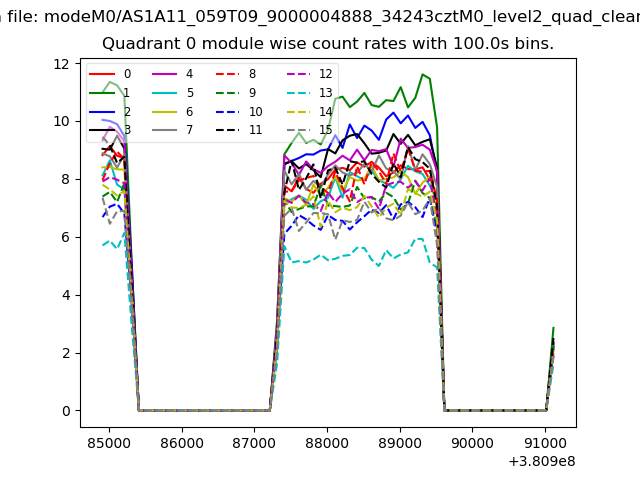 |
 |
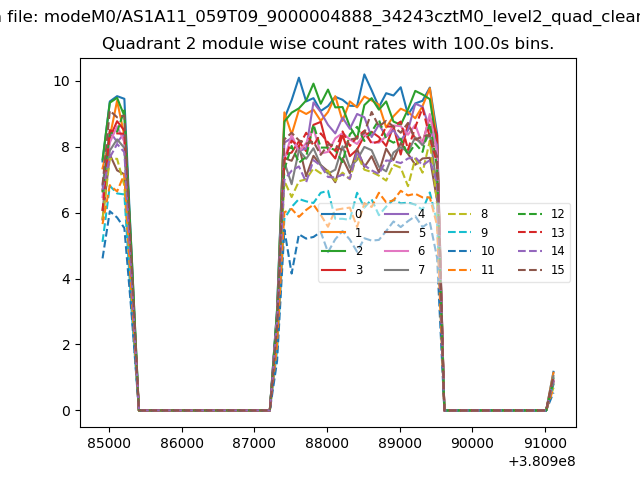
| Module-wise count rates for Quadrant B Data is divided into 100 sec bins |
 |
 |
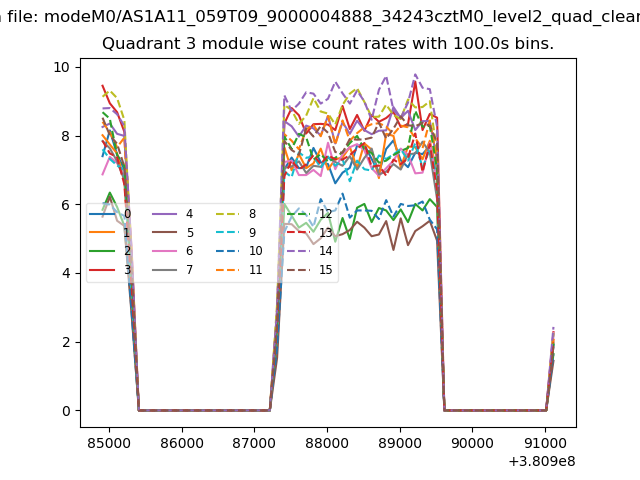
| Module-wise count rates for Quadrant C Data is divided into 100 sec bins |
 |
 |
| Module-wise count rates for Quadrant D Data is divided into 100 sec bins |
 |
 |
| Parameter | Plot |
|---|---|
| CZT HV Monitor | 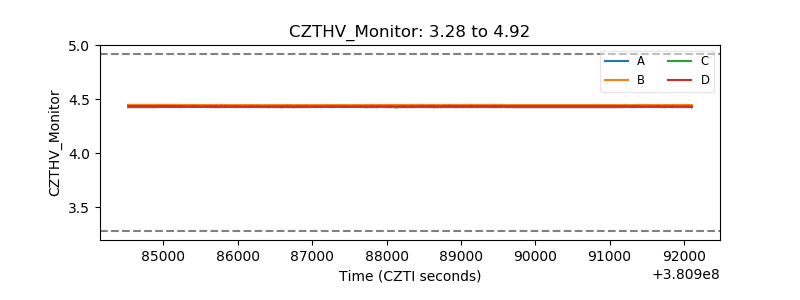 |
| D_VDD | 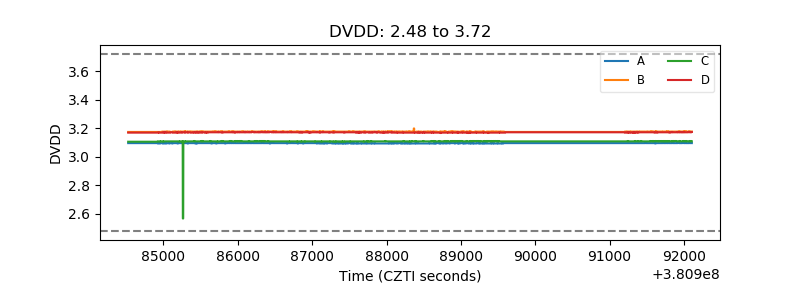 |
| Temperature 1 | 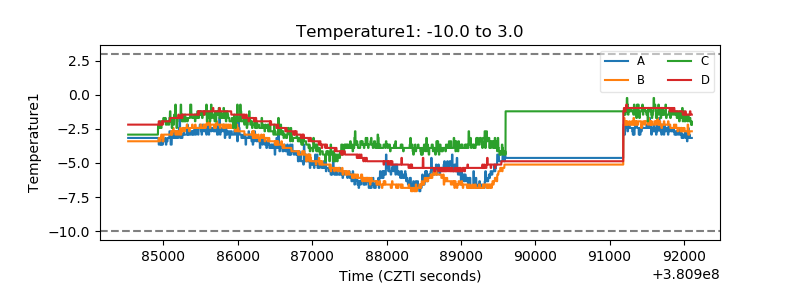 |
| Veto HV Monitor |  |
| Veto LLD | 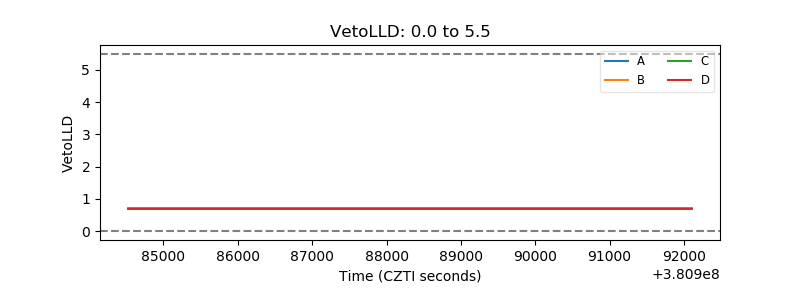 |
| Alpha Counter | 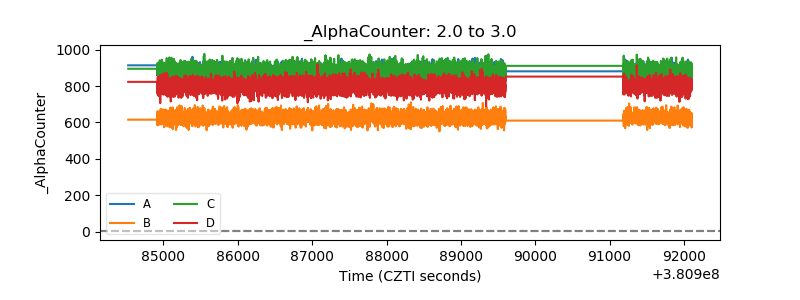 |
| _CPM_Rate | 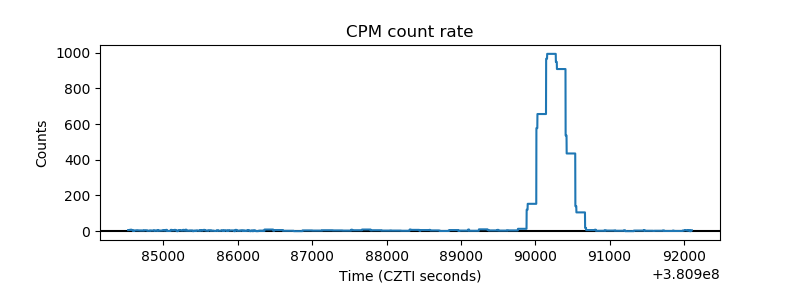 |
| CZT Counter | 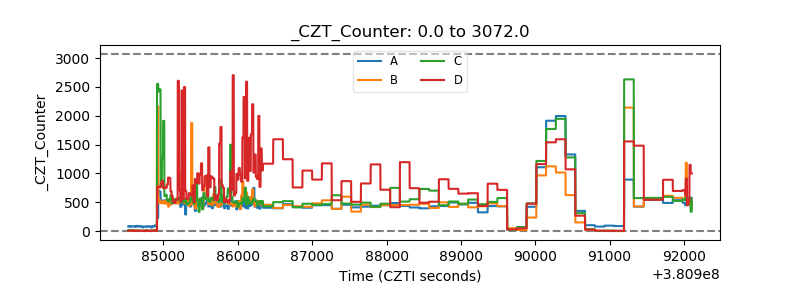 |
| +2.5 Volts monitor | 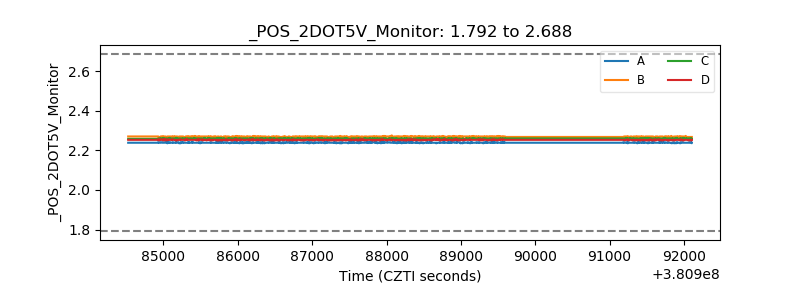 |
| +5 Volts monitor | 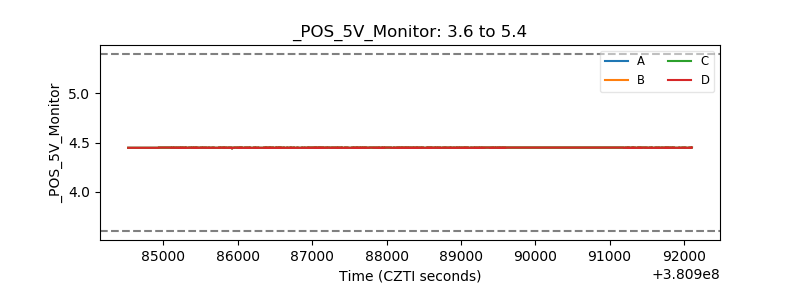 |
| _ROLL_ROT | 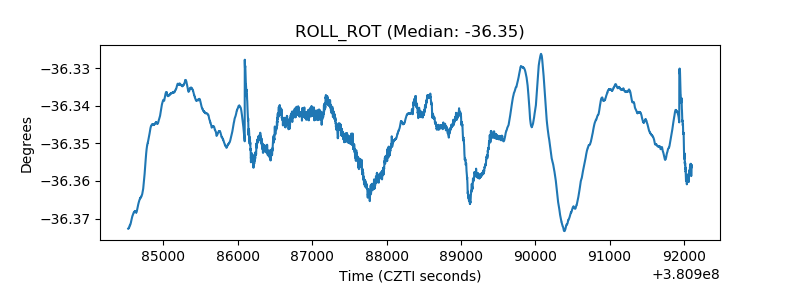 |
| _Roll_DEC | 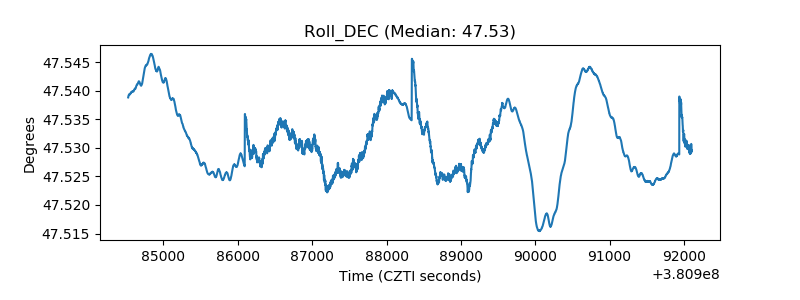 |
| _Roll_RA | 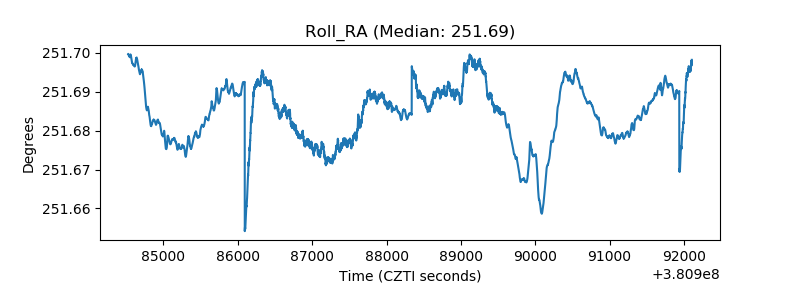 |
| Veto Counter | 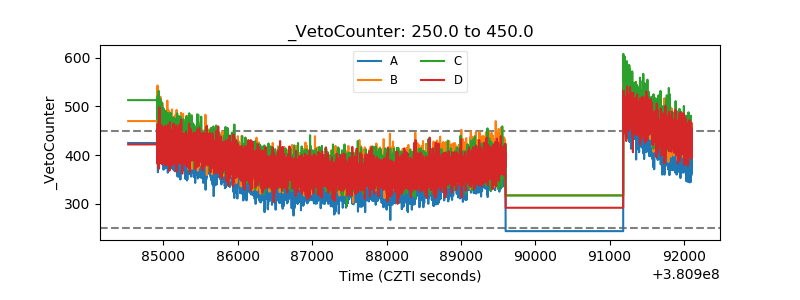 |