| Param | Original file | Final file |
|---|---|---|
| Filename | modeM0/AS1A11_059T09_9000004888_34239cztM0_level2.evt | modeM0/AS1A11_059T09_9000004888_34239cztM0_level2_quad_clean.evt |
| Size (bytes) | 524,839,680 | 74,485,440 |
| Size | 500.5 MB | 71.0 MB |
| Events in quadrant A | 4,294,428 | 457,671 |
| Events in quadrant B | 3,368,744 | 476,698 |
| Events in quadrant C | 3,148,875 | 466,093 |
| Events in quadrant D | 4,683,802 | 443,197 |
| Mode M0 | |||
|---|---|---|---|
| Quadrant | BADHDUFLAG | Total packets | Discarded packets |
| A | 0 | 16587 | 0 |
| B | 0 | 13866 | 0 |
| C | 0 | 12947 | 0 |
| D | 0 | 17933 | 0 |
| Mode SS | |||
|---|---|---|---|
| Quadrant | BADHDUFLAG | Total packets | Discarded packets |
| A | 0 | 120 | 0 |
| B | 0 | 120 | 0 |
| C | 0 | 120 | 0 |
| D | 0 | 120 | 0 |
| Mode M9 | |||
|---|---|---|---|
| Quadrant | BADHDUFLAG | Total packets | Discarded packets |
| A | 0 | 15 | 0 |
| B | 0 | 15 | 0 |
| C | 0 | 15 | 0 |
| D | 0 | 16 | 0 |
| Quadrant | Total seconds | Saturated seconds | Saturation percentage |
|---|---|---|---|
| A | 5888 | 280 | 4.755435% |
| B | 5888 | 207 | 3.515625% |
| C | 5888 | 89 | 1.511549% |
| D | 5888 | 142 | 2.411685% |
Noise dominated data is calculated using 1-second bins in cleaned event files. If a bin has >2000 counts, and if more than 50% of those come from <1% of pixels, then it is considered to be noise-dominated and hence unusable.
| Quadrant | # 1 sec bins | Bins with >0 counts | Bins with >2000 counts | High rate bins dominated by noise | Noise dominated (total time) | Noise dominated (detector-on time) | Marked lightcurve |
|---|---|---|---|---|---|---|---|
| A | 7201 | 5889 | 249 | 249 | 3.46% | 4.23% | 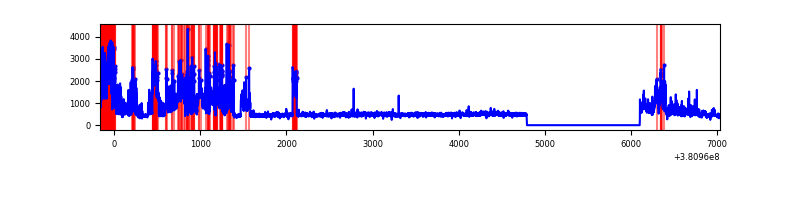 |
| B | 7201 | 5889 | 125 | 125 | 1.74% | 2.12% | 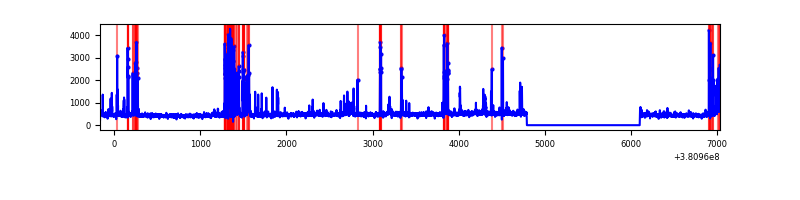 |
| C | 7201 | 5889 | 66 | 66 | 0.92% | 1.12% | 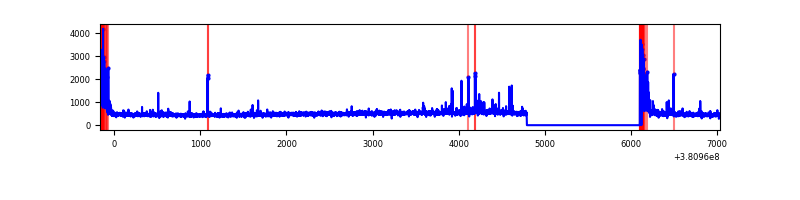 |
| D | 7201 | 5889 | 94 | 94 | 1.31% | 1.60% | 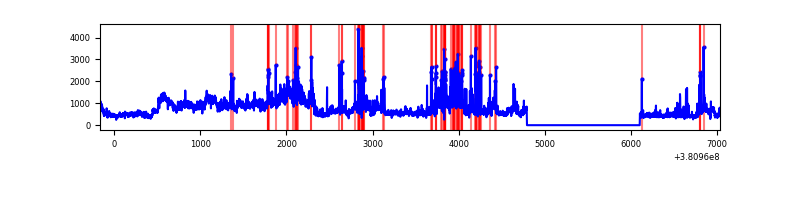 |
Top three noisy pixels from each quadrant. If the there are fewer than three noisy pixels in the level2.evt file, extra rows are filled as -1
| Pixel properties | Quadrant properties | ||||||
|---|---|---|---|---|---|---|---|
| Quadrant | DetID | PixID | Counts | Sigma | Mean | Median | Sigma |
| A | 15 | 169 | 1684859 | 12711.88 | 662 | 649 | 132.5 |
| A | 10 | 83 | 21908 | 160.46 | 662 | 649 | 132.5 |
| A | 13 | 6 | 12574 | 90.01 | 662 | 649 | 132.5 |
| B | 5 | 172 | 606813 | 4782.58 | 659 | 644 | 126.7 |
| B | 15 | 85 | 39213 | 304.3 | 659 | 644 | 126.7 |
| B | 15 | 222 | 28084 | 216.5 | 659 | 644 | 126.7 |
| C | 0 | 10 | 261988 | 1743.52 | 643 | 648 | 149.9 |
| C | 15 | 214 | 256345 | 1705.87 | 643 | 648 | 149.9 |
| C | 14 | 254 | 63202 | 417.33 | 643 | 648 | 149.9 |
| D | 7 | 223 | 949928 | 6049.12 | 642 | 624 | 156.9 |
| D | 8 | 195 | 688901 | 4385.82 | 642 | 624 | 156.9 |
| D | 2 | 250 | 226946 | 1442.16 | 642 | 624 | 156.9 |
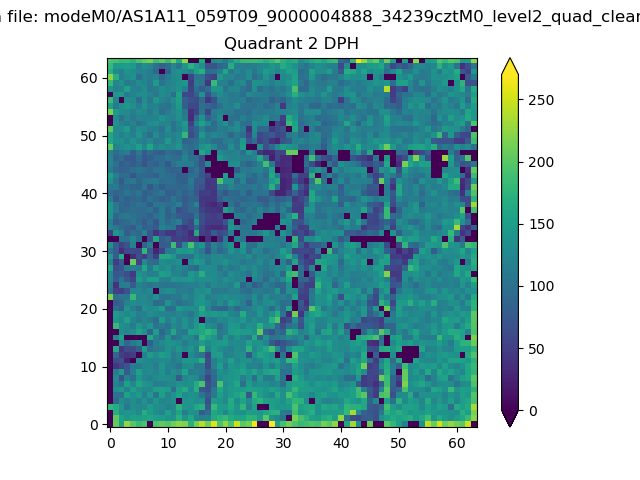
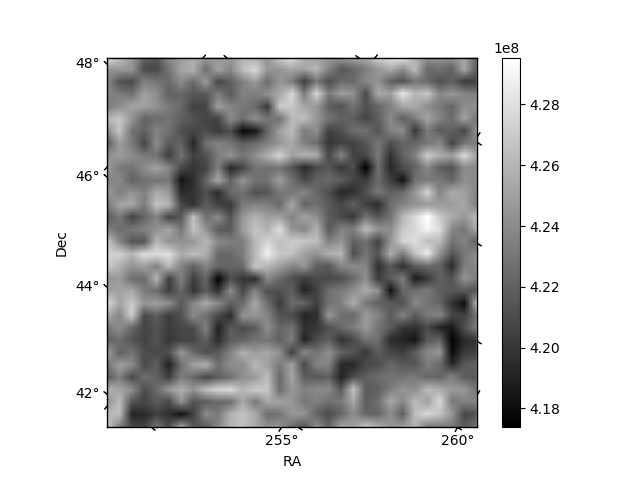
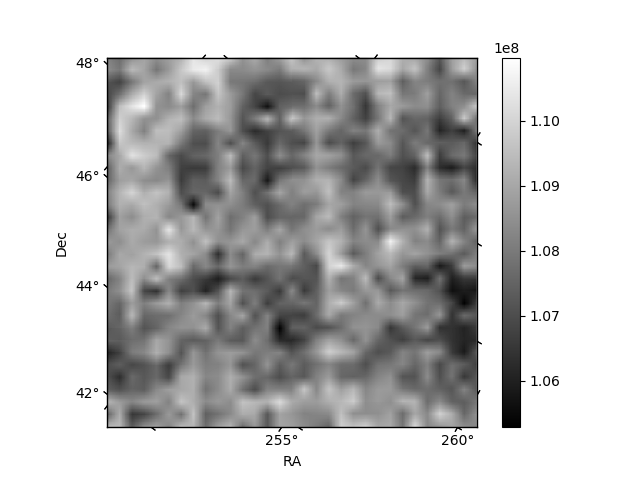
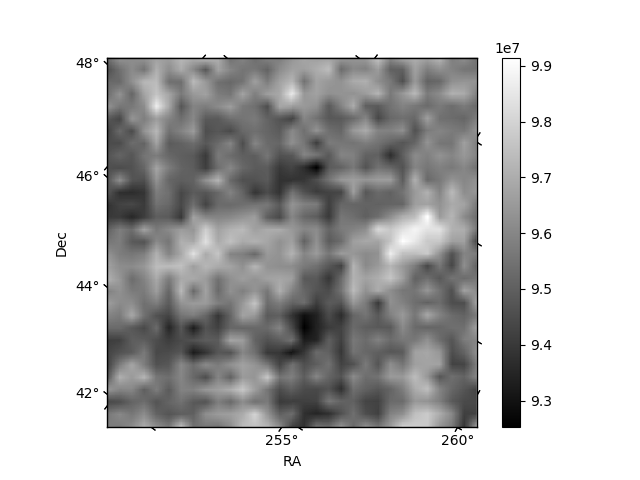
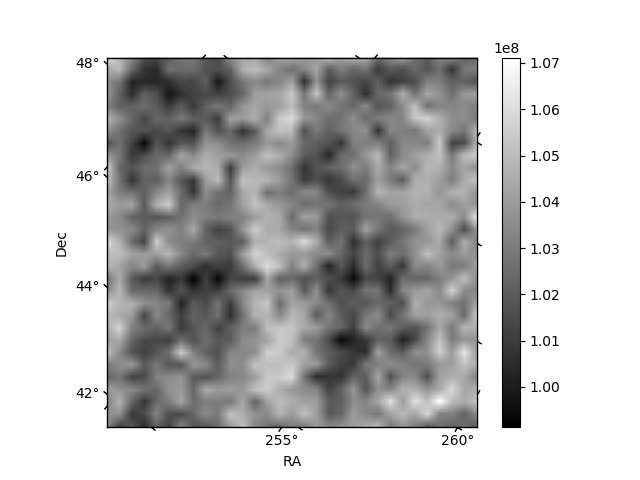
Histogram calculated using DETX and DETY for each event in the final _common_clean file
| Quadrant A | 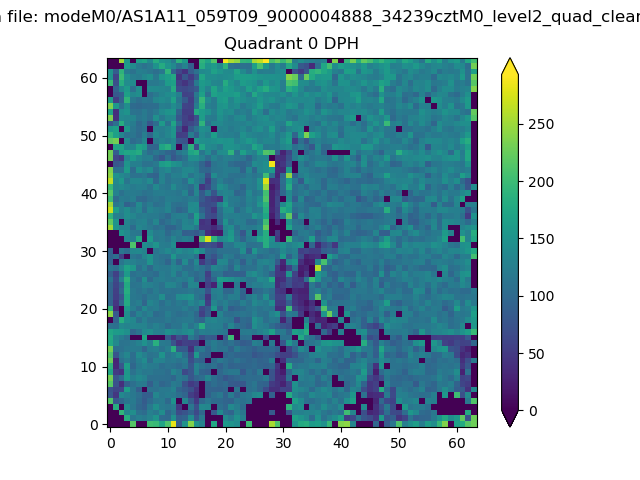 |
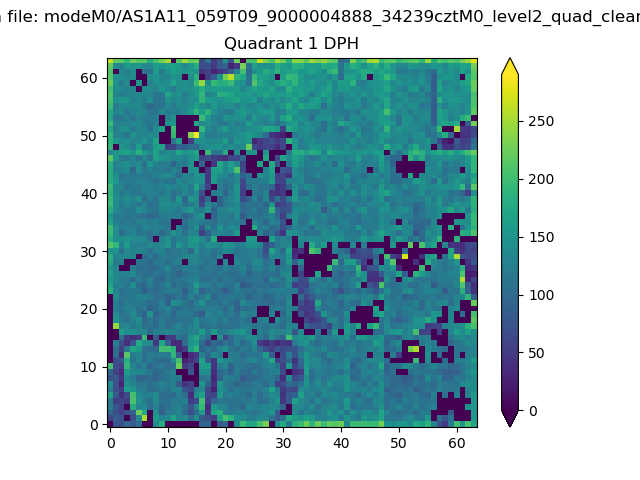 |
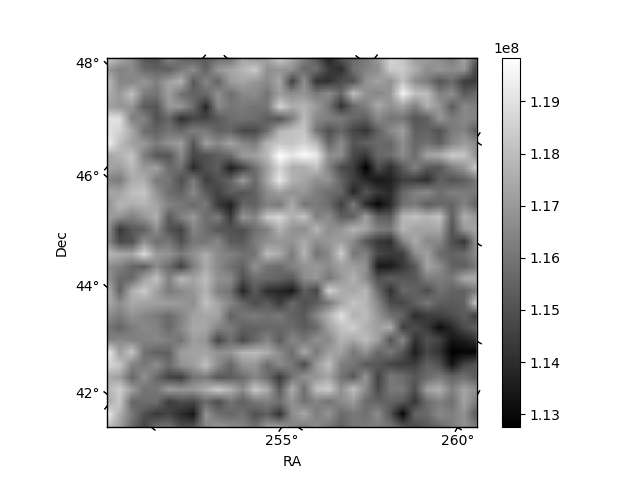
Quadrant B |
|---|---|---|---|
| Quadrant D | 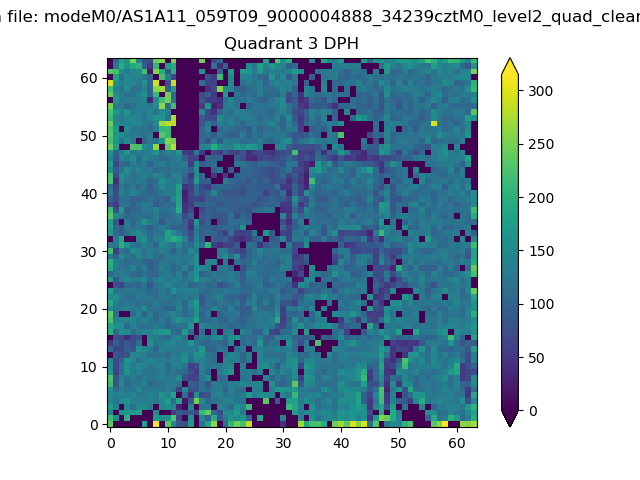 |
 |
Quadrant C |
| Plot type | Count rate plots | Images |
|---|---|---|
| Comparison with Poisson distribution Blue bars denote a histogram of data divided into 1 sec bins. Red curve is a Poisson curve with rate = median count rate of data. |
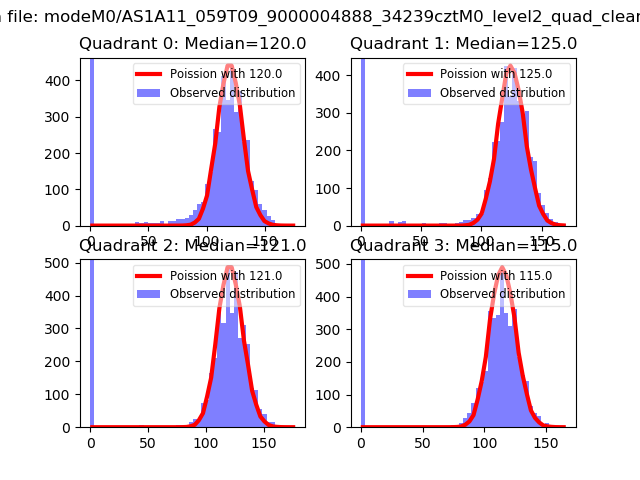 |
 |
| Quadrant-wise count rates Data is divided into 100 sec bins |
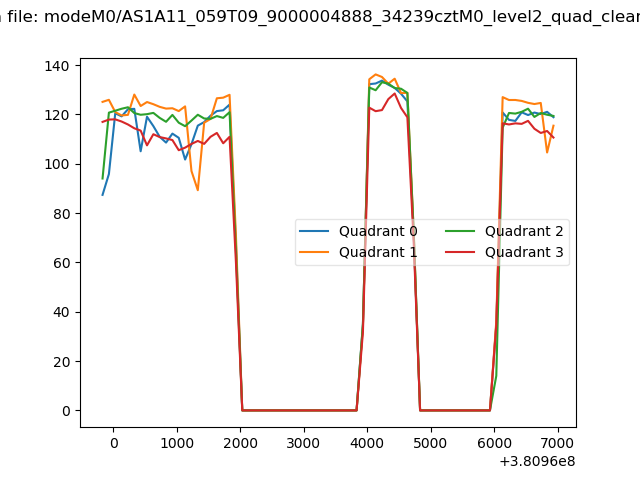 |
|
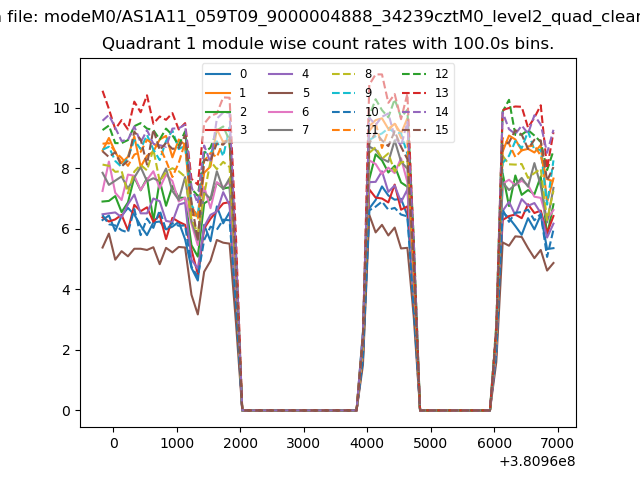
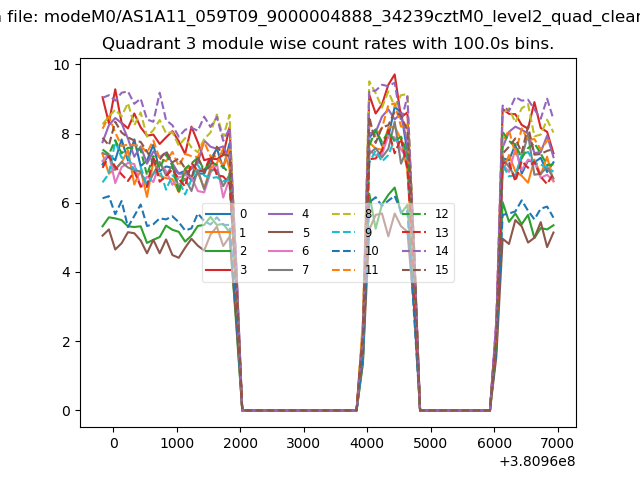
| Module-wise count rates for Quadrant A Data is divided into 100 sec bins |
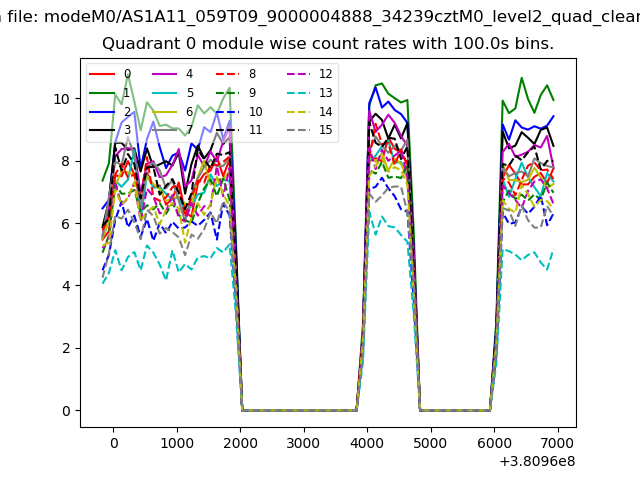 |
 |
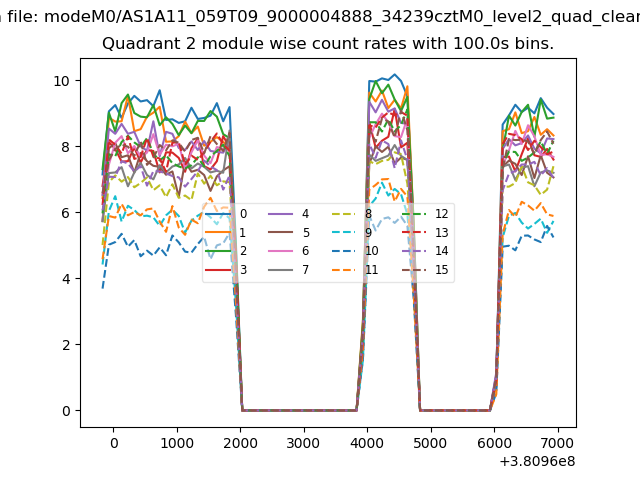
| Module-wise count rates for Quadrant B Data is divided into 100 sec bins |
 |
 |
| Module-wise count rates for Quadrant C Data is divided into 100 sec bins |
 |
 |
| Module-wise count rates for Quadrant D Data is divided into 100 sec bins |
 |
 |
| Parameter | Plot |
|---|---|
| CZT HV Monitor | 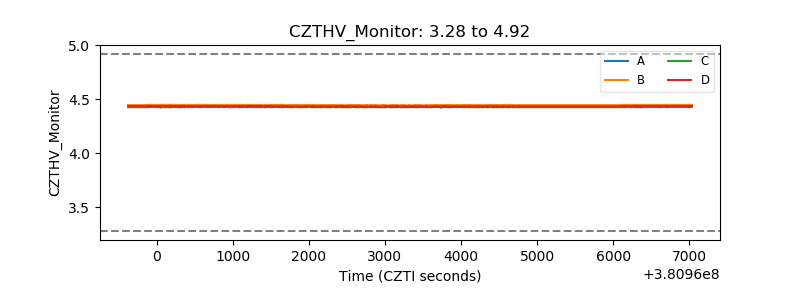 |
| D_VDD | 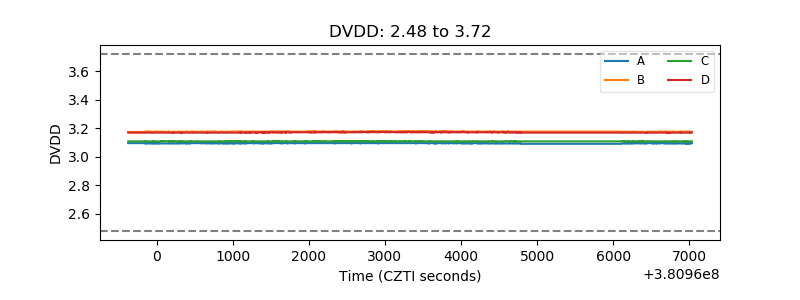 |
| Temperature 1 | 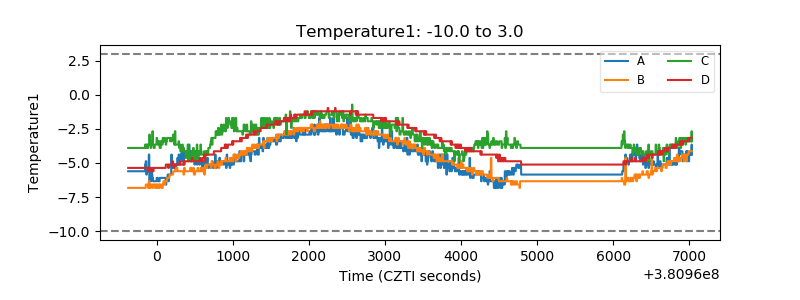 |
| Veto HV Monitor |  |
| Veto LLD | 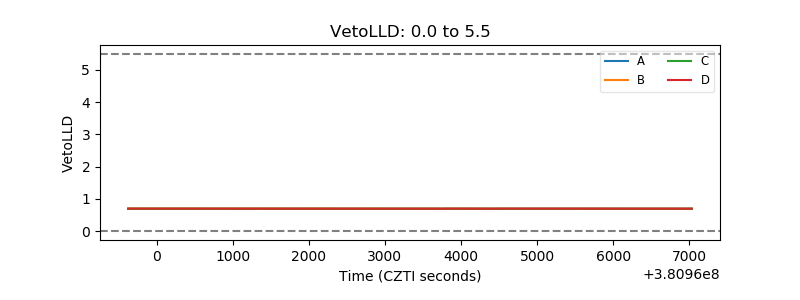 |
| Alpha Counter | 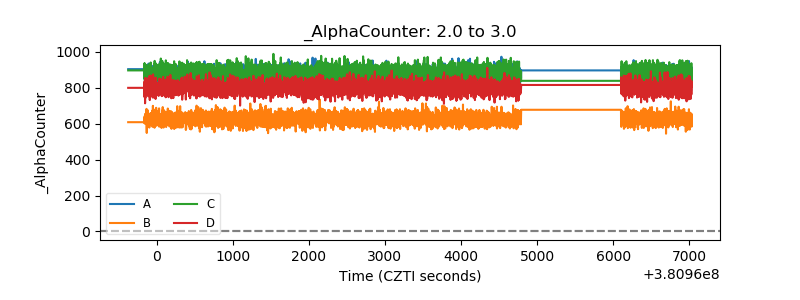 |
| _CPM_Rate | 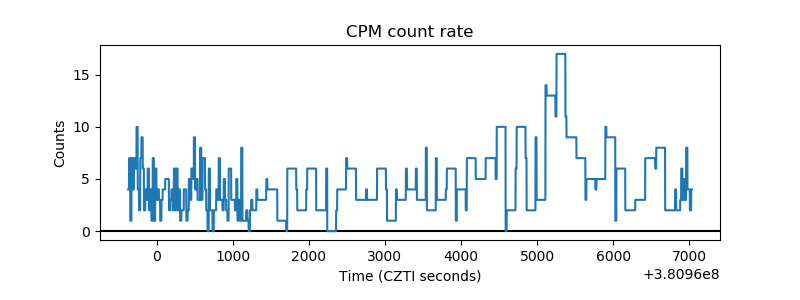 |
| CZT Counter | 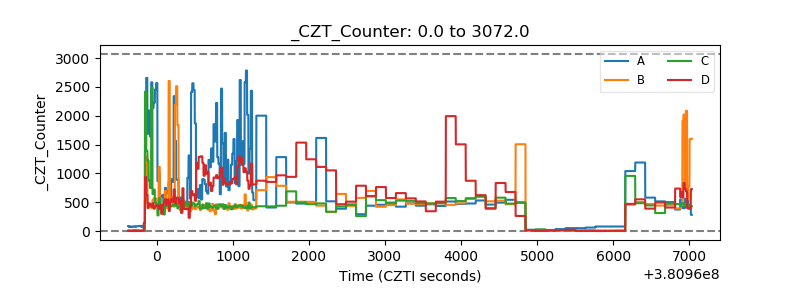 |
| +2.5 Volts monitor | 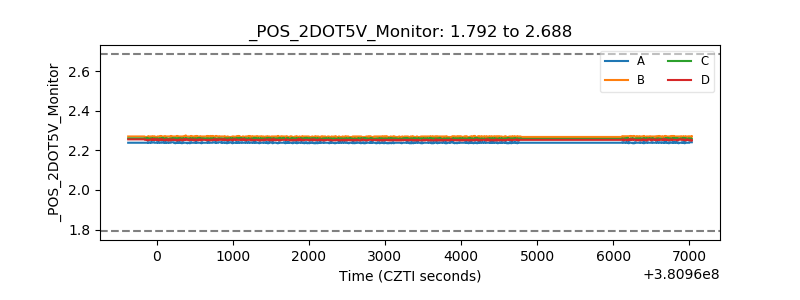 |
| +5 Volts monitor | 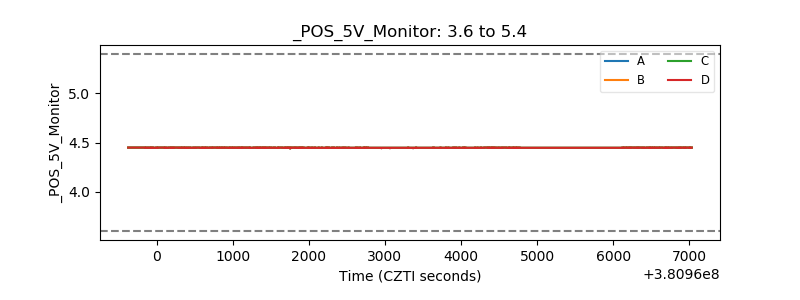 |
| _ROLL_ROT | 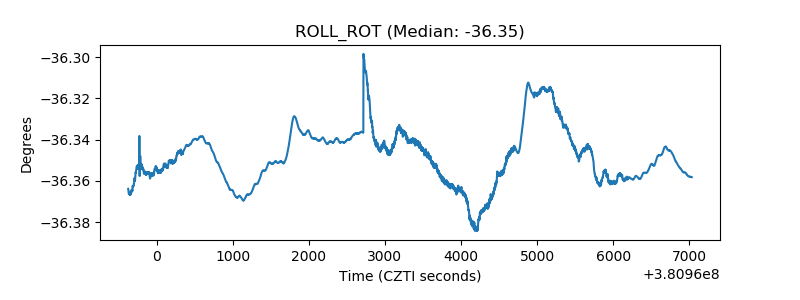 |
| _Roll_DEC | 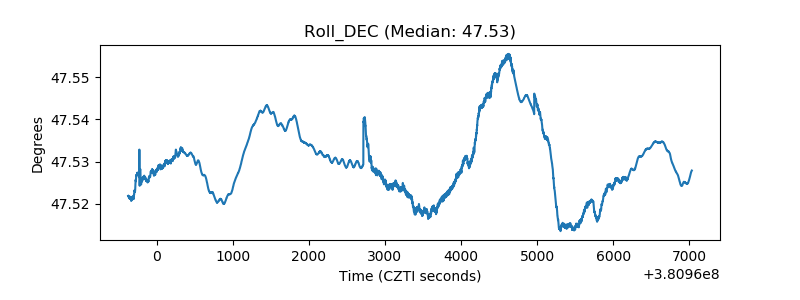 |
| _Roll_RA | 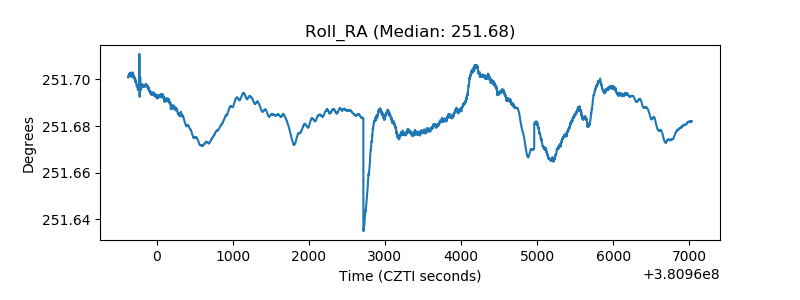 |
| Veto Counter | 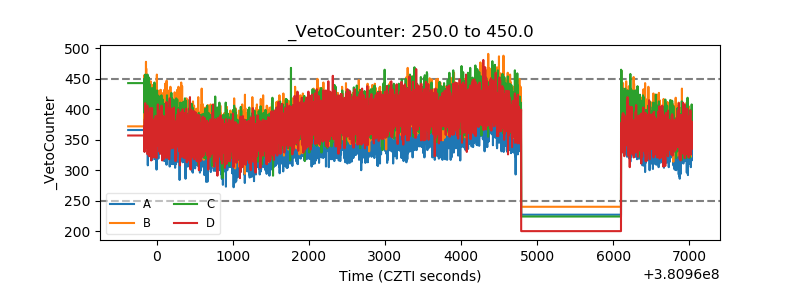 |