| Param | Original file | Final file |
|---|---|---|
| Filename | modeM0/AS1A11_059T09_9000004888_34238cztM0_level2.evt | modeM0/AS1A11_059T09_9000004888_34238cztM0_level2_quad_clean.evt |
| Size (bytes) | 1,035,587,520 | 127,779,840 |
| Size | 987.6 MB | 121.9 MB |
| Events in quadrant A | 11,505,215 | 738,323 |
| Events in quadrant B | 6,048,197 | 834,440 |
| Events in quadrant C | 5,974,250 | 816,066 |
| Events in quadrant D | 7,146,693 | 772,475 |
| Mode M0 | |||
|---|---|---|---|
| Quadrant | BADHDUFLAG | Total packets | Discarded packets |
| A | 0 | 41035 | 0 |
| B | 0 | 24768 | 0 |
| C | 0 | 24050 | 0 |
| D | 0 | 28453 | 0 |
| Mode SS | |||
|---|---|---|---|
| Quadrant | BADHDUFLAG | Total packets | Discarded packets |
| A | 0 | 208 | 0 |
| B | 0 | 208 | 0 |
| C | 0 | 208 | 0 |
| D | 0 | 208 | 0 |
| Mode M9 | |||
|---|---|---|---|
| Quadrant | BADHDUFLAG | Total packets | Discarded packets |
| A | 0 | 33 | 0 |
| B | 0 | 33 | 0 |
| C | 0 | 33 | 0 |
| D | 0 | 33 | 0 |
| Quadrant | Total seconds | Saturated seconds | Saturation percentage |
|---|---|---|---|
| A | 10214 | 1894 | 18.543176% |
| B | 10214 | 396 | 3.877032% |
| C | 10214 | 268 | 2.623850% |
| D | 10214 | 296 | 2.897983% |
Noise dominated data is calculated using 1-second bins in cleaned event files. If a bin has >2000 counts, and if more than 50% of those come from <1% of pixels, then it is considered to be noise-dominated and hence unusable.
| Quadrant | # 1 sec bins | Bins with >0 counts | Bins with >2000 counts | High rate bins dominated by noise | Noise dominated (total time) | Noise dominated (detector-on time) | Marked lightcurve |
|---|---|---|---|---|---|---|---|
| A | 13469 | 10216 | 1606 | 1606 | 11.92% | 15.72% | 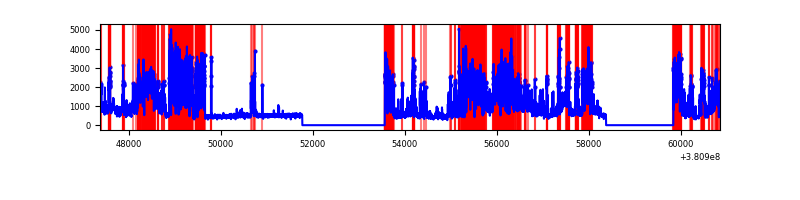 |
| B | 13469 | 10216 | 264 | 264 | 1.96% | 2.58% | 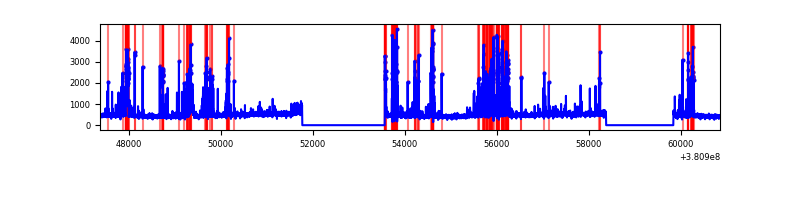 |
| C | 13469 | 10216 | 235 | 235 | 1.74% | 2.30% | 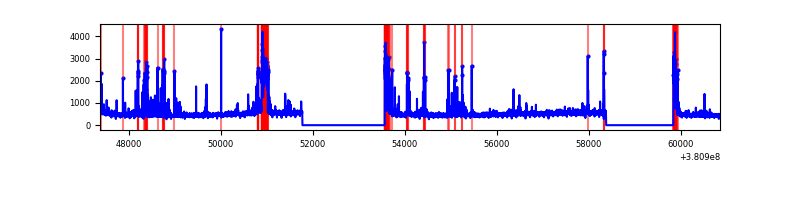 |
| D | 13469 | 10216 | 239 | 239 | 1.77% | 2.34% | 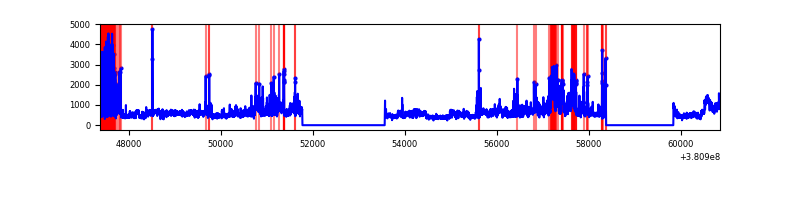 |
Top three noisy pixels from each quadrant. If the there are fewer than three noisy pixels in the level2.evt file, extra rows are filled as -1
| Pixel properties | Quadrant properties | ||||||
|---|---|---|---|---|---|---|---|
| Quadrant | DetID | PixID | Counts | Sigma | Mean | Median | Sigma |
| A | 15 | 169 | 7121591 | 32831.79 | 1090 | 1069 | 216.9 |
| A | 9 | 143 | 126858 | 580.0 | 1090 | 1069 | 216.9 |
| A | 10 | 83 | 25448 | 112.41 | 1090 | 1069 | 216.9 |
| B | 5 | 172 | 1325832 | 6101.29 | 1145 | 1116 | 217.1 |
| B | 0 | 190 | 66347 | 300.43 | 1145 | 1116 | 217.1 |
| B | 5 | 255 | 49564 | 223.14 | 1145 | 1116 | 217.1 |
| C | 14 | 254 | 508921 | 1980.42 | 1110 | 1120 | 256.4 |
| C | 0 | 10 | 491621 | 1912.95 | 1110 | 1120 | 256.4 |
| C | 15 | 214 | 436972 | 1699.82 | 1110 | 1120 | 256.4 |
| D | 8 | 195 | 1400788 | 5193.85 | 1114 | 1082 | 269.5 |
| D | 7 | 80 | 827778 | 3067.6 | 1114 | 1082 | 269.5 |
| D | 7 | 223 | 187291 | 690.96 | 1114 | 1082 | 269.5 |
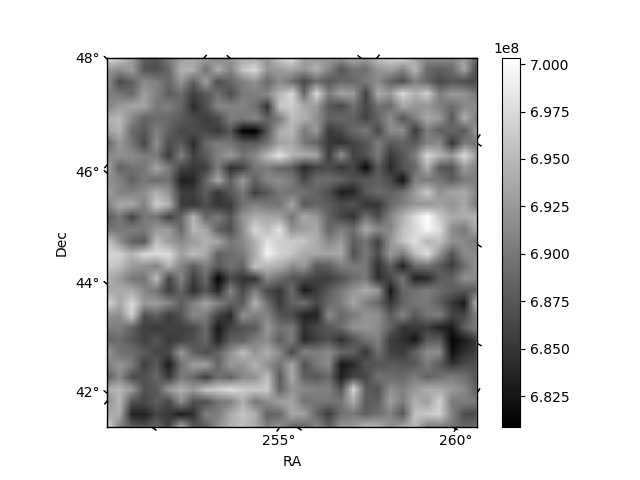
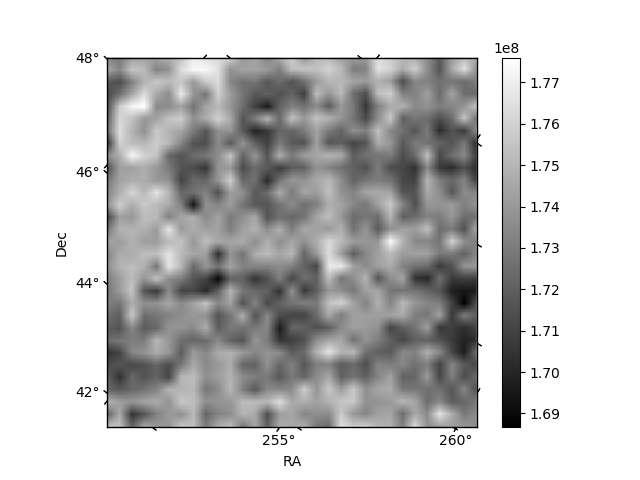
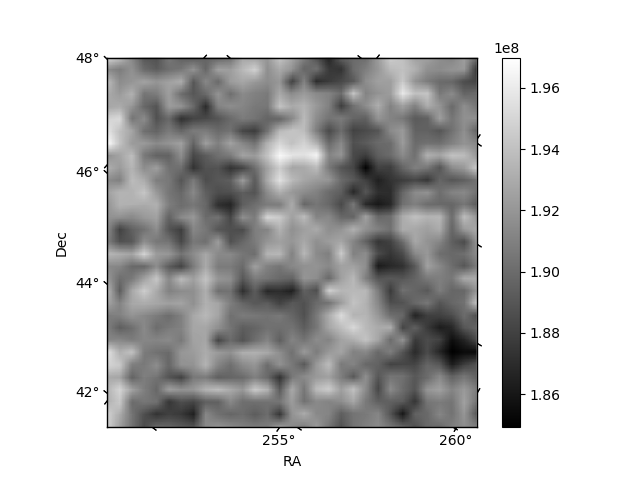
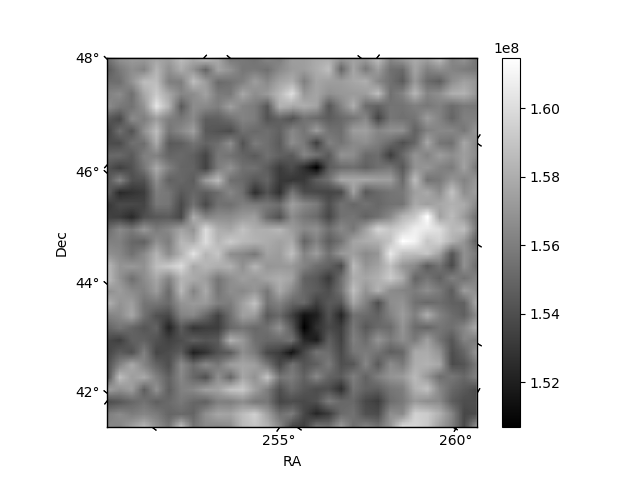
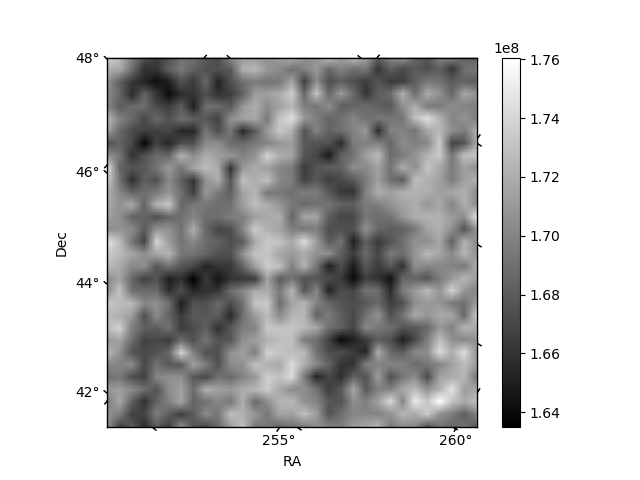
Histogram calculated using DETX and DETY for each event in the final _common_clean file
| Quadrant A | 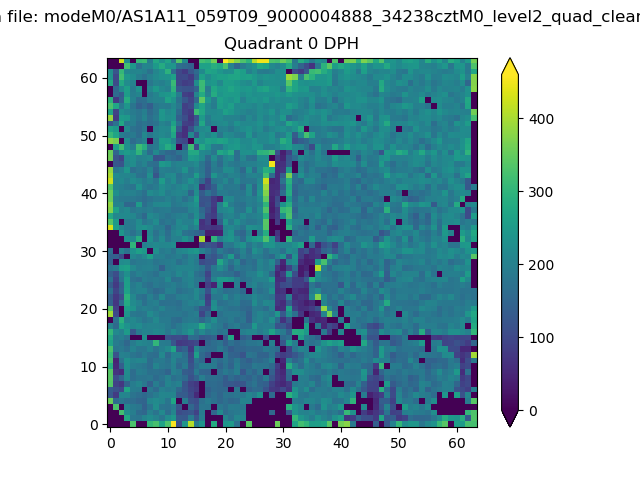 |
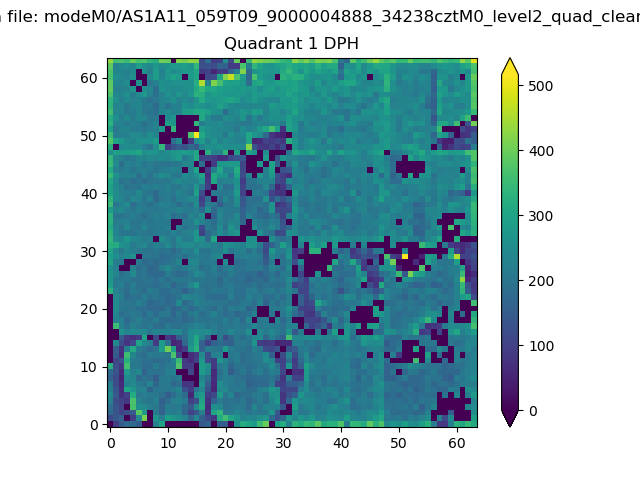 |
Quadrant B |
|---|---|---|---|
| Quadrant D | 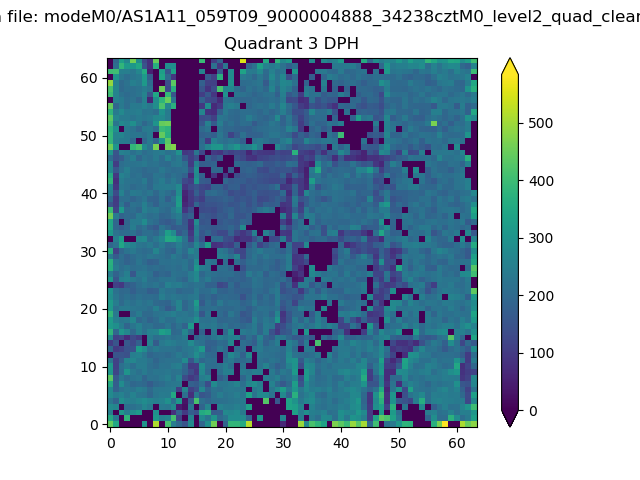 |
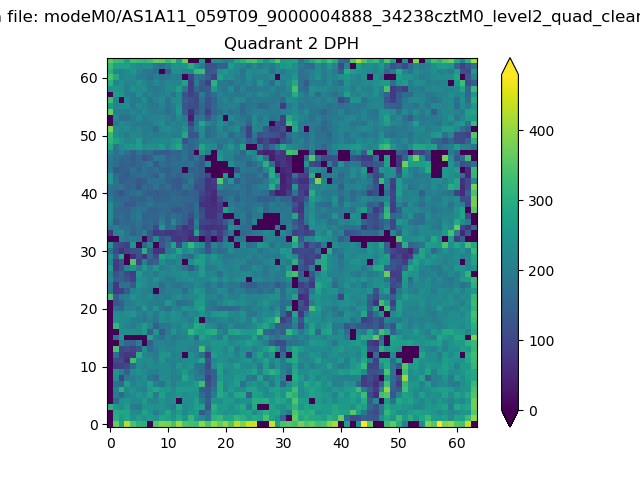 |
Quadrant C |
| Plot type | Count rate plots | Images |
|---|---|---|
| Comparison with Poisson distribution Blue bars denote a histogram of data divided into 1 sec bins. Red curve is a Poisson curve with rate = median count rate of data. |
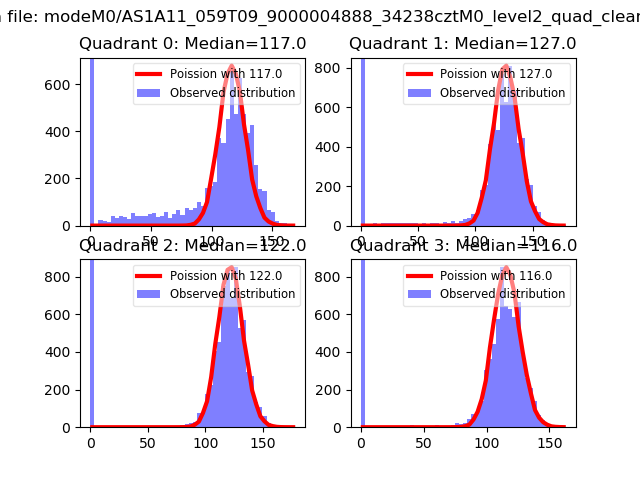 |
 |
| Quadrant-wise count rates Data is divided into 100 sec bins |
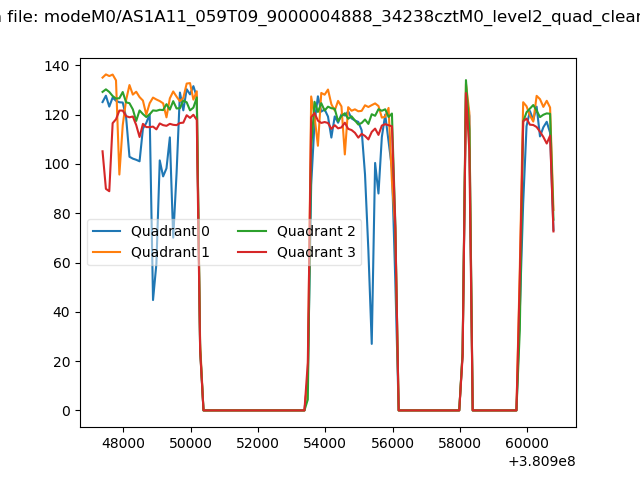 |
|
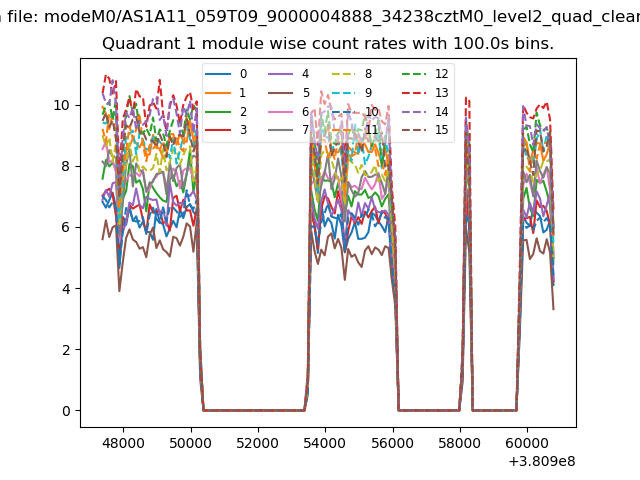
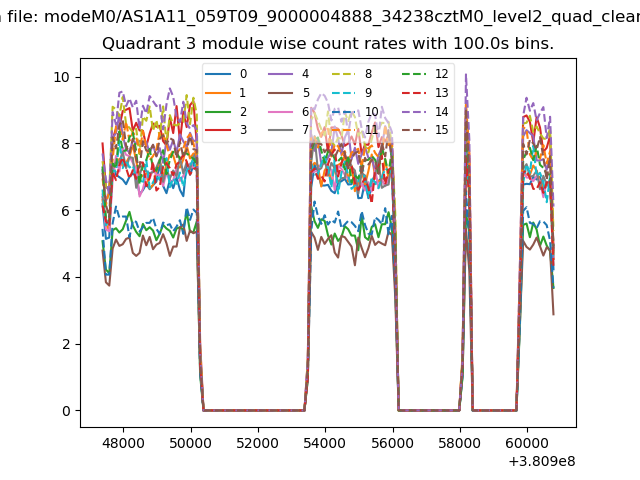
| Module-wise count rates for Quadrant A Data is divided into 100 sec bins |
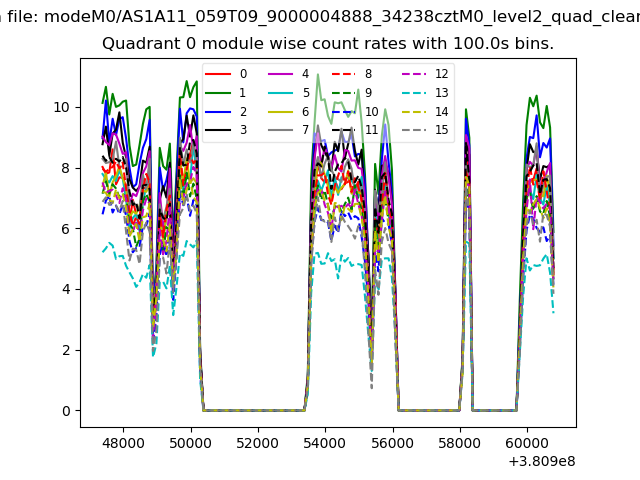 |
 |
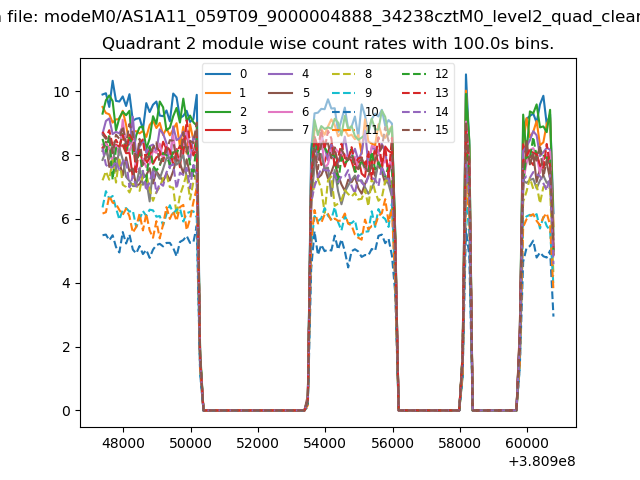
| Module-wise count rates for Quadrant B Data is divided into 100 sec bins |
 |
 |
| Module-wise count rates for Quadrant C Data is divided into 100 sec bins |
 |
 |
| Module-wise count rates for Quadrant D Data is divided into 100 sec bins |
 |
 |
| Parameter | Plot |
|---|---|
| CZT HV Monitor | 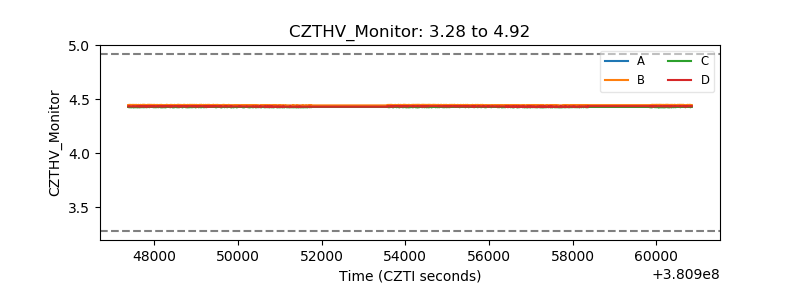 |
| D_VDD | 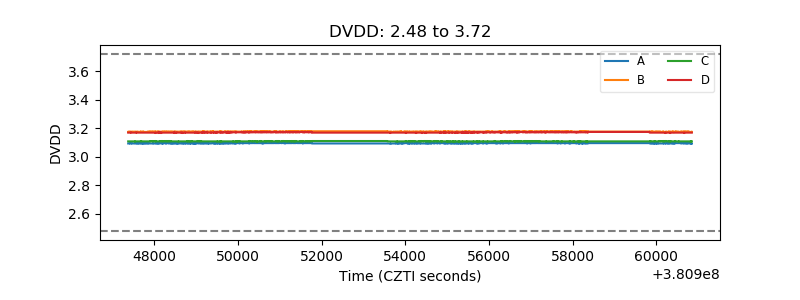 |
| Temperature 1 | 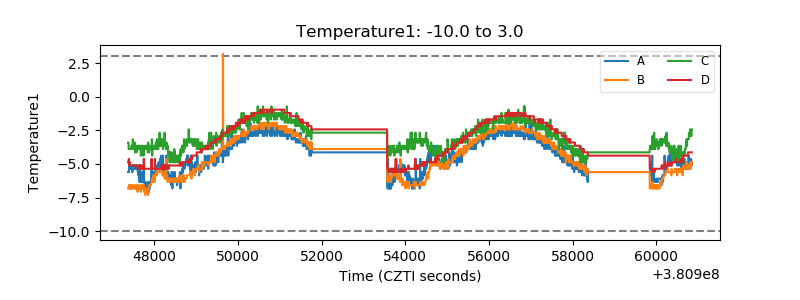 |
| Veto HV Monitor | 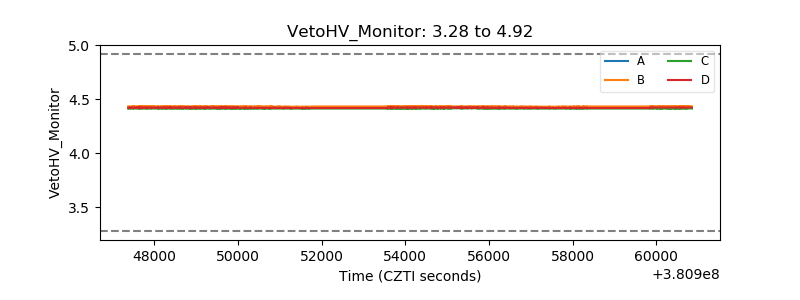 |
| Veto LLD | 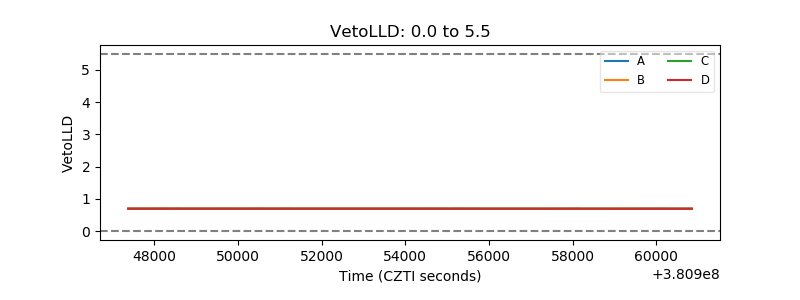 |
| Alpha Counter | 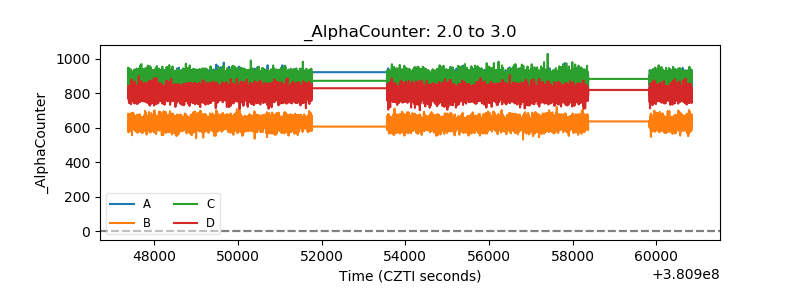 |
| _CPM_Rate | 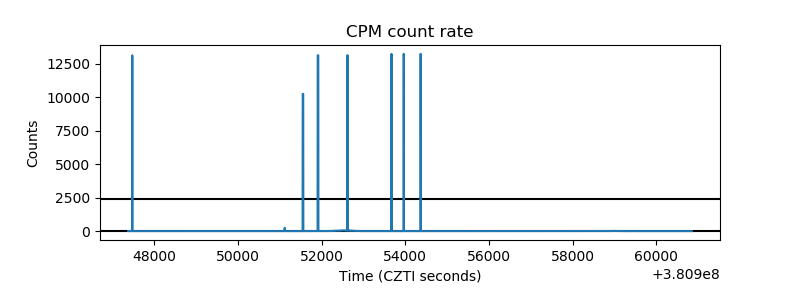 |
| CZT Counter | 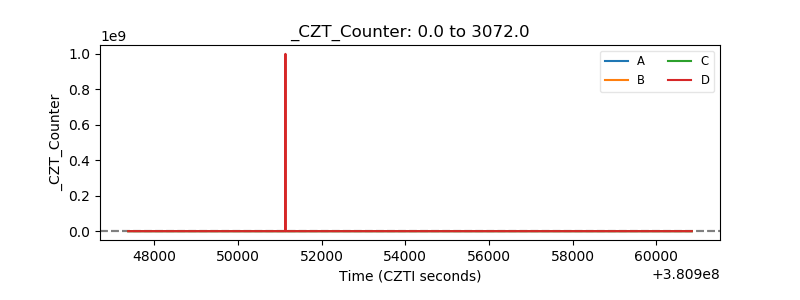 |
| +2.5 Volts monitor | 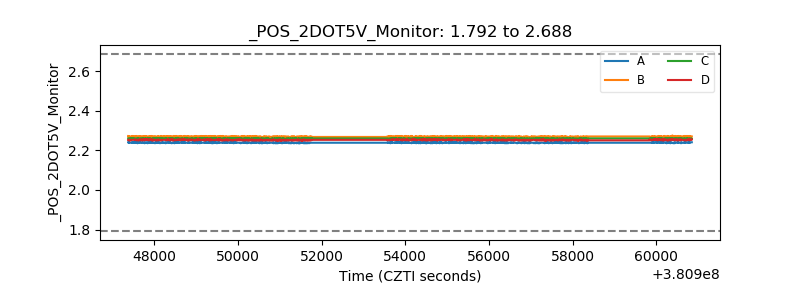 |
| +5 Volts monitor | 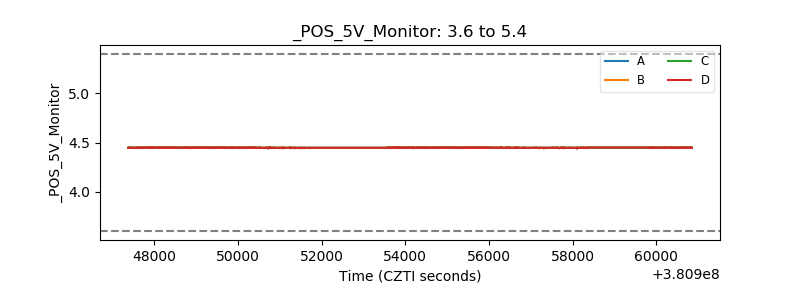 |
| _ROLL_ROT | 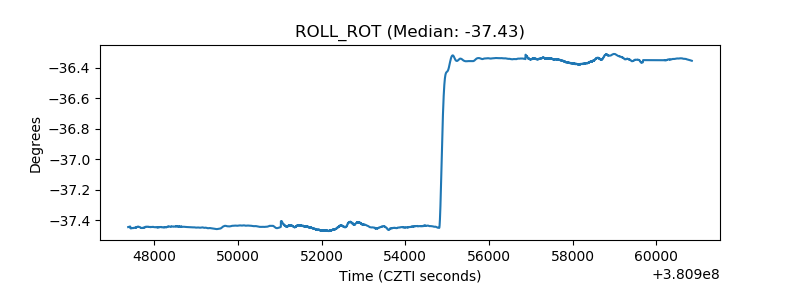 |
| _Roll_DEC | 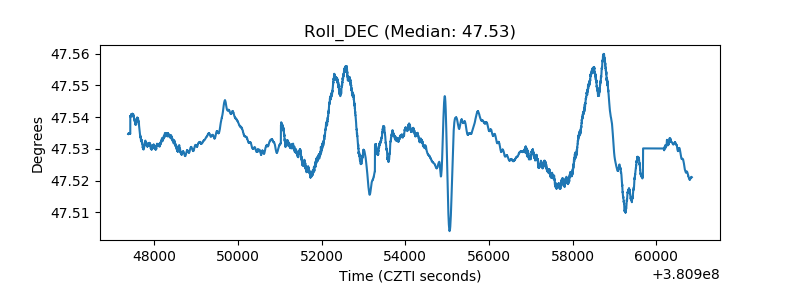 |
| _Roll_RA | 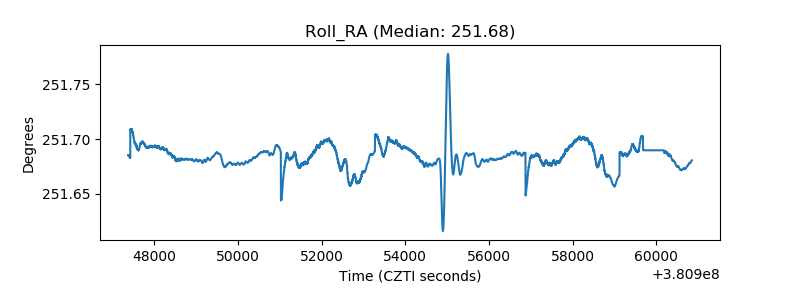 |
| Veto Counter | 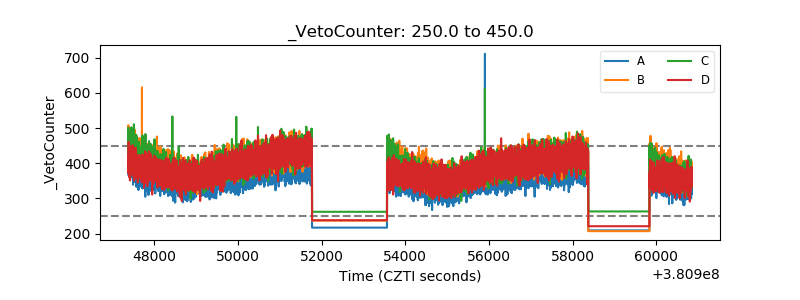 |