| Param | Original file | Final file |
|---|---|---|
| Filename | modeM0/AS1T04_086T01_9000004884_34217cztM0_level2.evt | modeM0/AS1T04_086T01_9000004884_34217cztM0_level2_quad_clean.evt |
| Size (bytes) | 599,875,200 | 67,449,600 |
| Size | 572.1 MB | 64.3 MB |
| Events in quadrant A | 2,474,835 | 445,917 |
| Events in quadrant B | 4,746,640 | 423,910 |
| Events in quadrant C | 4,091,668 | 414,518 |
| Events in quadrant D | 6,498,211 | 388,291 |
| Mode SS | |||
|---|---|---|---|
| Quadrant | BADHDUFLAG | Total packets | Discarded packets |
| A | 0 | 106 | 0 |
| B | 0 | 106 | 0 |
| C | 0 | 106 | 0 |
| D | 0 | 106 | 0 |
| Mode M9 | |||
|---|---|---|---|
| Quadrant | BADHDUFLAG | Total packets | Discarded packets |
| A | 0 | 24 | 0 |
| B | 0 | 24 | 0 |
| C | 0 | 24 | 0 |
| D | 0 | 25 | 0 |
| Mode M0 | |||
|---|---|---|---|
| Quadrant | BADHDUFLAG | Total packets | Discarded packets |
| A | 0 | 10765 | 3 |
| B | 0 | 17631 | 2 |
| C | 0 | 15419 | 2 |
| D | 0 | 23105 | 2 |
| Quadrant | Total seconds | Saturated seconds | Saturation percentage |
|---|---|---|---|
| A | 5273 | 3 | 0.056894% |
| B | 5273 | 696 | 13.199317% |
| C | 5273 | 455 | 8.628864% |
| D | 5273 | 660 | 12.516594% |
Noise dominated data is calculated using 1-second bins in cleaned event files. If a bin has >2000 counts, and if more than 50% of those come from <1% of pixels, then it is considered to be noise-dominated and hence unusable.
| Quadrant | # 1 sec bins | Bins with >0 counts | Bins with >2000 counts | High rate bins dominated by noise | Noise dominated (total time) | Noise dominated (detector-on time) | Marked lightcurve |
|---|---|---|---|---|---|---|---|
| A | 7125 | 5274 | 1 | 1 | 0.01% | 0.02% | 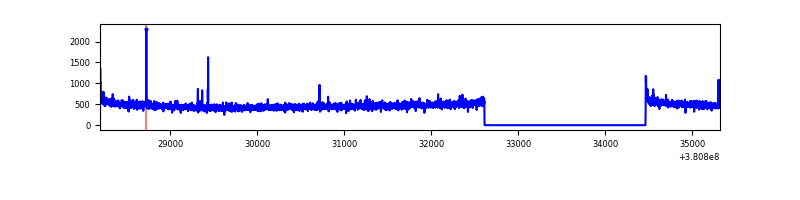 |
| B | 7125 | 5274 | 475 | 475 | 6.67% | 9.01% | 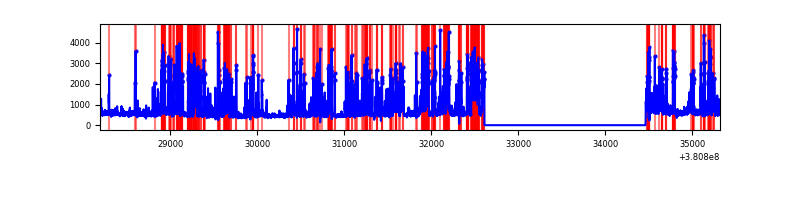 |
| C | 7125 | 5274 | 389 | 389 | 5.46% | 7.38% | 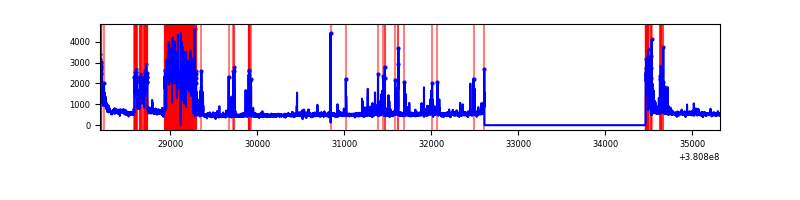 |
| D | 7125 | 5273 | 593 | 593 | 8.32% | 11.25% | 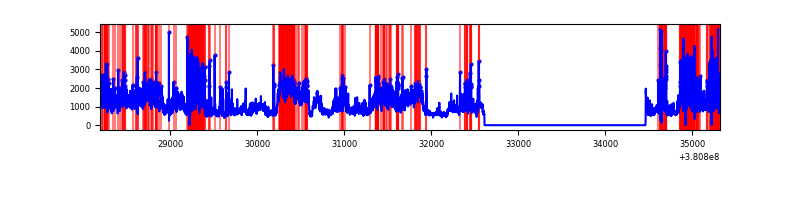 |
Top three noisy pixels from each quadrant. If the there are fewer than three noisy pixels in the level2.evt file, extra rows are filled as -1
| Pixel properties | Quadrant properties | ||||||
|---|---|---|---|---|---|---|---|
| Quadrant | DetID | PixID | Counts | Sigma | Mean | Median | Sigma |
| A | 10 | 83 | 23918 | 185.97 | 626 | 614 | 125.3 |
| A | 9 | 143 | 16726 | 128.58 | 626 | 614 | 125.3 |
| A | 13 | 6 | 12071 | 91.43 | 626 | 614 | 125.3 |
| B | 5 | 172 | 2053549 | 18168.47 | 597 | 582 | 113.0 |
| B | 5 | 255 | 159969 | 1410.55 | 597 | 582 | 113.0 |
| B | 0 | 219 | 52395 | 458.54 | 597 | 582 | 113.0 |
| C | 4 | 254 | 1278653 | 9342.6 | 594 | 599 | 136.8 |
| C | 15 | 214 | 218917 | 1595.91 | 594 | 599 | 136.8 |
| C | 0 | 10 | 170643 | 1243.02 | 594 | 599 | 136.8 |
| D | 8 | 195 | 1159237 | 8029.75 | 589 | 574 | 144.3 |
| D | 10 | 118 | 1122568 | 7775.63 | 589 | 574 | 144.3 |
| D | 2 | 250 | 780608 | 5405.78 | 589 | 574 | 144.3 |
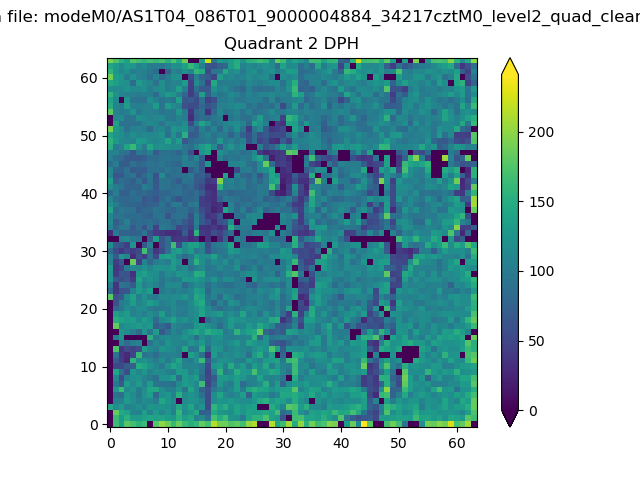
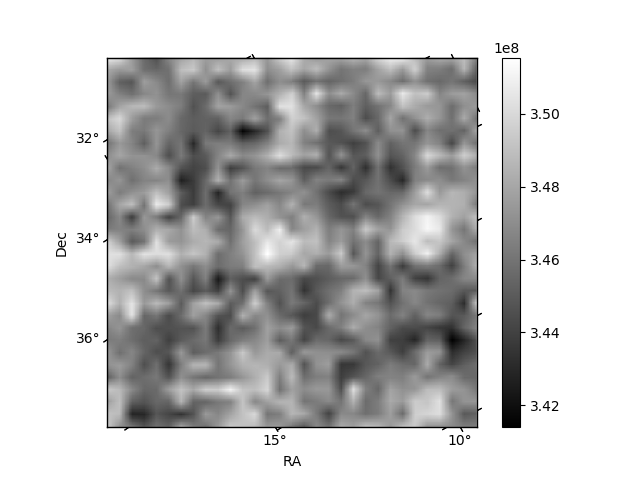
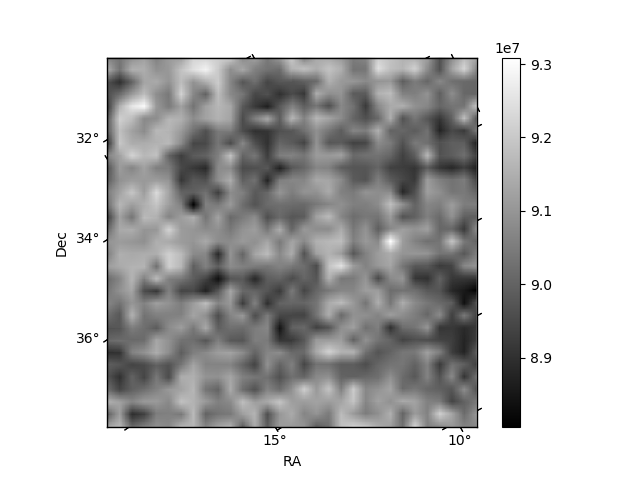
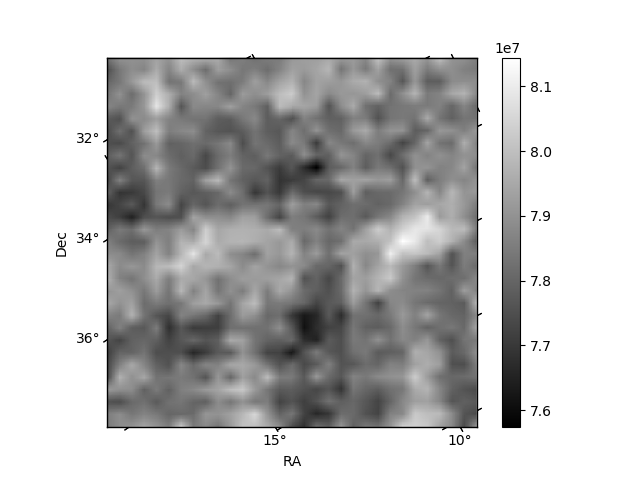
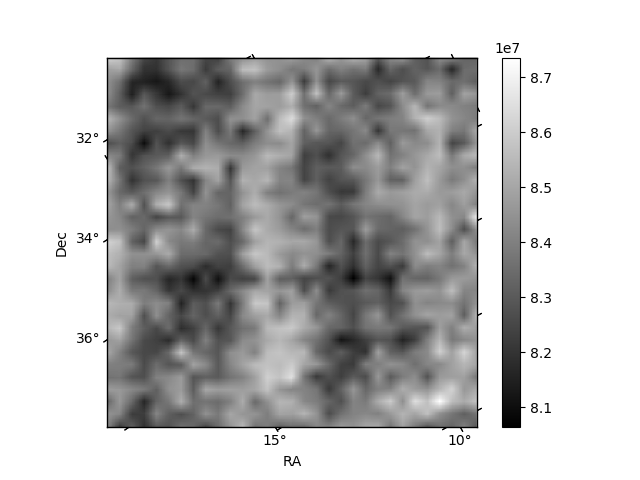
Histogram calculated using DETX and DETY for each event in the final _common_clean file
| Quadrant A | 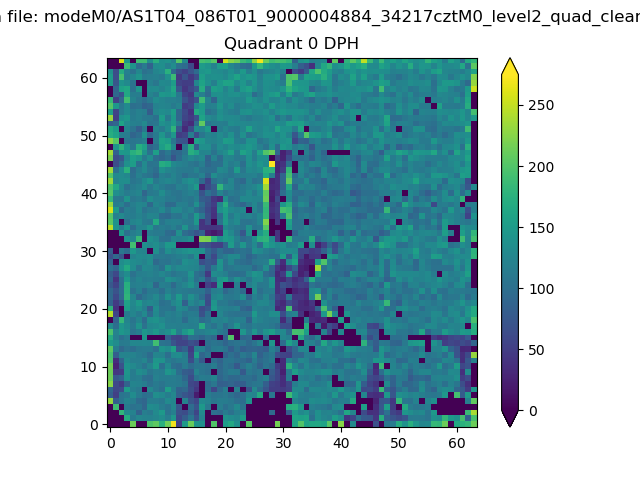 |
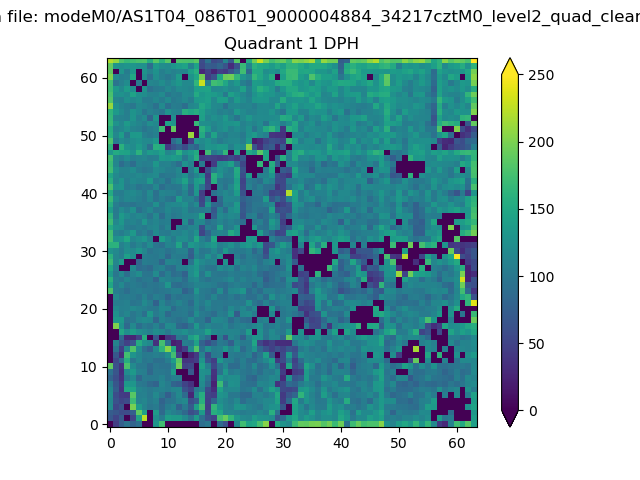 |
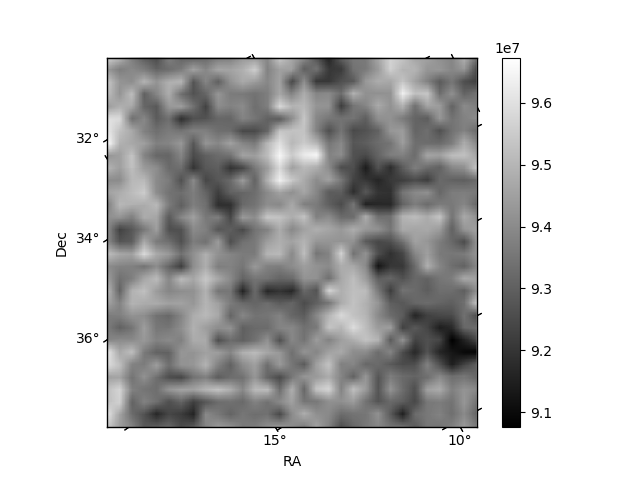
Quadrant B |
|---|---|---|---|
| Quadrant D | 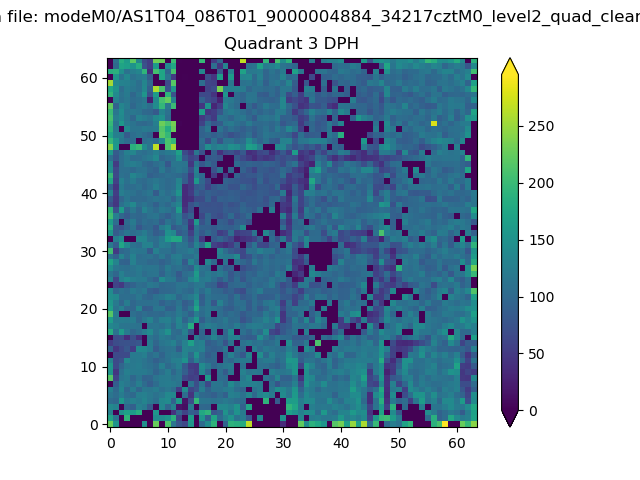 |
 |
Quadrant C |
| Plot type | Count rate plots | Images |
|---|---|---|
| Comparison with Poisson distribution Blue bars denote a histogram of data divided into 1 sec bins. Red curve is a Poisson curve with rate = median count rate of data. |
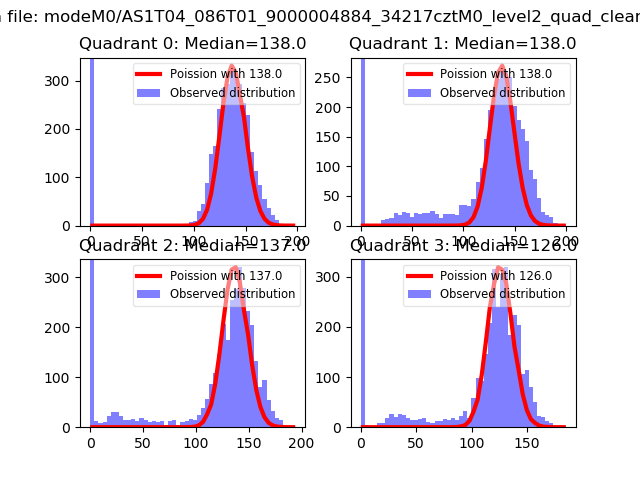 |
 |
| Quadrant-wise count rates Data is divided into 100 sec bins |
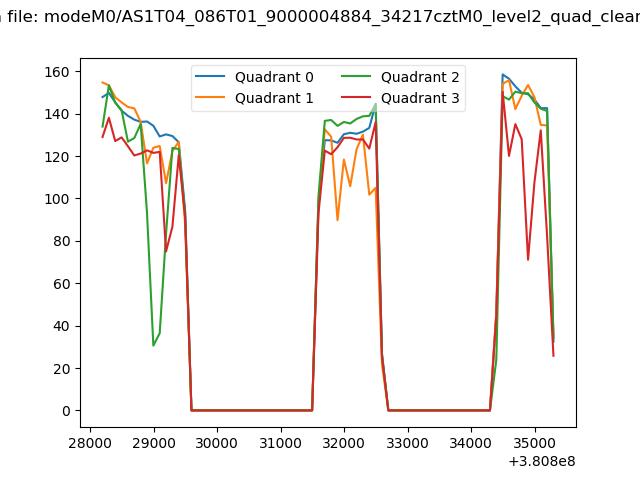 |
|
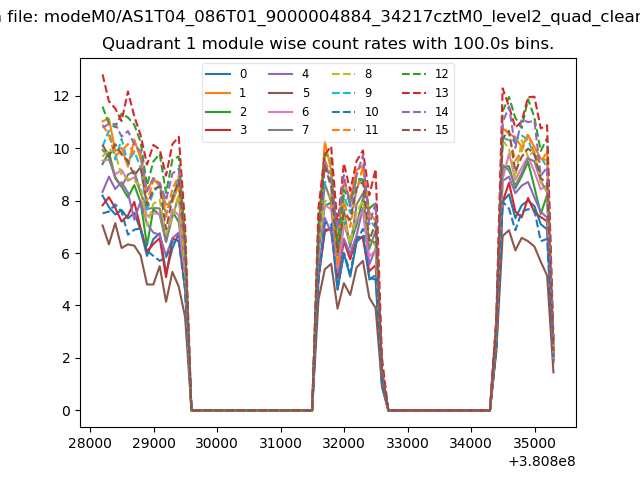
| Module-wise count rates for Quadrant A Data is divided into 100 sec bins |
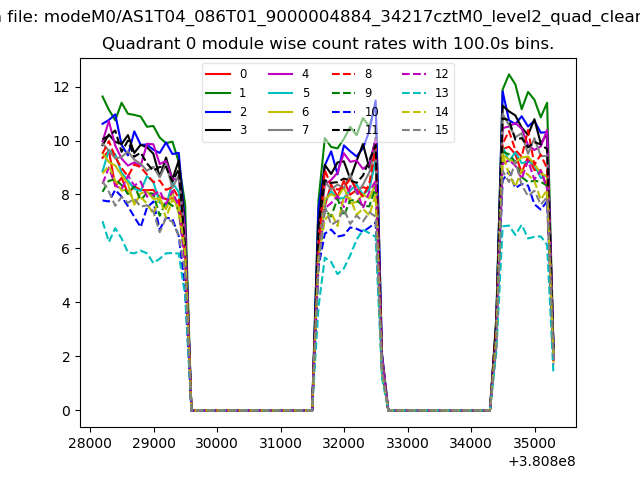 |
 |
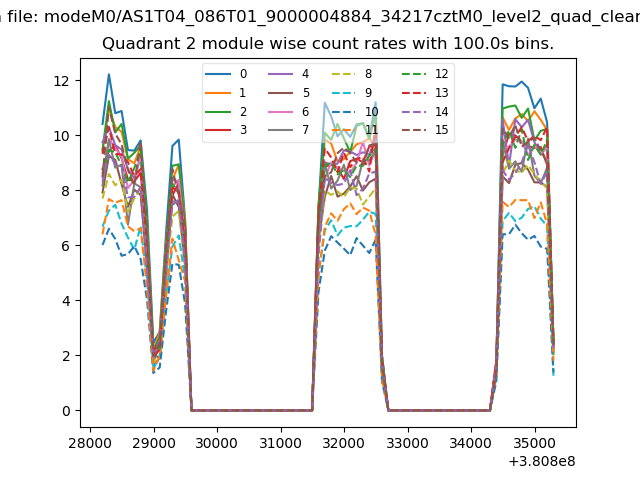
| Module-wise count rates for Quadrant B Data is divided into 100 sec bins |
 |
 |
| Module-wise count rates for Quadrant C Data is divided into 100 sec bins |
 |
 |
| Module-wise count rates for Quadrant D Data is divided into 100 sec bins |
 |
 |
| Parameter | Plot |
|---|---|
| CZT HV Monitor | 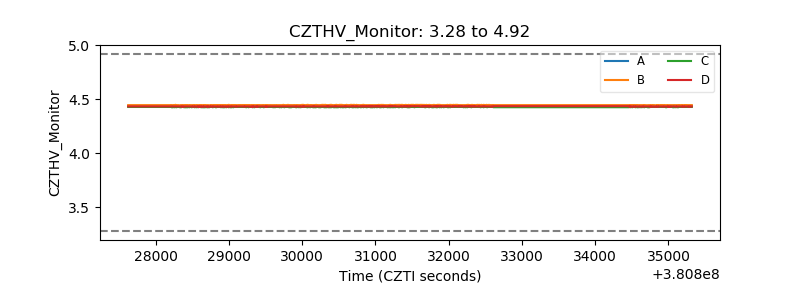 |
| D_VDD | 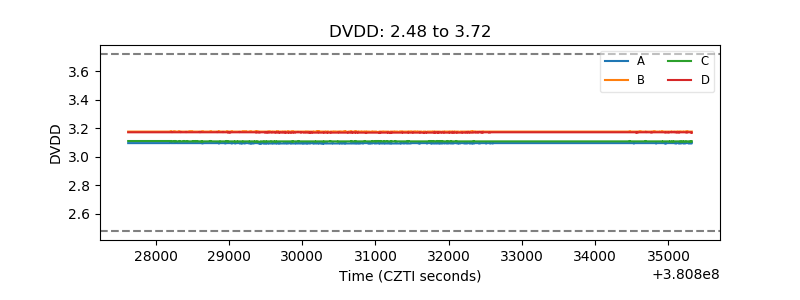 |
| Temperature 1 | 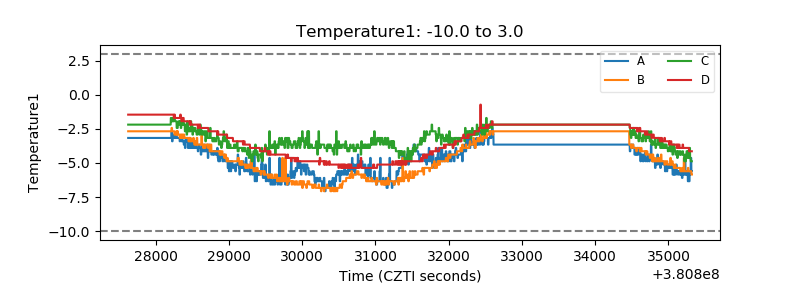 |
| Veto HV Monitor | 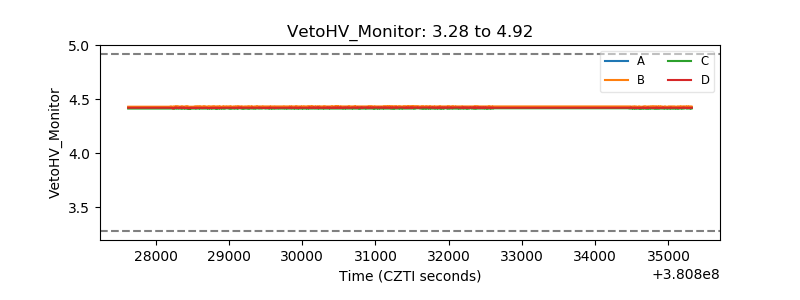 |
| Veto LLD | 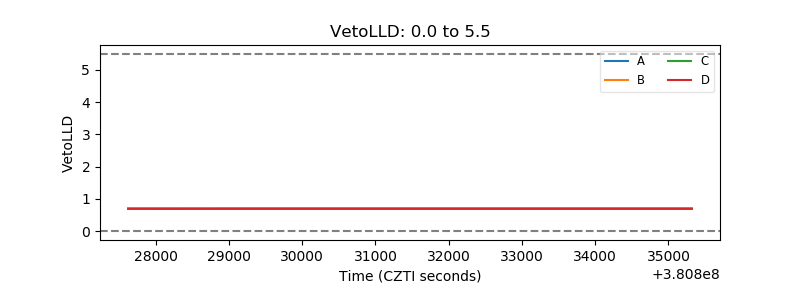 |
| Alpha Counter | 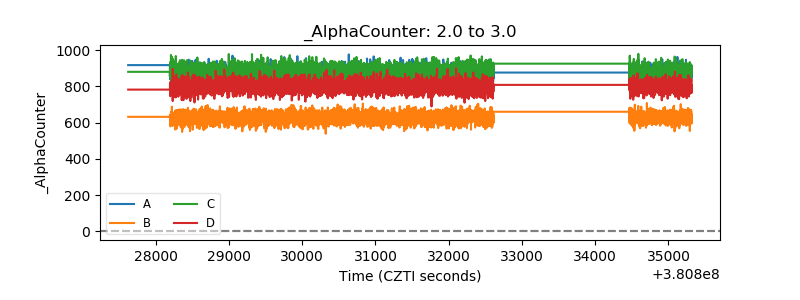 |
| _CPM_Rate | 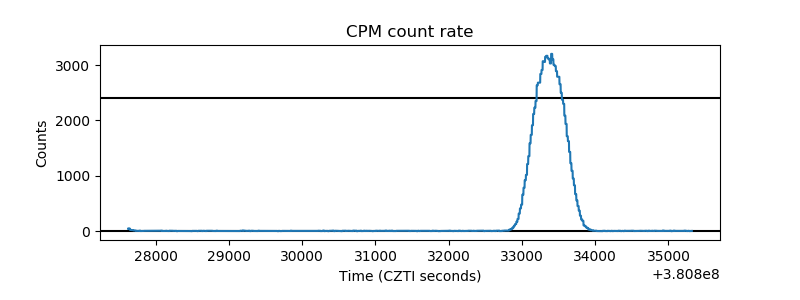 |
| CZT Counter | 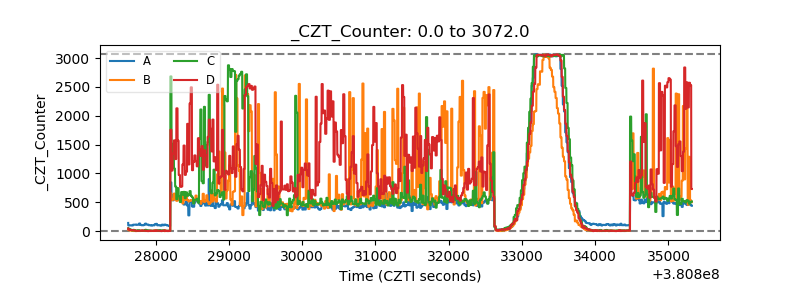 |
| +2.5 Volts monitor | 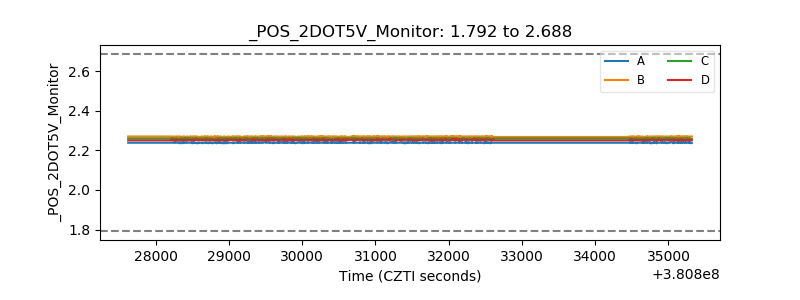 |
| +5 Volts monitor | 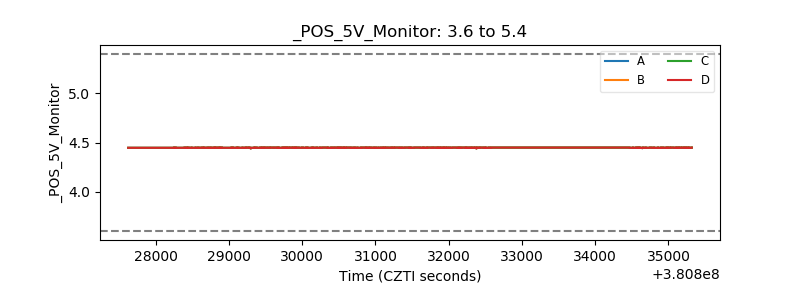 |
| _ROLL_ROT | 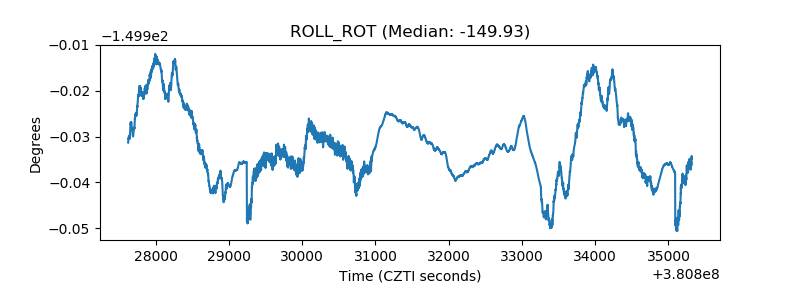 |
| _Roll_DEC | 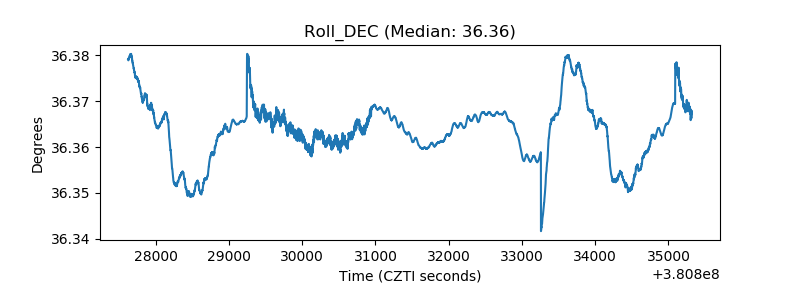 |
| _Roll_RA | 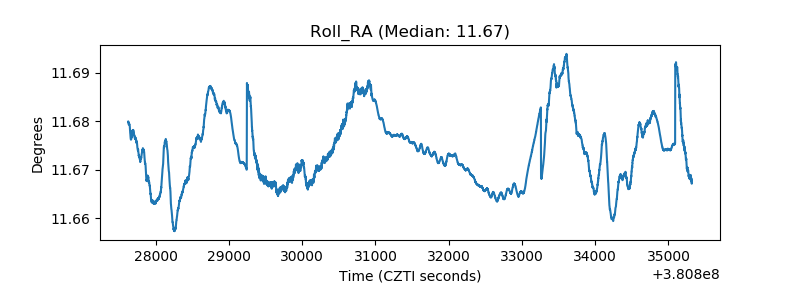 |
| Veto Counter | 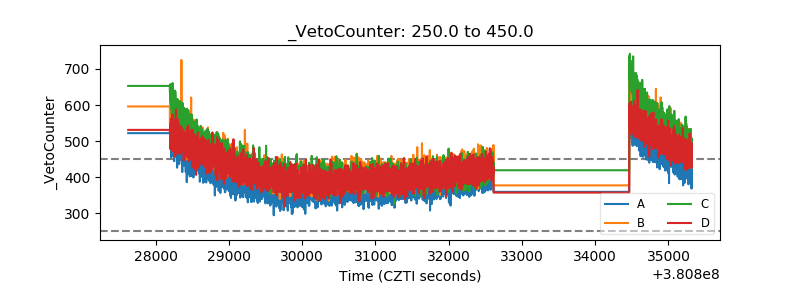 |