| Param | Original file | Final file |
|---|---|---|
| Filename | modeM0/AS1T04_086T01_9000004884_34215cztM0_level2.evt | modeM0/AS1T04_086T01_9000004884_34215cztM0_level2_quad_clean.evt |
| Size (bytes) | 577,782,720 | 71,519,040 |
| Size | 551.0 MB | 68.2 MB |
| Events in quadrant A | 2,599,587 | 464,281 |
| Events in quadrant B | 4,255,908 | 458,630 |
| Events in quadrant C | 3,948,638 | 435,210 |
| Events in quadrant D | 6,317,362 | 417,402 |
| Mode SS | |||
|---|---|---|---|
| Quadrant | BADHDUFLAG | Total packets | Discarded packets |
| A | 0 | 114 | 0 |
| B | 0 | 114 | 0 |
| C | 0 | 114 | 0 |
| D | 0 | 114 | 0 |
| Mode M9 | |||
|---|---|---|---|
| Quadrant | BADHDUFLAG | Total packets | Discarded packets |
| A | 0 | 20 | 0 |
| B | 0 | 20 | 0 |
| C | 0 | 20 | 0 |
| D | 0 | 21 | 0 |
| Mode M0 | |||
|---|---|---|---|
| Quadrant | BADHDUFLAG | Total packets | Discarded packets |
| A | 0 | 11434 | 3 |
| B | 0 | 16239 | 2 |
| C | 0 | 15153 | 2 |
| D | 0 | 22651 | 2 |
| Quadrant | Total seconds | Saturated seconds | Saturation percentage |
|---|---|---|---|
| A | 5567 | 15 | 0.269445% |
| B | 5567 | 445 | 7.993533% |
| C | 5567 | 369 | 6.628346% |
| D | 5567 | 538 | 9.664092% |
Noise dominated data is calculated using 1-second bins in cleaned event files. If a bin has >2000 counts, and if more than 50% of those come from <1% of pixels, then it is considered to be noise-dominated and hence unusable.
| Quadrant | # 1 sec bins | Bins with >0 counts | Bins with >2000 counts | High rate bins dominated by noise | Noise dominated (total time) | Noise dominated (detector-on time) | Marked lightcurve |
|---|---|---|---|---|---|---|---|
| A | 7299 | 5567 | 8 | 8 | 0.11% | 0.14% | 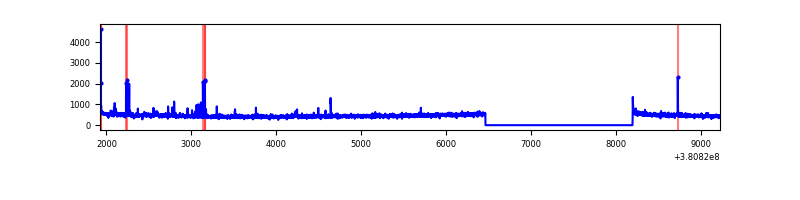 |
| B | 7299 | 5567 | 328 | 328 | 4.49% | 5.89% | 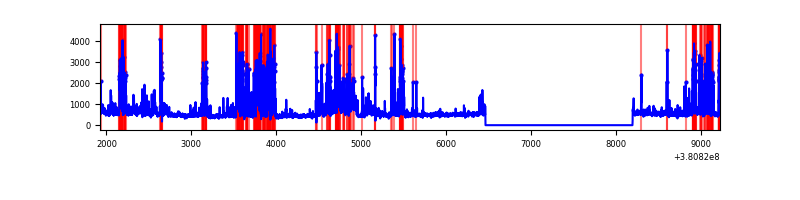 |
| C | 7299 | 5567 | 325 | 325 | 4.45% | 5.84% | 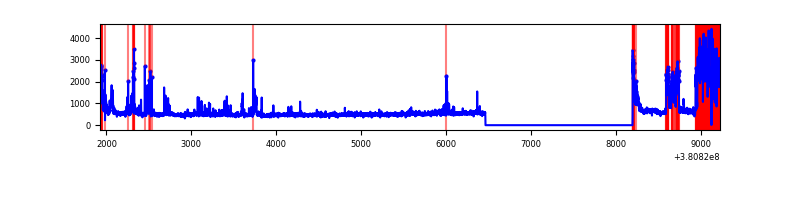 |
| D | 7298 | 5566 | 472 | 472 | 6.47% | 8.48% | 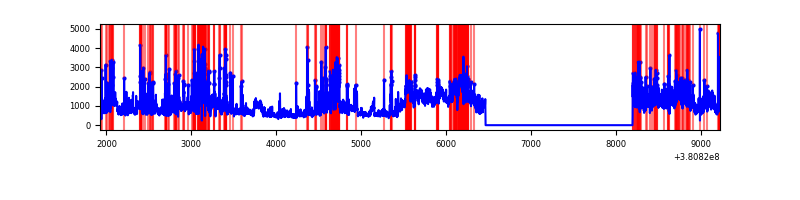 |
Top three noisy pixels from each quadrant. If the there are fewer than three noisy pixels in the level2.evt file, extra rows are filled as -1
| Pixel properties | Quadrant properties | ||||||
|---|---|---|---|---|---|---|---|
| Quadrant | DetID | PixID | Counts | Sigma | Mean | Median | Sigma |
| A | 9 | 143 | 65717 | 498.85 | 644 | 628 | 130.5 |
| A | 10 | 83 | 23504 | 175.32 | 644 | 628 | 130.5 |
| A | 13 | 6 | 11290 | 81.71 | 644 | 628 | 130.5 |
| B | 5 | 172 | 1333533 | 11275.89 | 626 | 611 | 118.2 |
| B | 5 | 31 | 186028 | 1568.54 | 626 | 611 | 118.2 |
| B | 5 | 255 | 92719 | 779.19 | 626 | 611 | 118.2 |
| C | 4 | 254 | 1083284 | 7611.78 | 616 | 621 | 142.2 |
| C | 15 | 214 | 232397 | 1629.53 | 616 | 621 | 142.2 |
| C | 0 | 10 | 144753 | 1013.34 | 616 | 621 | 142.2 |
| D | 8 | 195 | 1390337 | 9056.08 | 620 | 602 | 153.5 |
| D | 10 | 118 | 1102583 | 7180.96 | 620 | 602 | 153.5 |
| D | 1 | 52 | 361767 | 2353.5 | 620 | 602 | 153.5 |
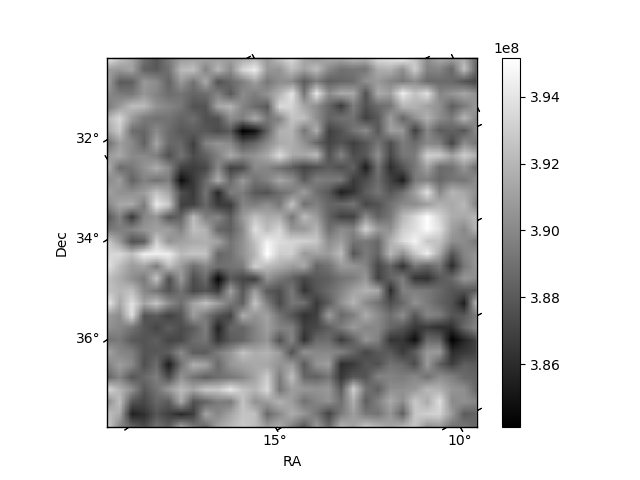
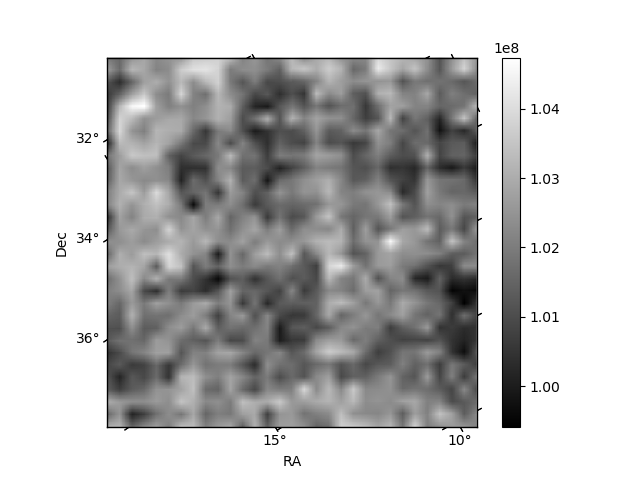
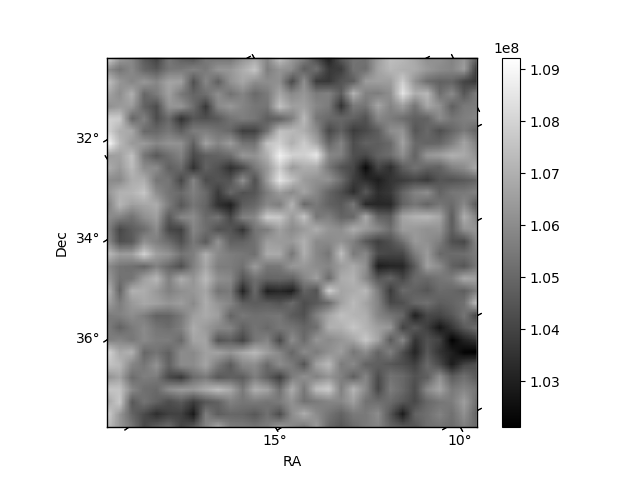
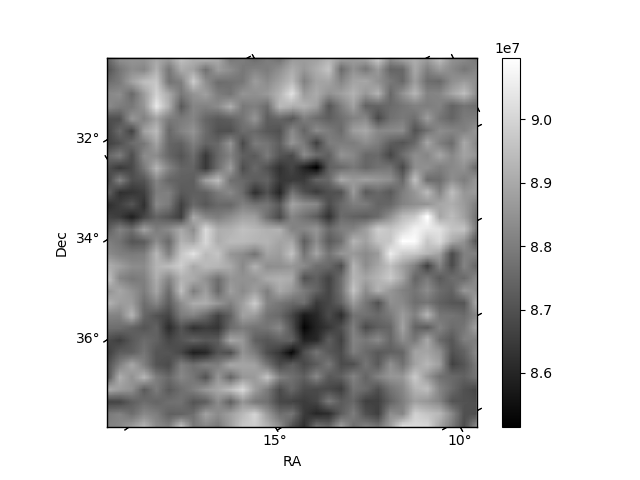
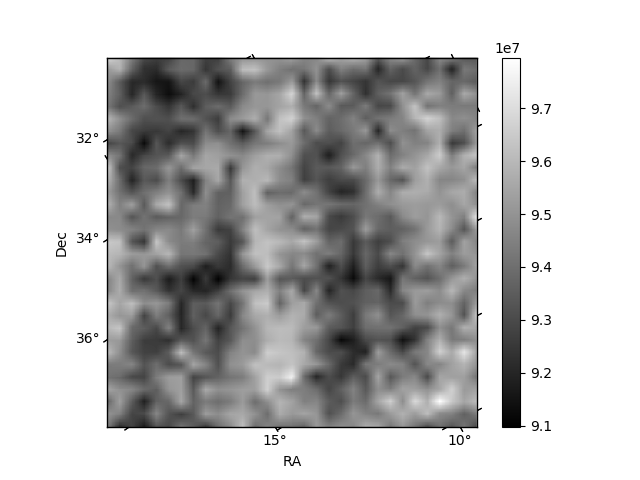
Histogram calculated using DETX and DETY for each event in the final _common_clean file
| Quadrant A | 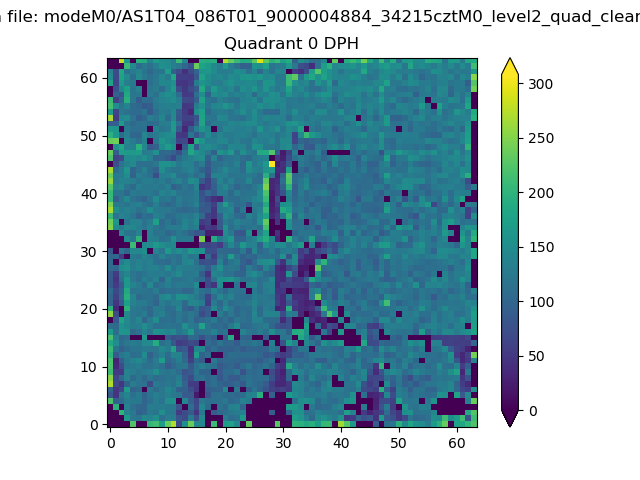 |
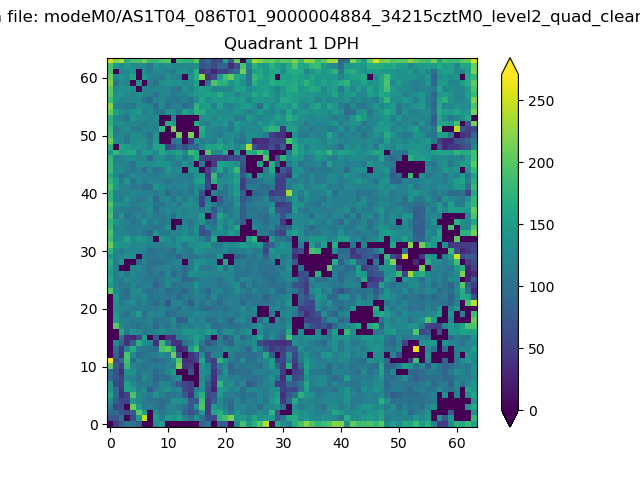 |
Quadrant B |
|---|---|---|---|
| Quadrant D | 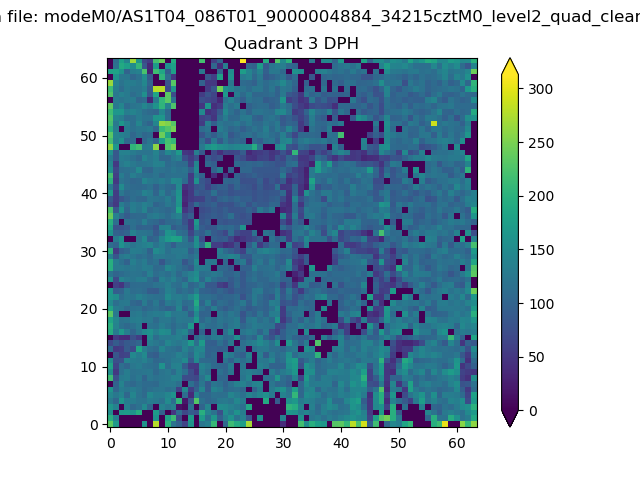 |
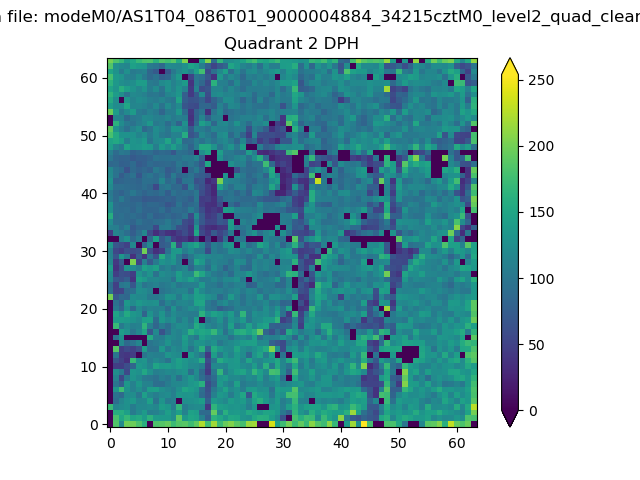 |
Quadrant C |
| Plot type | Count rate plots | Images |
|---|---|---|
| Comparison with Poisson distribution Blue bars denote a histogram of data divided into 1 sec bins. Red curve is a Poisson curve with rate = median count rate of data. |
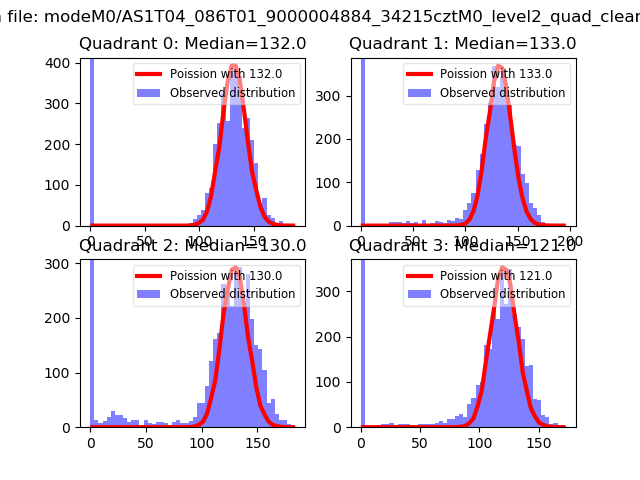 |
 |
| Quadrant-wise count rates Data is divided into 100 sec bins |
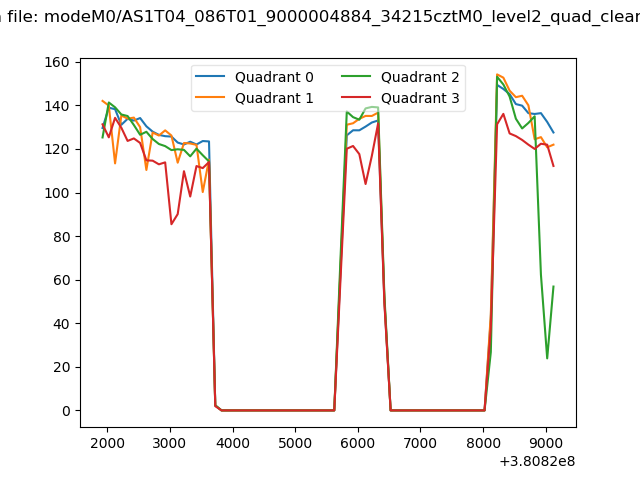 |
|
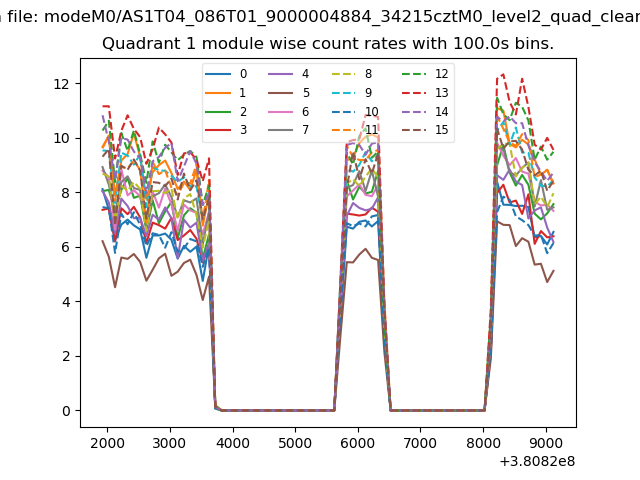
| Module-wise count rates for Quadrant A Data is divided into 100 sec bins |
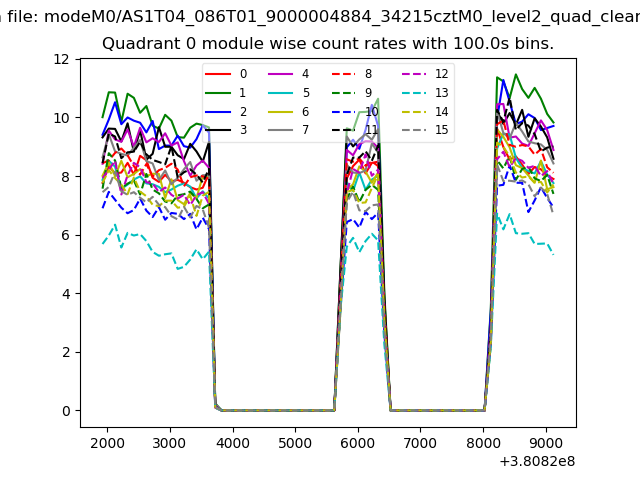 |
 |
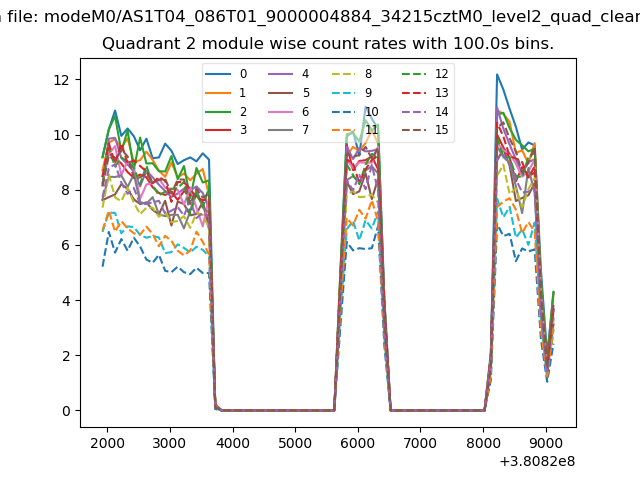
| Module-wise count rates for Quadrant B Data is divided into 100 sec bins |
 |
 |
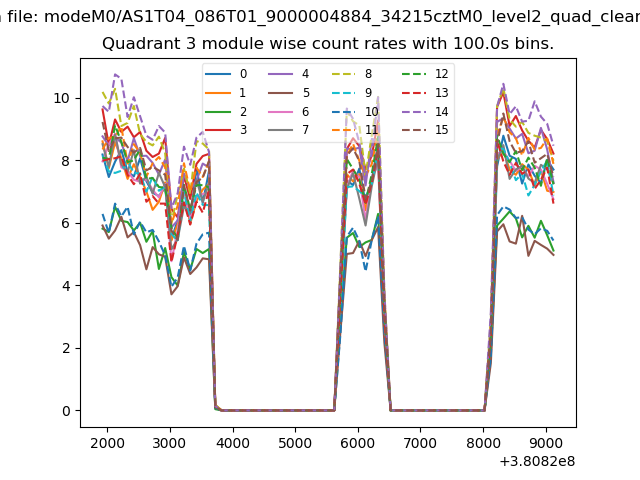
| Module-wise count rates for Quadrant C Data is divided into 100 sec bins |
 |
 |
| Module-wise count rates for Quadrant D Data is divided into 100 sec bins |
 |
 |
| Parameter | Plot |
|---|---|
| CZT HV Monitor | 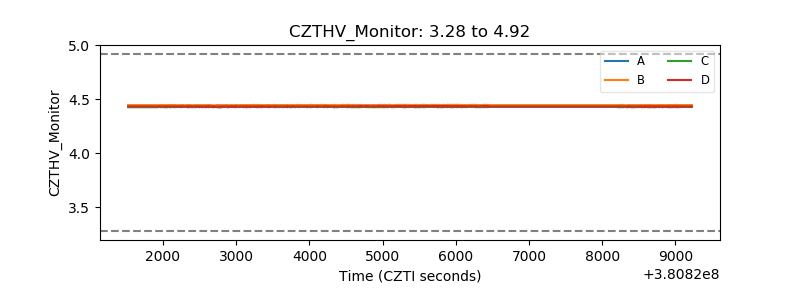 |
| D_VDD | 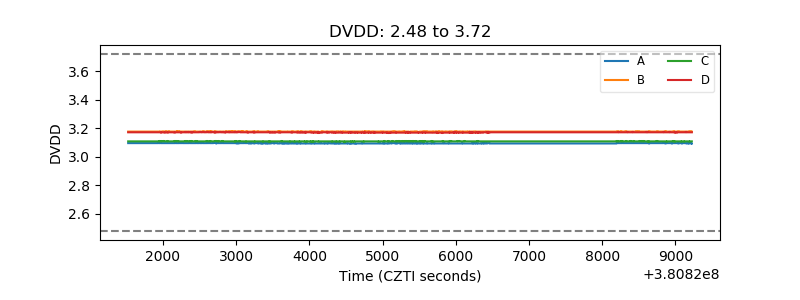 |
| Temperature 1 | 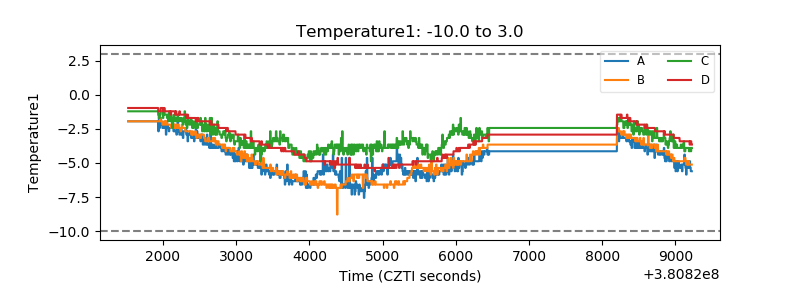 |
| Veto HV Monitor | 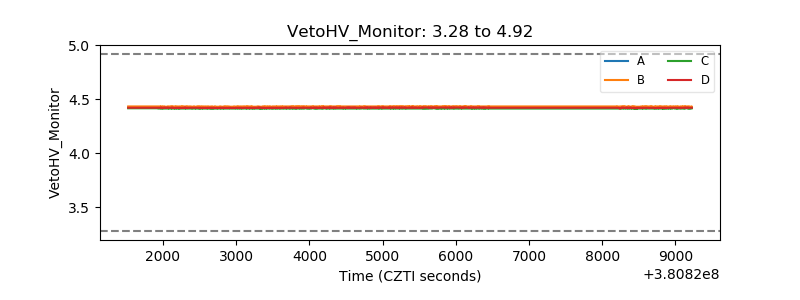 |
| Veto LLD | 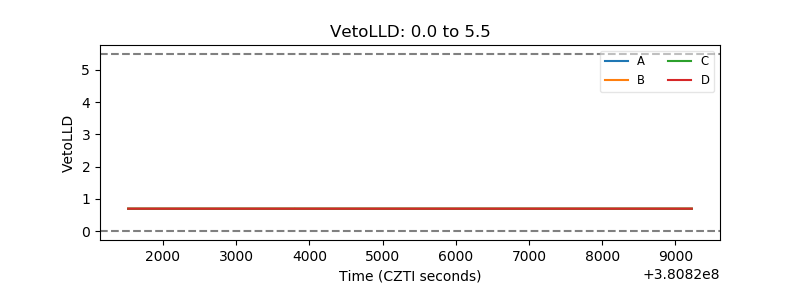 |
| Alpha Counter | 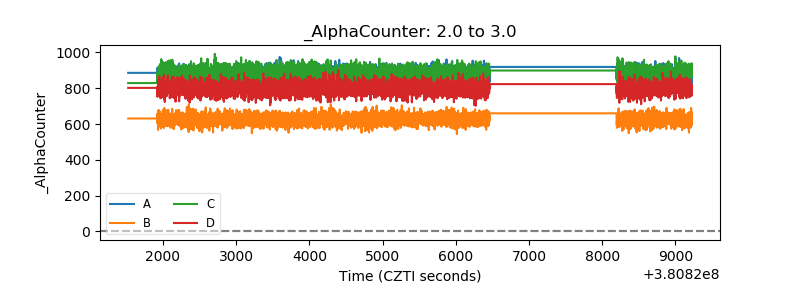 |
| _CPM_Rate | 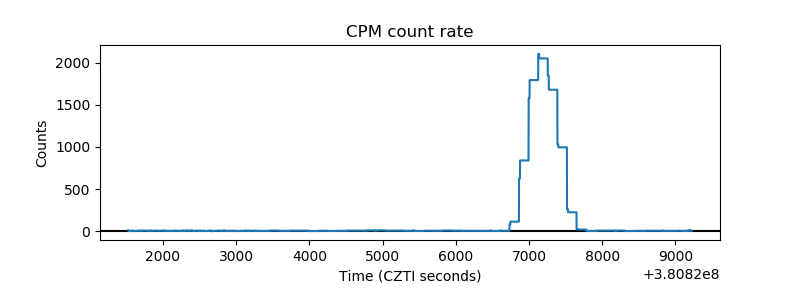 |
| CZT Counter | 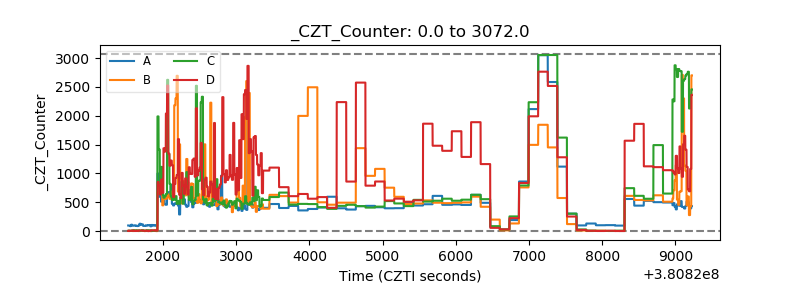 |
| +2.5 Volts monitor | 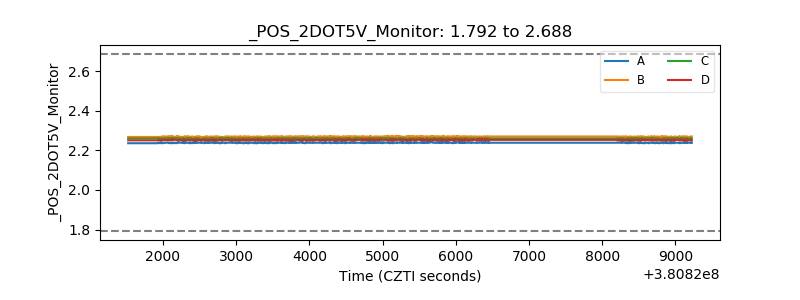 |
| +5 Volts monitor | 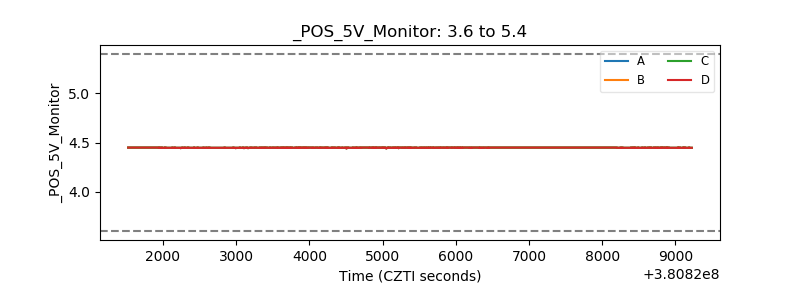 |
| _ROLL_ROT | 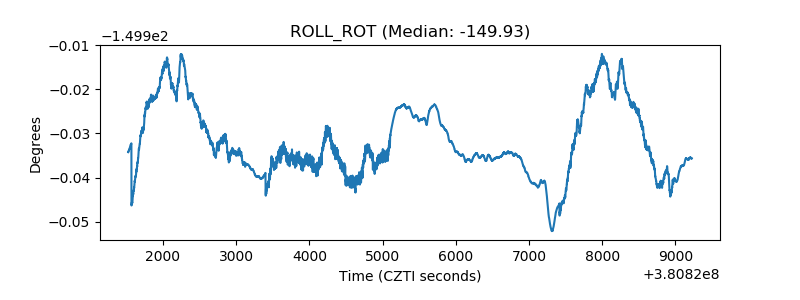 |
| _Roll_DEC | 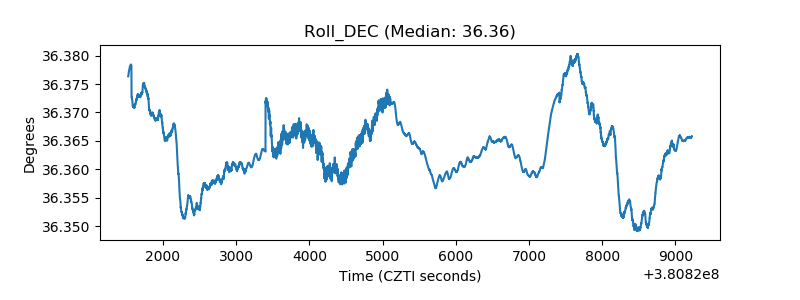 |
| _Roll_RA | 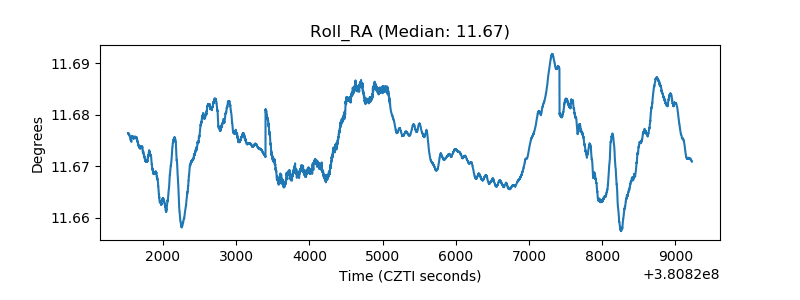 |
| Veto Counter | 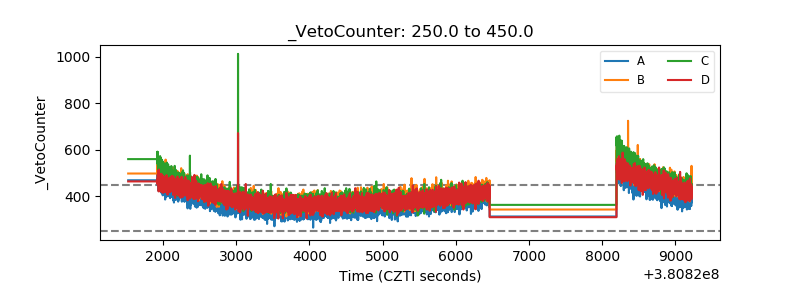 |