| Param | Original file | Final file |
|---|---|---|
| Filename | modeM0/AS1T04_086T01_9000004884_34214cztM0_level2.evt | modeM0/AS1T04_086T01_9000004884_34214cztM0_level2_quad_clean.evt |
| Size (bytes) | 529,660,800 | 69,151,680 |
| Size | 505.1 MB | 65.9 MB |
| Events in quadrant A | 2,569,535 | 441,703 |
| Events in quadrant B | 3,795,043 | 434,964 |
| Events in quadrant C | 4,137,923 | 421,760 |
| Events in quadrant D | 5,163,725 | 408,123 |
| Mode SS | |||
|---|---|---|---|
| Quadrant | BADHDUFLAG | Total packets | Discarded packets |
| A | 0 | 114 | 0 |
| B | 0 | 114 | 0 |
| C | 0 | 114 | 0 |
| D | 0 | 114 | 0 |
| Mode M9 | |||
|---|---|---|---|
| Quadrant | BADHDUFLAG | Total packets | Discarded packets |
| A | 0 | 17 | 0 |
| B | 0 | 17 | 0 |
| C | 0 | 17 | 0 |
| D | 0 | 18 | 0 |
| Mode M0 | |||
|---|---|---|---|
| Quadrant | BADHDUFLAG | Total packets | Discarded packets |
| A | 0 | 11341 | 3 |
| B | 0 | 14842 | 2 |
| C | 0 | 15729 | 2 |
| D | 0 | 19143 | 2 |
| Quadrant | Total seconds | Saturated seconds | Saturation percentage |
|---|---|---|---|
| A | 5526 | 17 | 0.307637% |
| B | 5526 | 308 | 5.573652% |
| C | 5526 | 397 | 7.184220% |
| D | 5526 | 296 | 5.356497% |
Noise dominated data is calculated using 1-second bins in cleaned event files. If a bin has >2000 counts, and if more than 50% of those come from <1% of pixels, then it is considered to be noise-dominated and hence unusable.
| Quadrant | # 1 sec bins | Bins with >0 counts | Bins with >2000 counts | High rate bins dominated by noise | Noise dominated (total time) | Noise dominated (detector-on time) | Marked lightcurve |
|---|---|---|---|---|---|---|---|
| A | 7107 | 5526 | 4 | 4 | 0.06% | 0.07% | 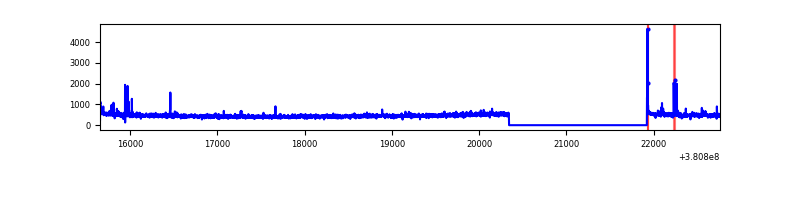 |
| B | 7107 | 5526 | 190 | 190 | 2.67% | 3.44% | 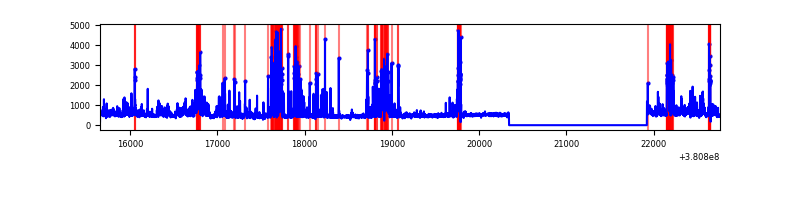 |
| C | 7107 | 5526 | 280 | 280 | 3.94% | 5.07% | 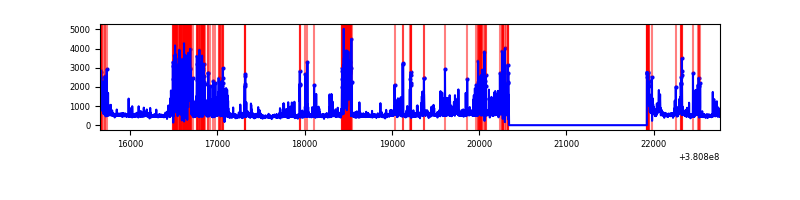 |
| D | 7107 | 5526 | 237 | 237 | 3.33% | 4.29% | 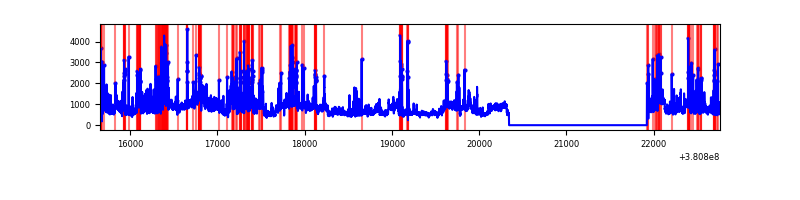 |
Top three noisy pixels from each quadrant. If the there are fewer than three noisy pixels in the level2.evt file, extra rows are filled as -1
| Pixel properties | Quadrant properties | ||||||
|---|---|---|---|---|---|---|---|
| Quadrant | DetID | PixID | Counts | Sigma | Mean | Median | Sigma |
| A | 9 | 143 | 56504 | 437.45 | 634 | 617 | 127.8 |
| A | 10 | 83 | 23377 | 178.15 | 634 | 617 | 127.8 |
| A | 13 | 6 | 18224 | 137.82 | 634 | 617 | 127.8 |
| B | 5 | 172 | 1081891 | 9079.1 | 617 | 600 | 119.1 |
| B | 5 | 31 | 154060 | 1288.53 | 617 | 600 | 119.1 |
| B | 5 | 15 | 24882 | 203.88 | 617 | 600 | 119.1 |
| C | 4 | 254 | 1086377 | 7758.84 | 604 | 610 | 139.9 |
| C | 15 | 214 | 231720 | 1651.5 | 604 | 610 | 139.9 |
| C | 9 | 69 | 206810 | 1473.5 | 604 | 610 | 139.9 |
| D | 8 | 195 | 1310926 | 8714.98 | 615 | 597 | 150.4 |
| D | 2 | 250 | 489557 | 3252.07 | 615 | 597 | 150.4 |
| D | 10 | 118 | 298070 | 1978.49 | 615 | 597 | 150.4 |
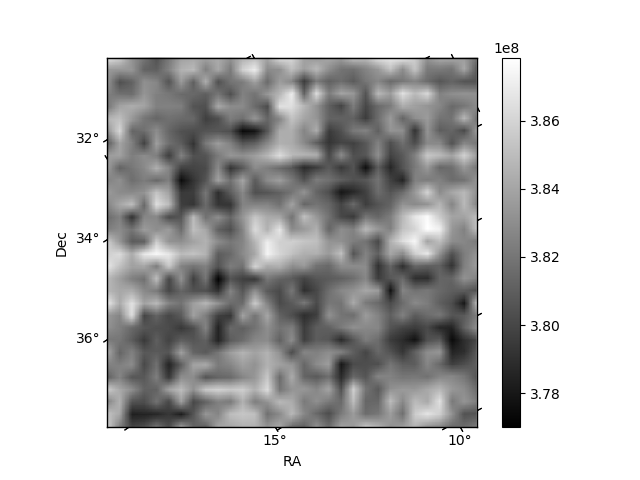
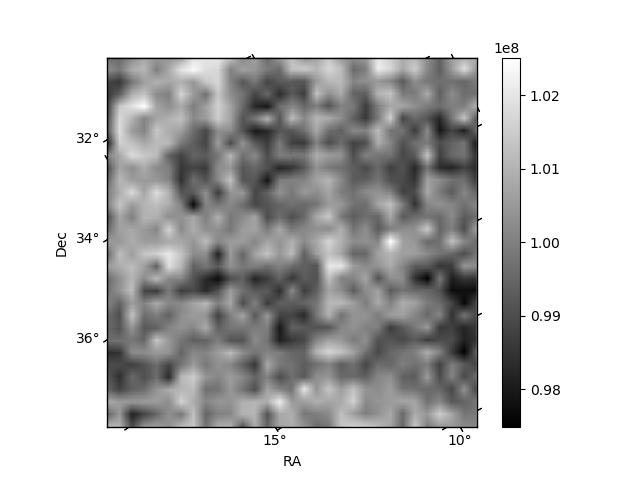
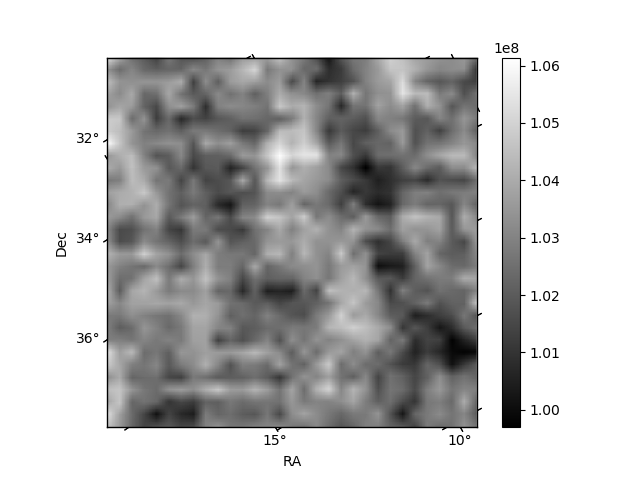
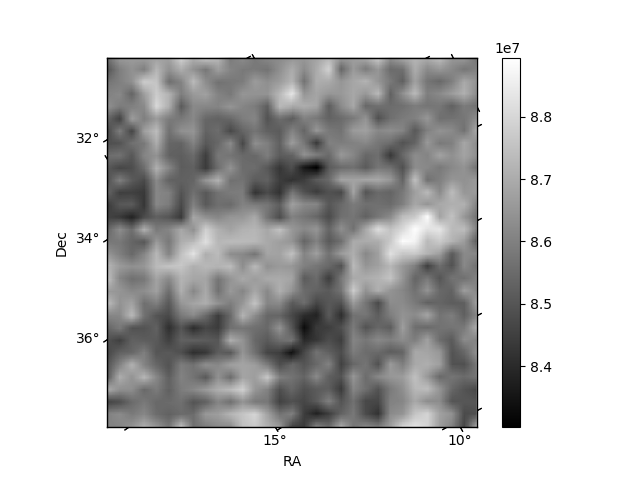
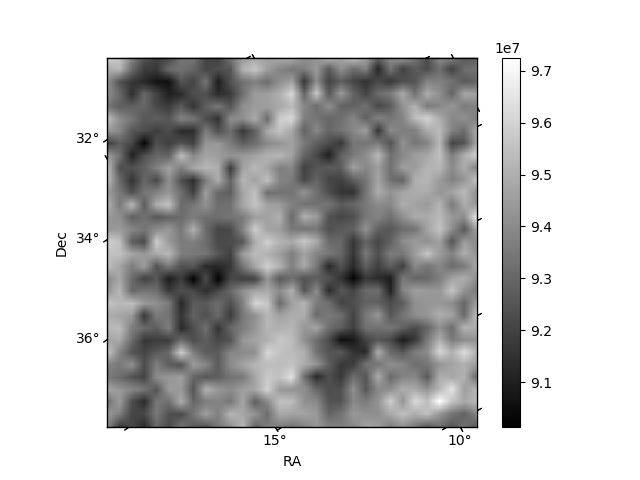
Histogram calculated using DETX and DETY for each event in the final _common_clean file
| Quadrant A | 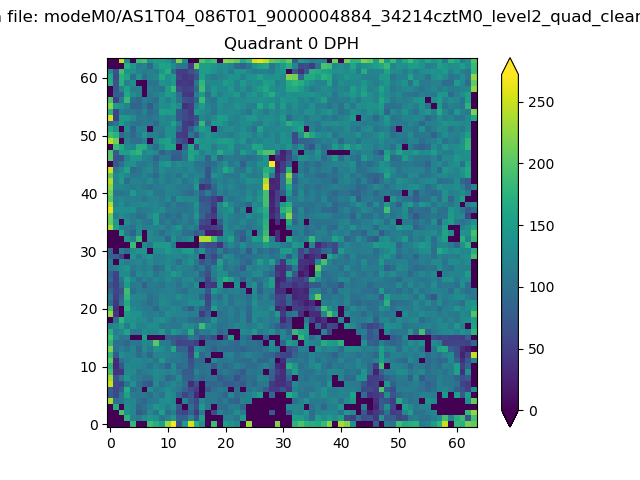 |
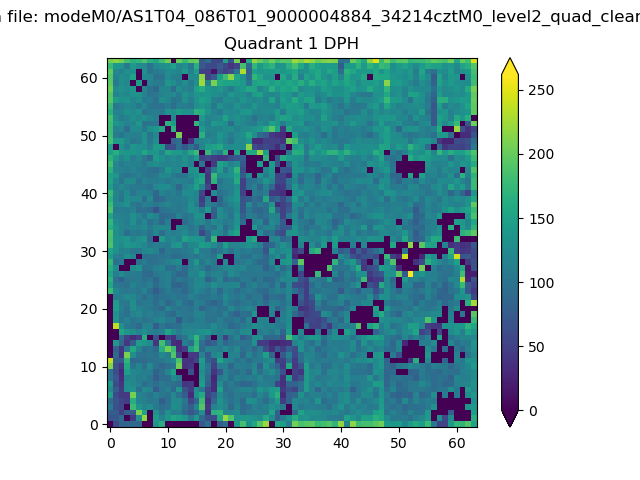 |
Quadrant B |
|---|---|---|---|
| Quadrant D | 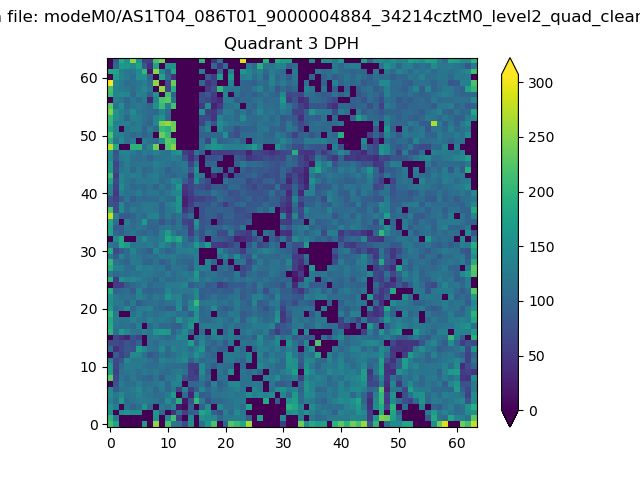 |
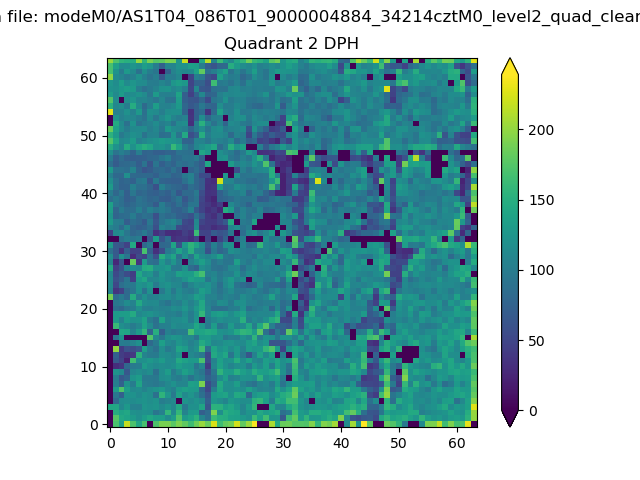 |
Quadrant C |
| Plot type | Count rate plots | Images |
|---|---|---|
| Comparison with Poisson distribution Blue bars denote a histogram of data divided into 1 sec bins. Red curve is a Poisson curve with rate = median count rate of data. |
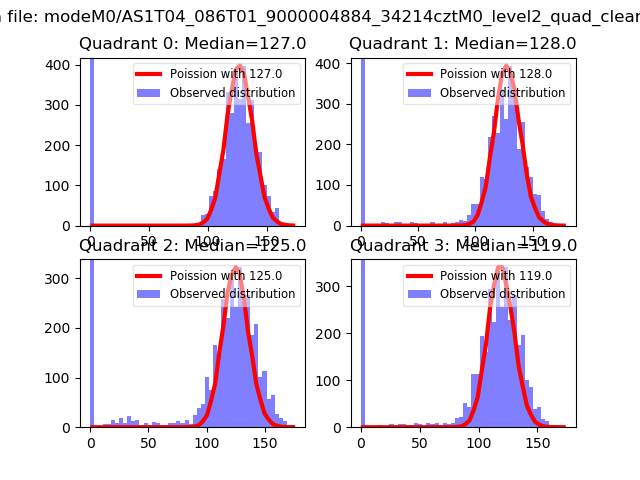 |
 |
| Quadrant-wise count rates Data is divided into 100 sec bins |
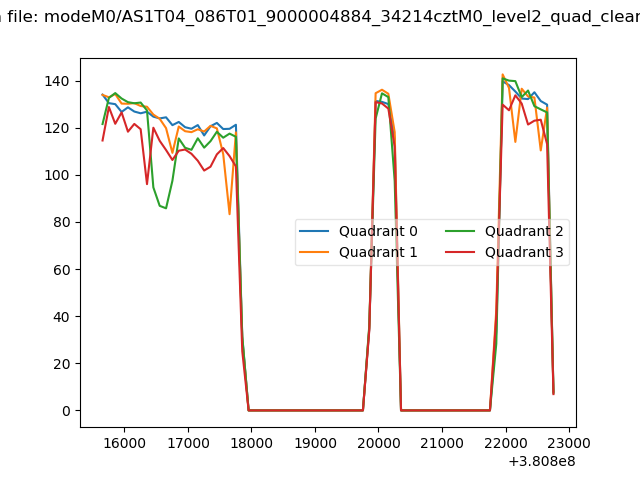 |
|
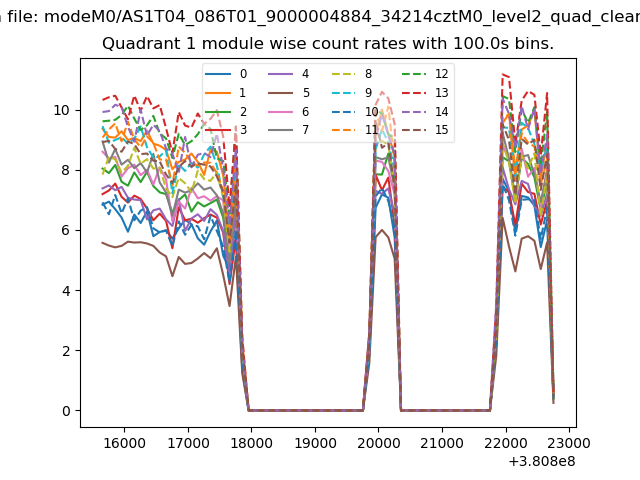
| Module-wise count rates for Quadrant A Data is divided into 100 sec bins |
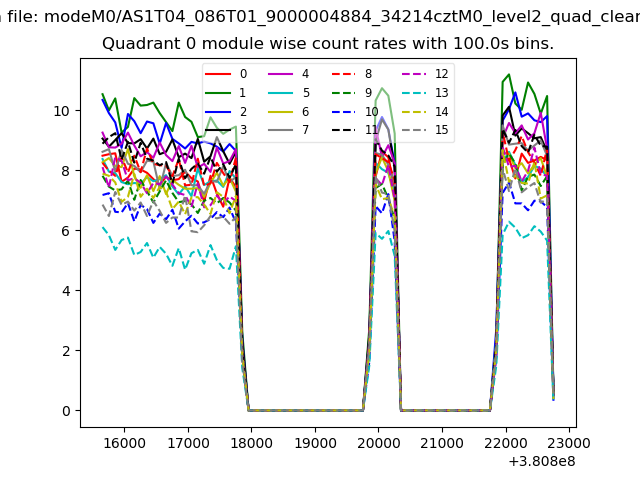 |
 |
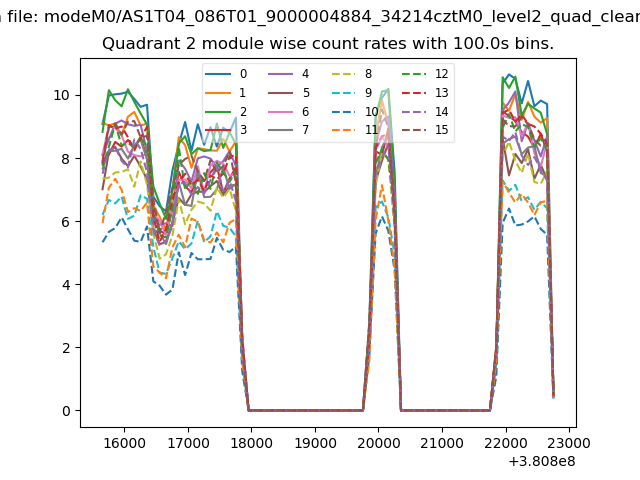
| Module-wise count rates for Quadrant B Data is divided into 100 sec bins |
 |
 |
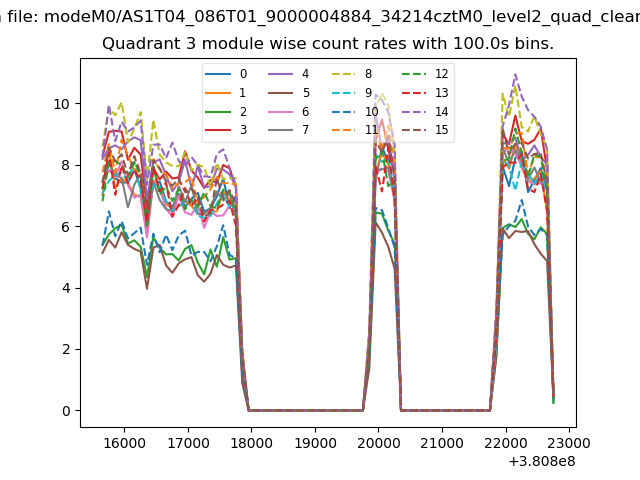
| Module-wise count rates for Quadrant C Data is divided into 100 sec bins |
 |
 |
| Module-wise count rates for Quadrant D Data is divided into 100 sec bins |
 |
 |
| Parameter | Plot |
|---|---|
| CZT HV Monitor | 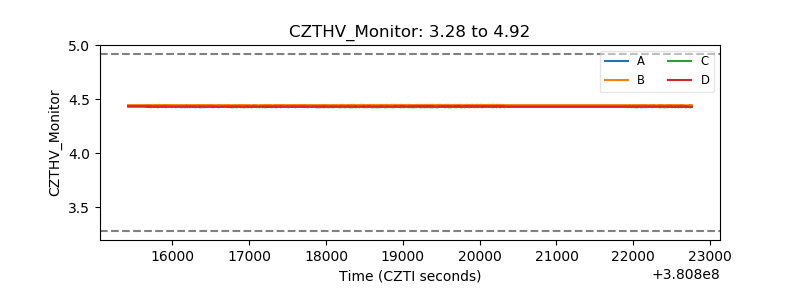 |
| D_VDD | 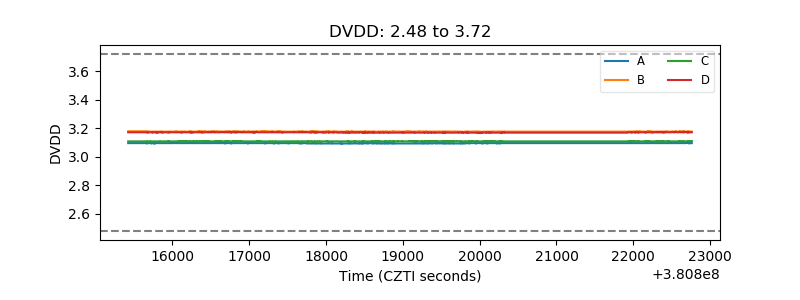 |
| Temperature 1 | 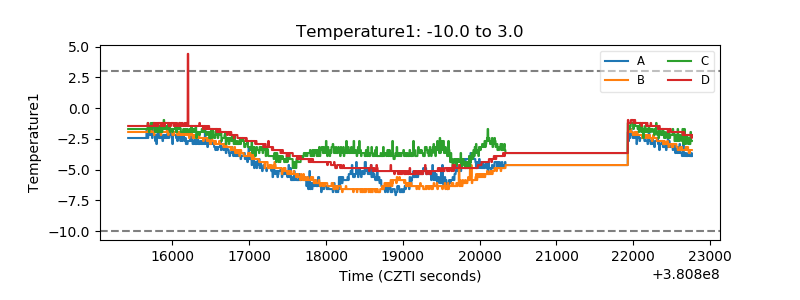 |
| Veto HV Monitor | 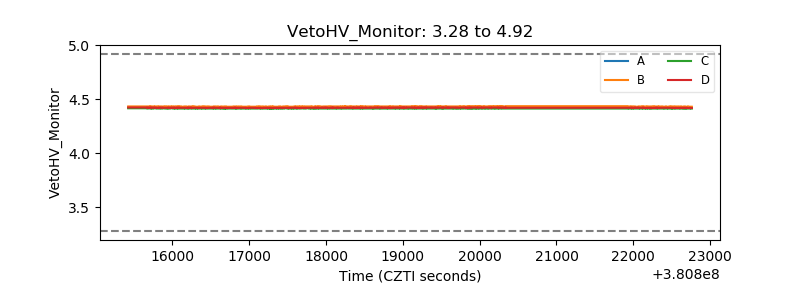 |
| Veto LLD | 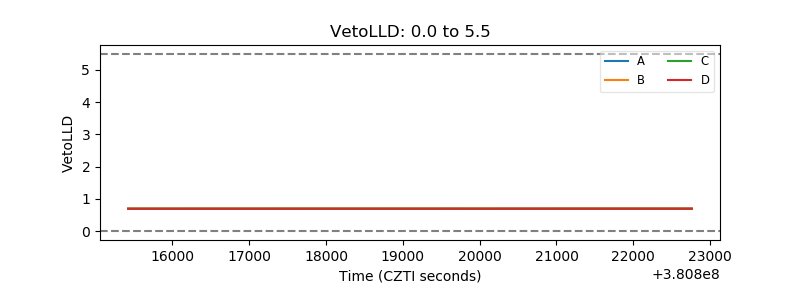 |
| Alpha Counter | 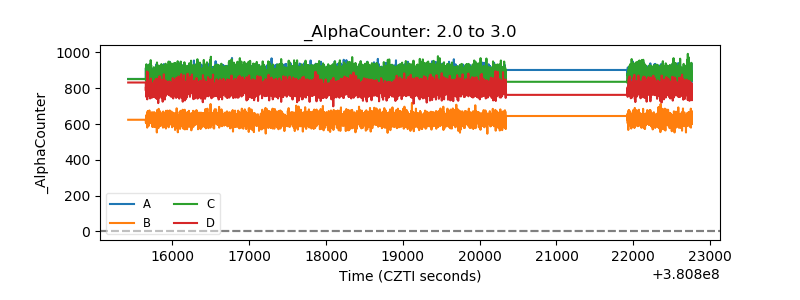 |
| _CPM_Rate | 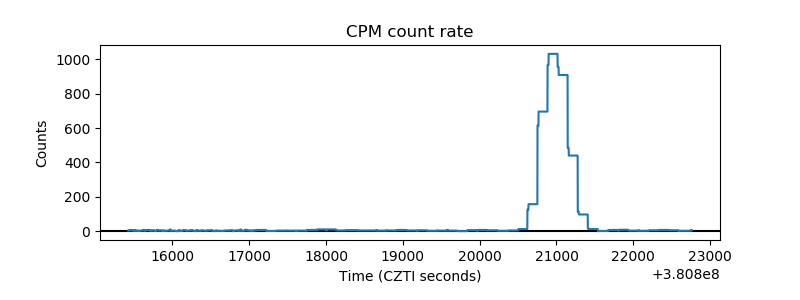 |
| CZT Counter | 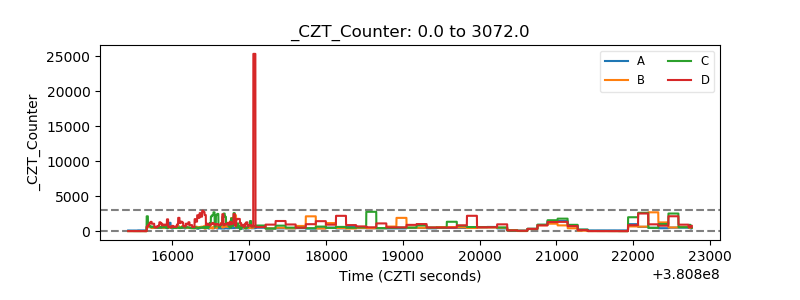 |
| +2.5 Volts monitor | 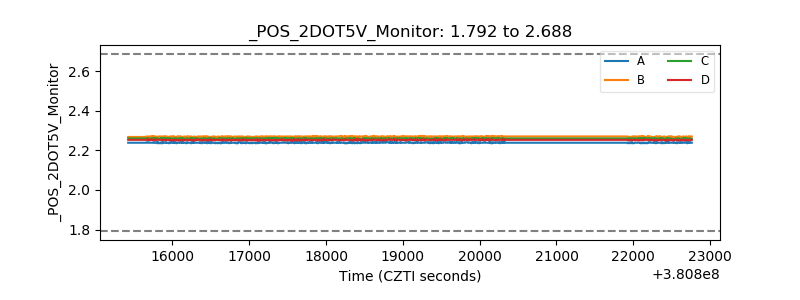 |
| +5 Volts monitor | 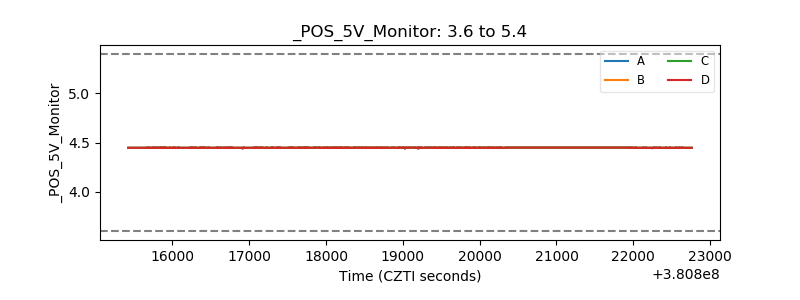 |
| _ROLL_ROT | 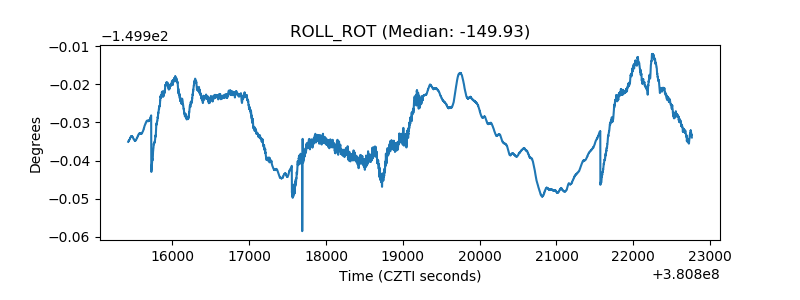 |
| _Roll_DEC | 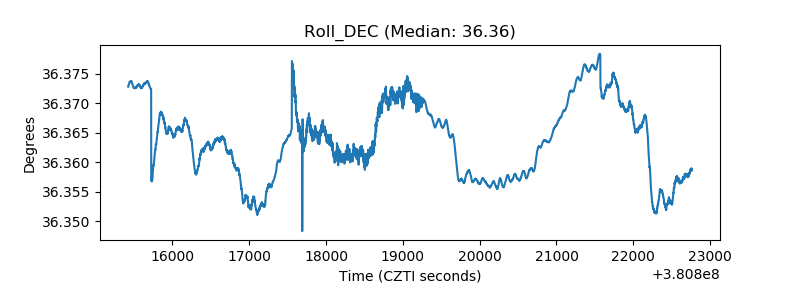 |
| _Roll_RA | 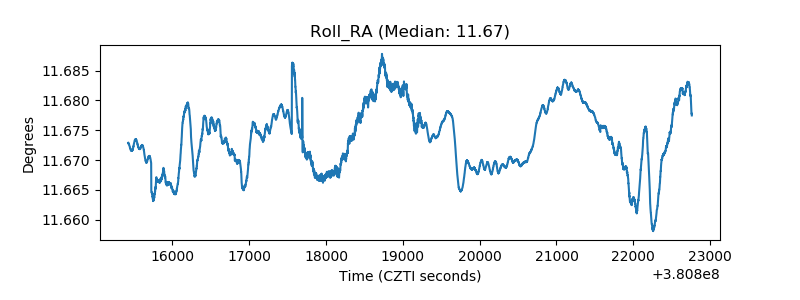 |
| Veto Counter | 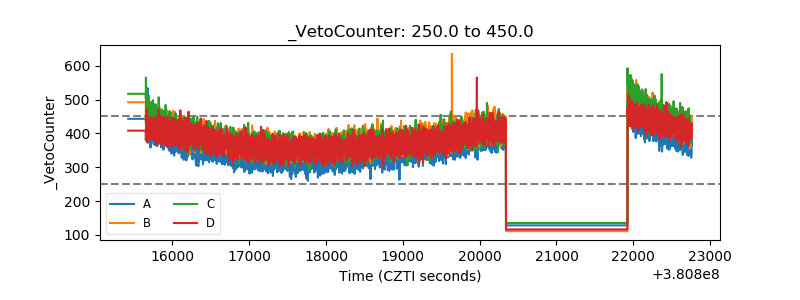 |