| Param | Original file | Final file |
|---|---|---|
| Filename | modeM0/AS1T04_086T01_9000004884_34210cztM0_level2.evt | modeM0/AS1T04_086T01_9000004884_34210cztM0_level2_quad_clean.evt |
| Size (bytes) | 578,986,560 | 88,439,040 |
| Size | 552.2 MB | 84.3 MB |
| Events in quadrant A | 2,686,065 | 582,587 |
| Events in quadrant B | 7,278,762 | 532,658 |
| Events in quadrant C | 3,104,727 | 593,294 |
| Events in quadrant D | 4,069,505 | 560,974 |
| Mode SS | |||
|---|---|---|---|
| Quadrant | BADHDUFLAG | Total packets | Discarded packets |
| A | 0 | 118 | 0 |
| B | 0 | 118 | 0 |
| C | 0 | 118 | 0 |
| D | 0 | 118 | 0 |
| Mode M9 | |||
|---|---|---|---|
| Quadrant | BADHDUFLAG | Total packets | Discarded packets |
| A | 0 | 19 | 0 |
| B | 0 | 19 | 0 |
| C | 0 | 19 | 0 |
| D | 0 | 20 | 0 |
| Mode M0 | |||
|---|---|---|---|
| Quadrant | BADHDUFLAG | Total packets | Discarded packets |
| A | 0 | 11838 | 3 |
| B | 0 | 25605 | 2 |
| C | 0 | 12619 | 2 |
| D | 0 | 15947 | 2 |
| Quadrant | Total seconds | Saturated seconds | Saturation percentage |
|---|---|---|---|
| A | 5845 | 5 | 0.085543% |
| B | 5845 | 1462 | 25.012831% |
| C | 5845 | 38 | 0.650128% |
| D | 5845 | 129 | 2.207015% |
Noise dominated data is calculated using 1-second bins in cleaned event files. If a bin has >2000 counts, and if more than 50% of those come from <1% of pixels, then it is considered to be noise-dominated and hence unusable.
| Quadrant | # 1 sec bins | Bins with >0 counts | Bins with >2000 counts | High rate bins dominated by noise | Noise dominated (total time) | Noise dominated (detector-on time) | Marked lightcurve |
|---|---|---|---|---|---|---|---|
| A | 7187 | 5846 | 0 | 0 | 0.00% | 0.00% | 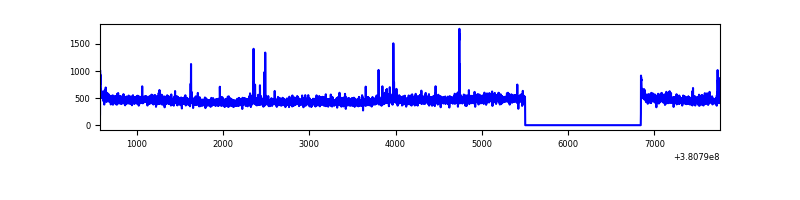 |
| B | 7187 | 5846 | 1063 | 1063 | 14.79% | 18.18% | 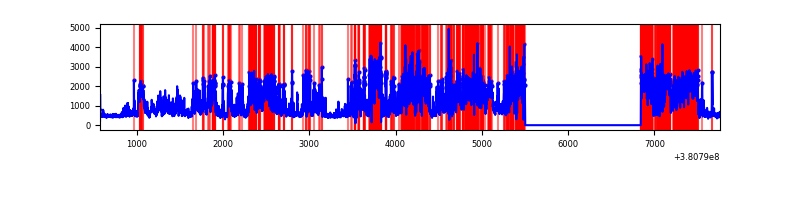 |
| C | 7187 | 5846 | 22 | 22 | 0.31% | 0.38% | 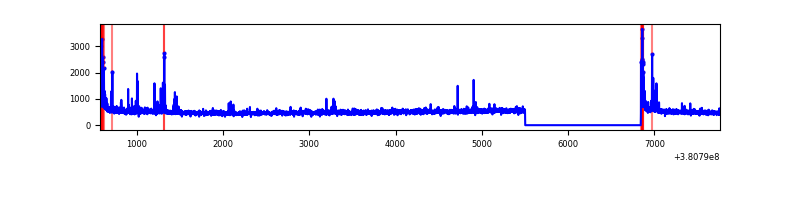 |
| D | 7187 | 5846 | 104 | 104 | 1.45% | 1.78% | 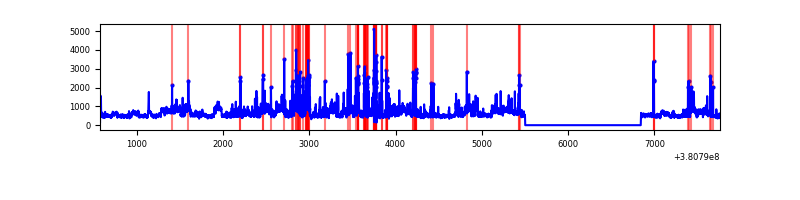 |
Top three noisy pixels from each quadrant. If the there are fewer than three noisy pixels in the level2.evt file, extra rows are filled as -1
| Pixel properties | Quadrant properties | ||||||
|---|---|---|---|---|---|---|---|
| Quadrant | DetID | PixID | Counts | Sigma | Mean | Median | Sigma |
| A | 9 | 143 | 23894 | 171.15 | 676 | 662 | 135.7 |
| A | 10 | 83 | 23589 | 168.9 | 676 | 662 | 135.7 |
| A | 13 | 6 | 18122 | 128.62 | 676 | 662 | 135.7 |
| B | 5 | 31 | 2579214 | 21441.99 | 619 | 603 | 120.3 |
| B | 5 | 172 | 1151150 | 9567.17 | 619 | 603 | 120.3 |
| B | 5 | 15 | 860366 | 7149.21 | 619 | 603 | 120.3 |
| C | 15 | 214 | 272358 | 1806.93 | 659 | 667 | 150.4 |
| C | 0 | 10 | 144141 | 954.2 | 659 | 667 | 150.4 |
| C | 4 | 254 | 76974 | 507.49 | 659 | 667 | 150.4 |
| D | 8 | 195 | 760494 | 4728.8 | 659 | 641 | 160.7 |
| D | 10 | 118 | 175832 | 1090.27 | 659 | 641 | 160.7 |
| D | 13 | 249 | 171624 | 1064.08 | 659 | 641 | 160.7 |
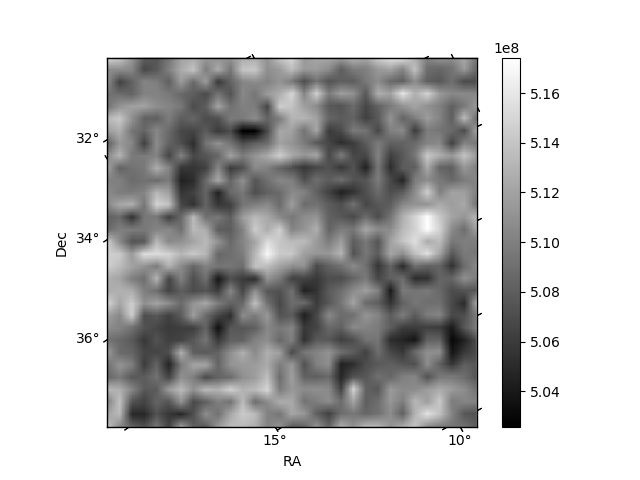
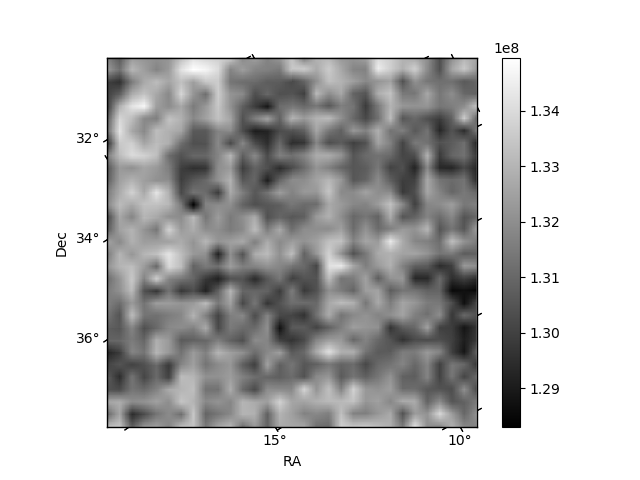
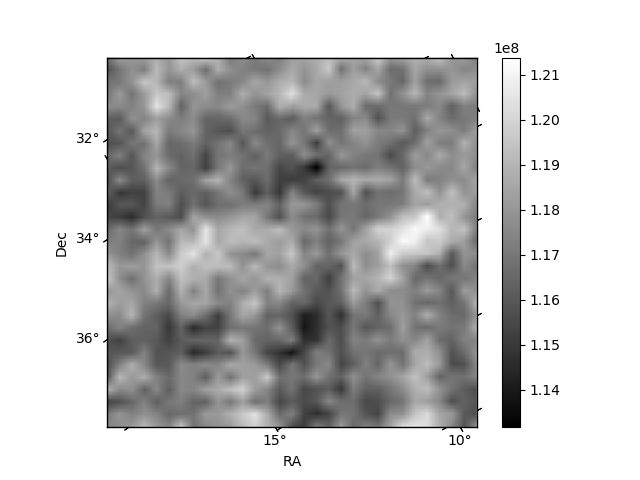
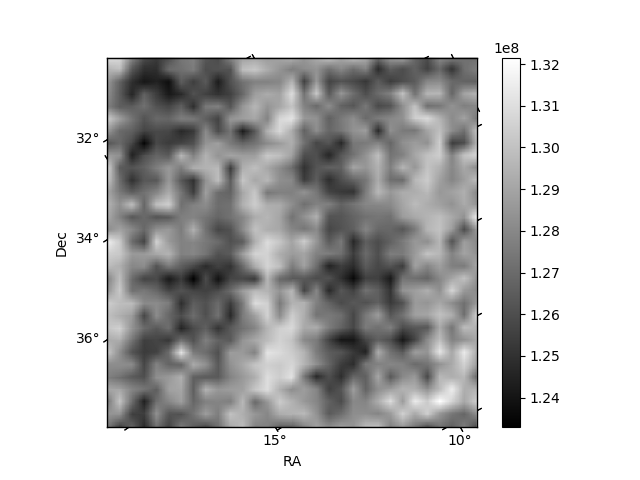
Histogram calculated using DETX and DETY for each event in the final _common_clean file
| Quadrant A | 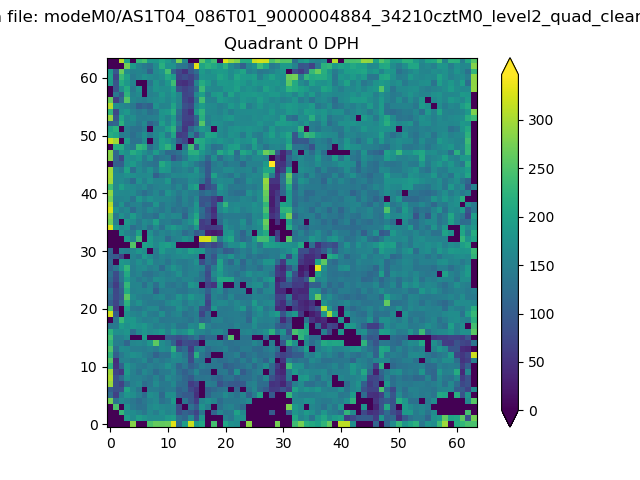 |
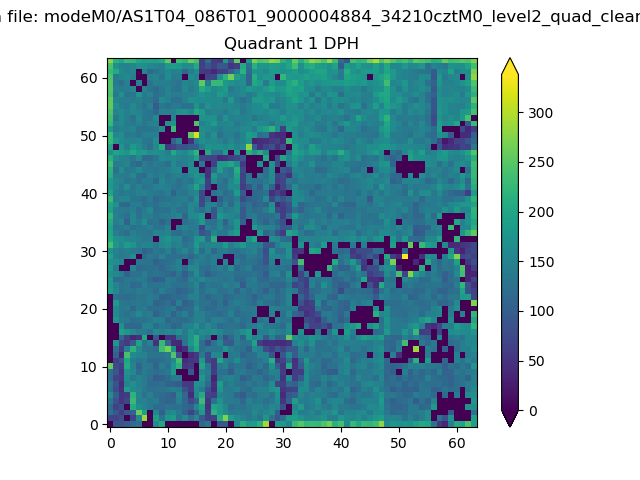 |
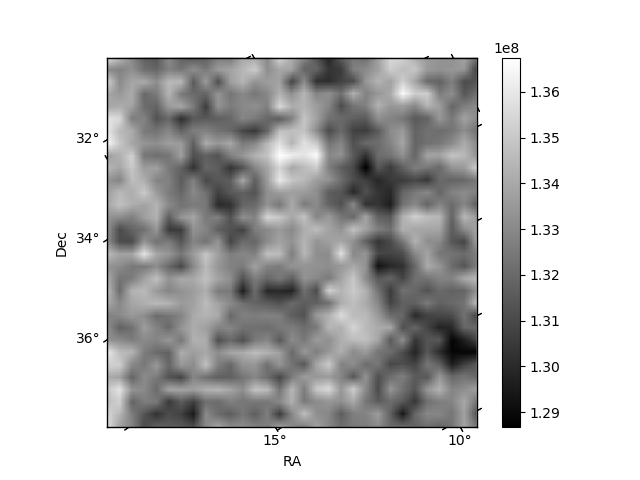
Quadrant B |
|---|---|---|---|
| Quadrant D | 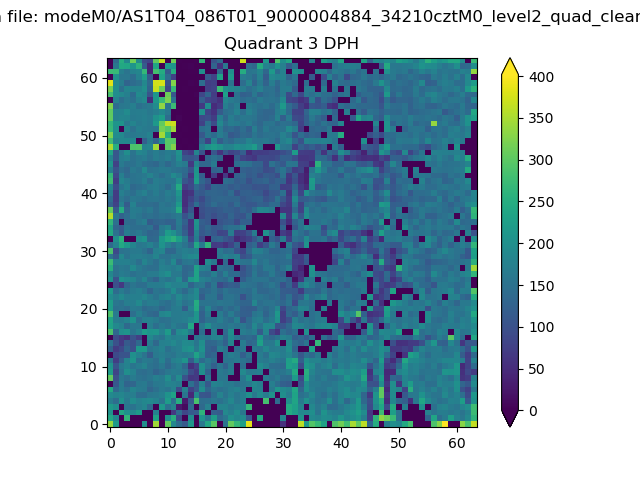 |
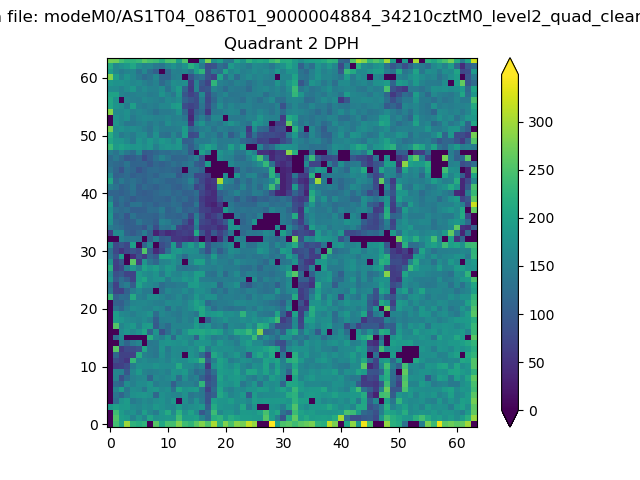 |
Quadrant C |
| Plot type | Count rate plots | Images |
|---|---|---|
| Comparison with Poisson distribution Blue bars denote a histogram of data divided into 1 sec bins. Red curve is a Poisson curve with rate = median count rate of data. |
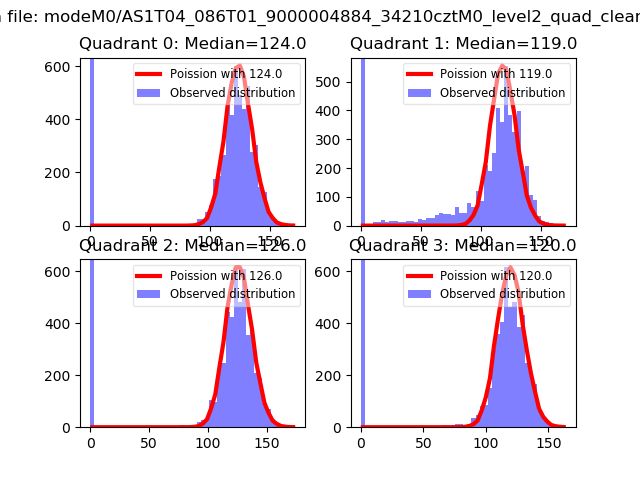 |
 |
| Quadrant-wise count rates Data is divided into 100 sec bins |
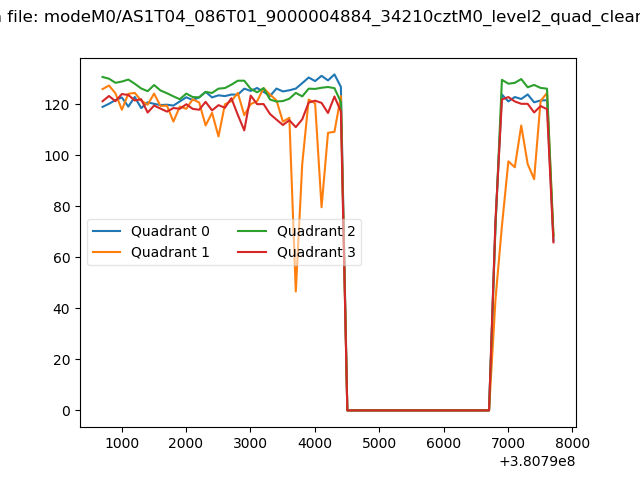 |
|
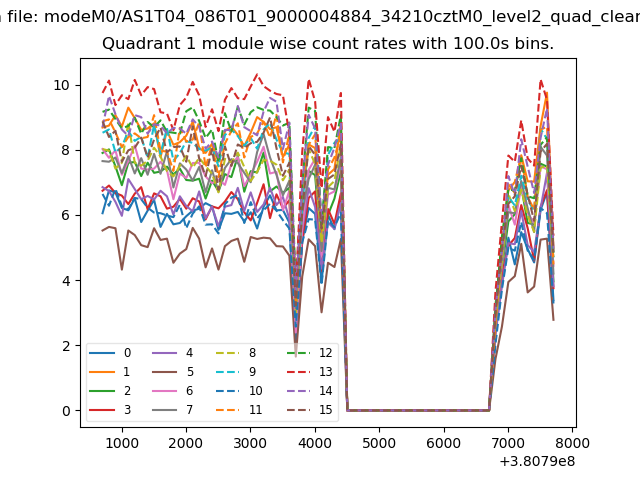
| Module-wise count rates for Quadrant A Data is divided into 100 sec bins |
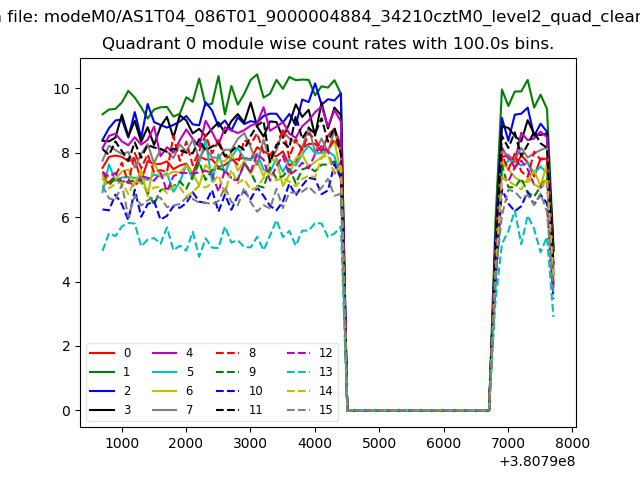 |
 |
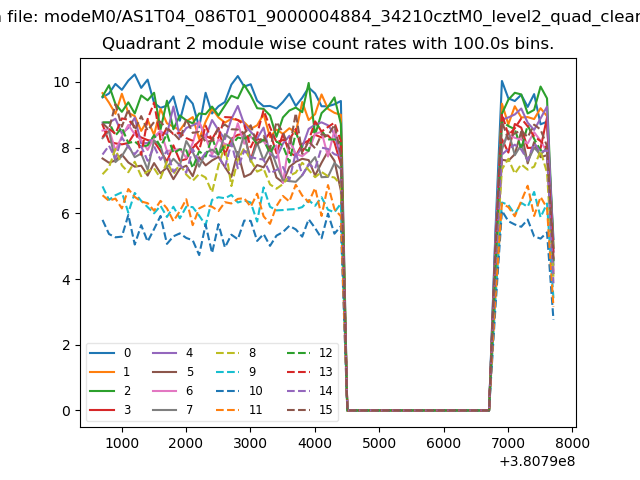
| Module-wise count rates for Quadrant B Data is divided into 100 sec bins |
 |
 |
| Module-wise count rates for Quadrant C Data is divided into 100 sec bins |
 |
 |
| Module-wise count rates for Quadrant D Data is divided into 100 sec bins |
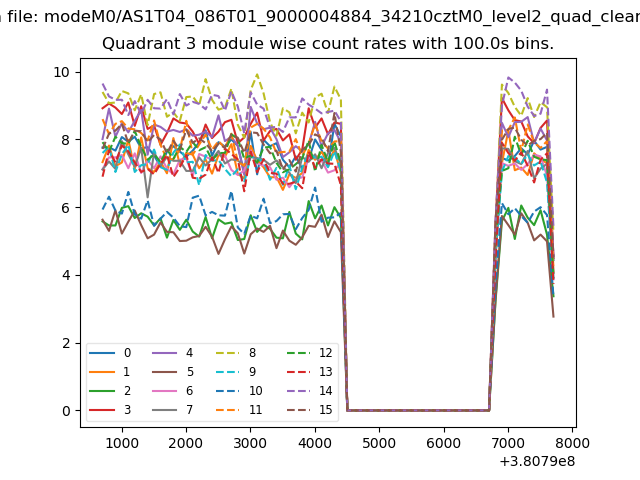 |
 |
| Parameter | Plot |
|---|---|
| CZT HV Monitor | 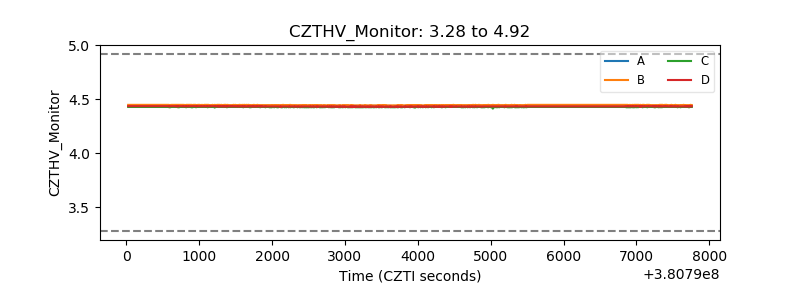 |
| D_VDD | 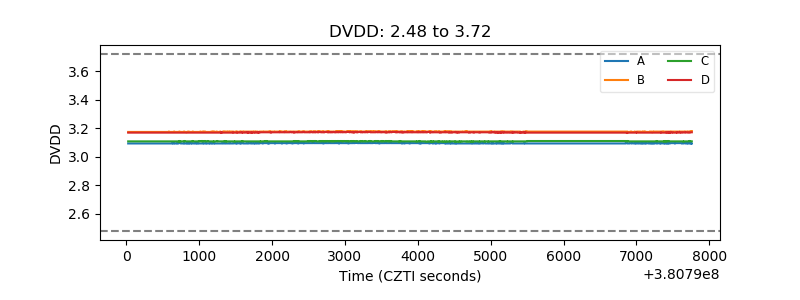 |
| Temperature 1 | 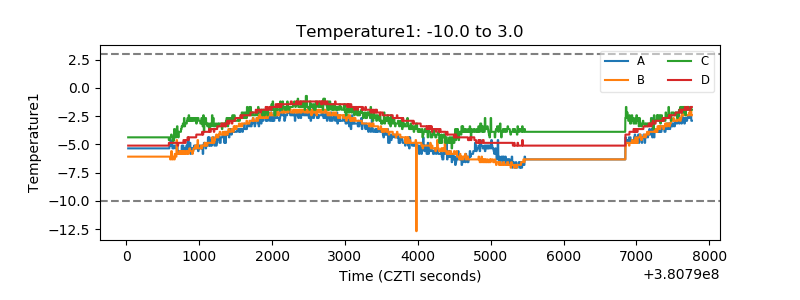 |
| Veto HV Monitor | 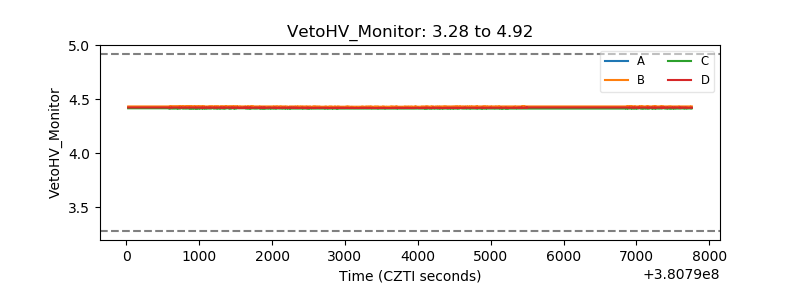 |
| Veto LLD | 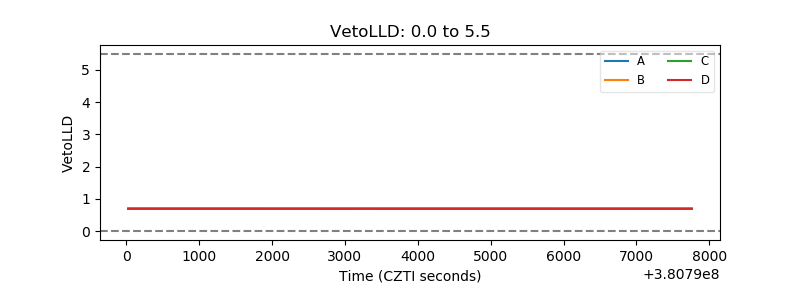 |
| Alpha Counter | 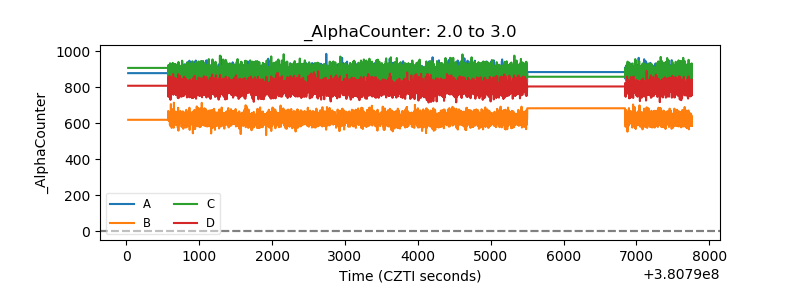 |
| _CPM_Rate | 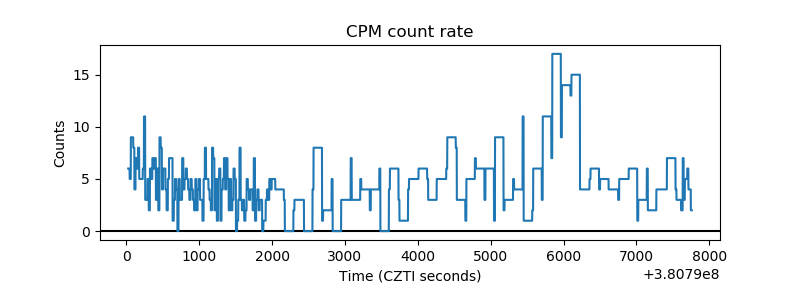 |
| CZT Counter | 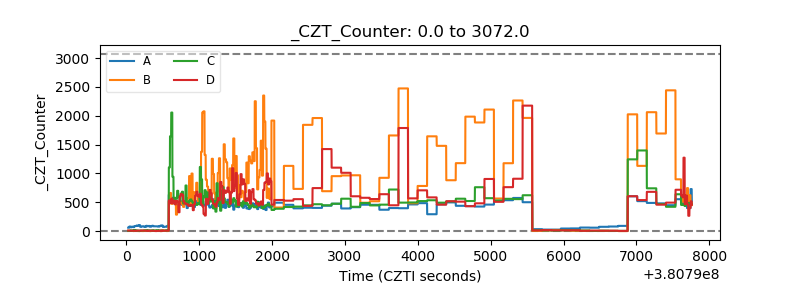 |
| +2.5 Volts monitor | 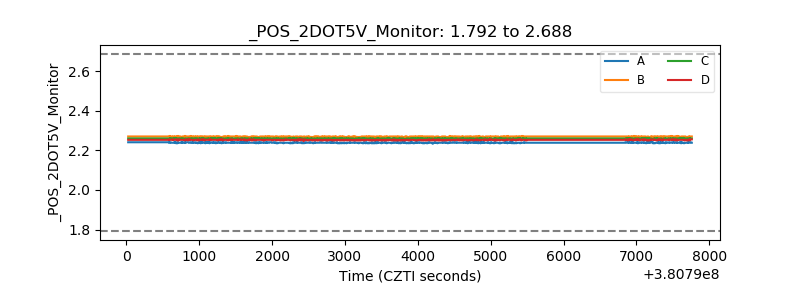 |
| +5 Volts monitor | 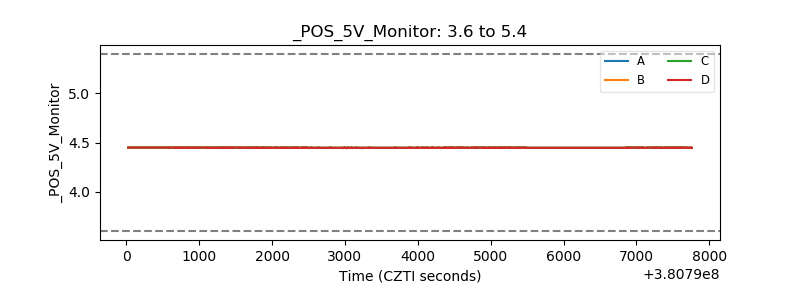 |
| _ROLL_ROT | 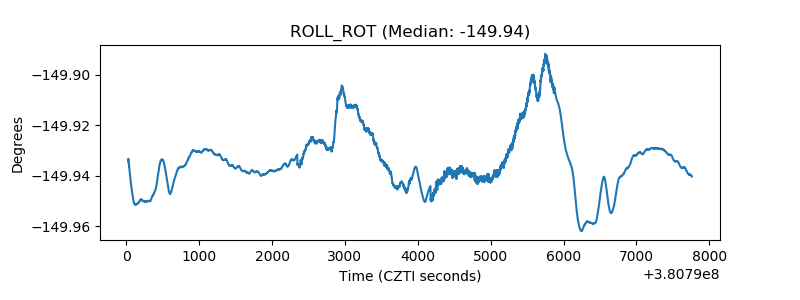 |
| _Roll_DEC | 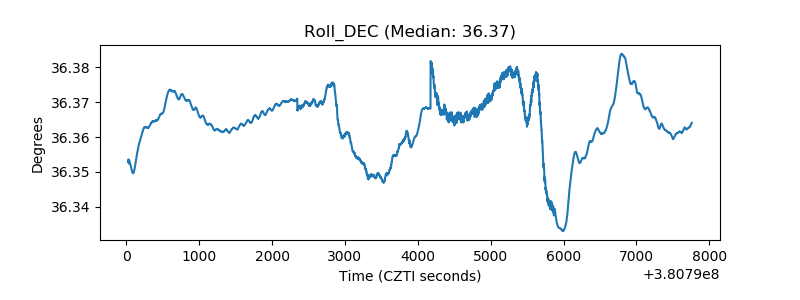 |
| _Roll_RA | 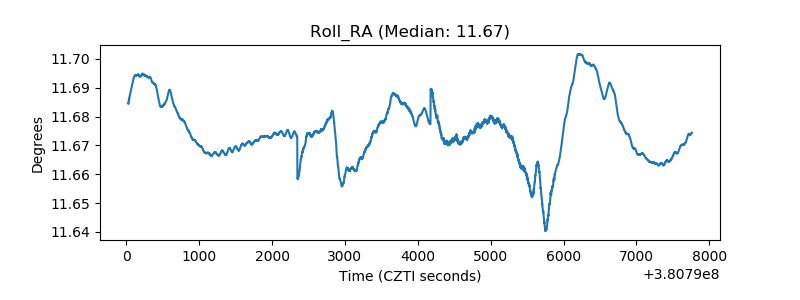 |
| Veto Counter | 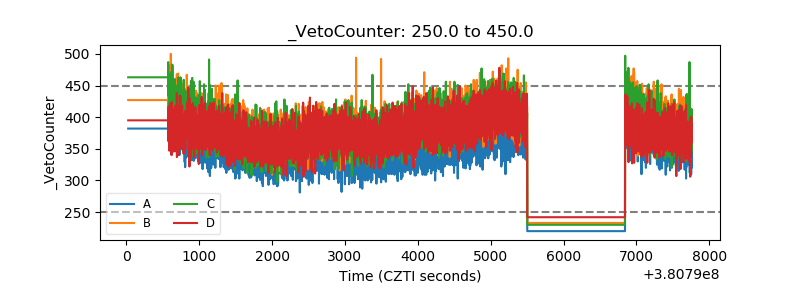 |