| Param | Original file | Final file |
|---|---|---|
| Filename | modeM0/AS1T04_086T01_9000004884_34209cztM0_level2.evt | modeM0/AS1T04_086T01_9000004884_34209cztM0_level2_quad_clean.evt |
| Size (bytes) | 743,400,000 | 82,319,040 |
| Size | 709.0 MB | 78.5 MB |
| Events in quadrant A | 2,611,060 | 570,317 |
| Events in quadrant B | 10,270,960 | 415,386 |
| Events in quadrant C | 3,315,219 | 583,512 |
| Events in quadrant D | 5,933,572 | 525,504 |
| Mode SS | |||
|---|---|---|---|
| Quadrant | BADHDUFLAG | Total packets | Discarded packets |
| A | 0 | 116 | 0 |
| B | 0 | 116 | 0 |
| C | 0 | 116 | 0 |
| D | 0 | 116 | 0 |
| Mode M9 | |||
|---|---|---|---|
| Quadrant | BADHDUFLAG | Total packets | Discarded packets |
| A | 0 | 28 | 0 |
| B | 0 | 28 | 0 |
| C | 0 | 28 | 0 |
| D | 0 | 29 | 0 |
| Mode M0 | |||
|---|---|---|---|
| Quadrant | BADHDUFLAG | Total packets | Discarded packets |
| A | 0 | 11480 | 3 |
| B | 0 | 34321 | 2 |
| C | 0 | 13218 | 2 |
| D | 0 | 21503 | 2 |
| Quadrant | Total seconds | Saturated seconds | Saturation percentage |
|---|---|---|---|
| A | 5668 | 11 | 0.194072% |
| B | 5668 | 3329 | 58.733239% |
| C | 5668 | 81 | 1.429076% |
| D | 5668 | 720 | 12.702893% |
Noise dominated data is calculated using 1-second bins in cleaned event files. If a bin has >2000 counts, and if more than 50% of those come from <1% of pixels, then it is considered to be noise-dominated and hence unusable.
| Quadrant | # 1 sec bins | Bins with >0 counts | Bins with >2000 counts | High rate bins dominated by noise | Noise dominated (total time) | Noise dominated (detector-on time) | Marked lightcurve |
|---|---|---|---|---|---|---|---|
| A | 7160 | 5669 | 5 | 5 | 0.07% | 0.09% | 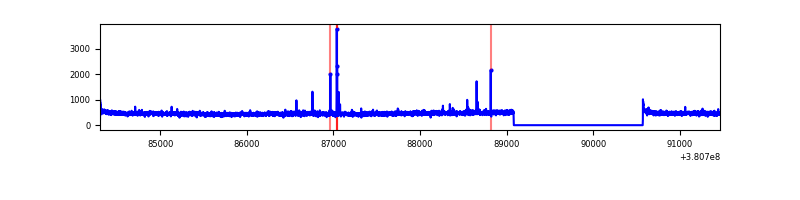 |
| B | 7160 | 5669 | 2974 | 2974 | 41.54% | 52.46% | 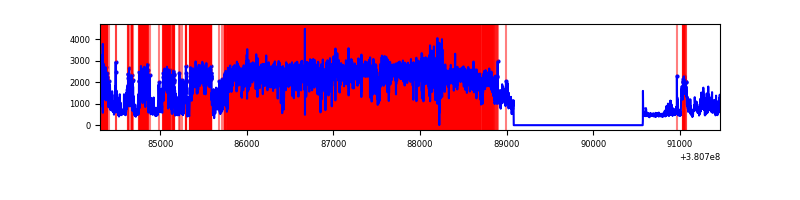 |
| C | 7160 | 5669 | 62 | 62 | 0.87% | 1.09% | 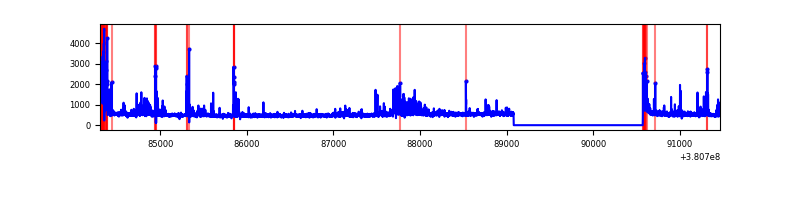 |
| D | 7160 | 5669 | 625 | 625 | 8.73% | 11.02% | 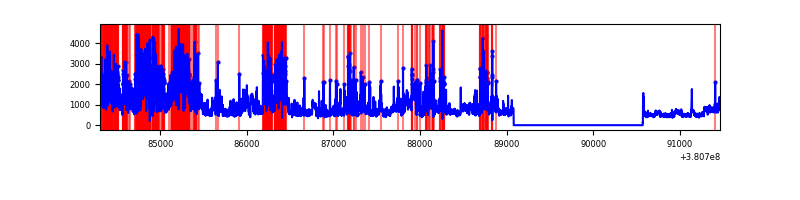 |
Top three noisy pixels from each quadrant. If the there are fewer than three noisy pixels in the level2.evt file, extra rows are filled as -1
| Pixel properties | Quadrant properties | ||||||
|---|---|---|---|---|---|---|---|
| Quadrant | DetID | PixID | Counts | Sigma | Mean | Median | Sigma |
| A | 9 | 143 | 27101 | 200.54 | 657 | 643 | 131.9 |
| A | 10 | 83 | 23199 | 170.97 | 657 | 643 | 131.9 |
| A | 13 | 6 | 14652 | 106.18 | 657 | 643 | 131.9 |
| B | 5 | 31 | 4680199 | 46051.48 | 523 | 511 | 101.6 |
| B | 5 | 15 | 2462808 | 24230.76 | 523 | 511 | 101.6 |
| B | 5 | 172 | 521385 | 5125.77 | 523 | 511 | 101.6 |
| C | 4 | 254 | 283478 | 1933.33 | 638 | 644 | 146.3 |
| C | 15 | 214 | 265363 | 1809.51 | 638 | 644 | 146.3 |
| C | 0 | 10 | 225024 | 1533.77 | 638 | 644 | 146.3 |
| D | 2 | 250 | 1498061 | 10022.27 | 613 | 597 | 149.4 |
| D | 8 | 195 | 928417 | 6209.74 | 613 | 597 | 149.4 |
| D | 12 | 217 | 632205 | 4227.25 | 613 | 597 | 149.4 |
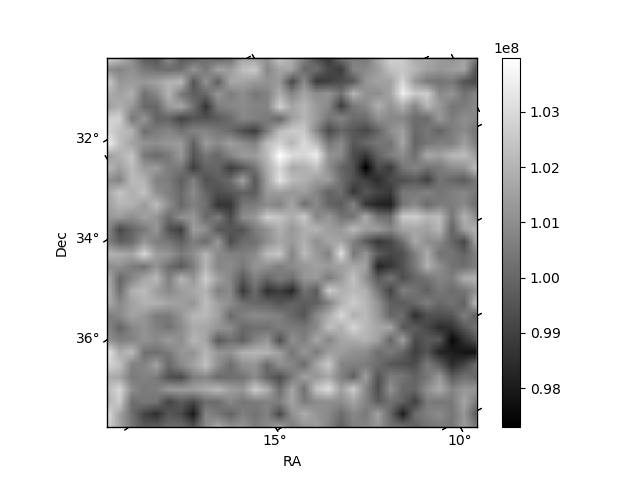
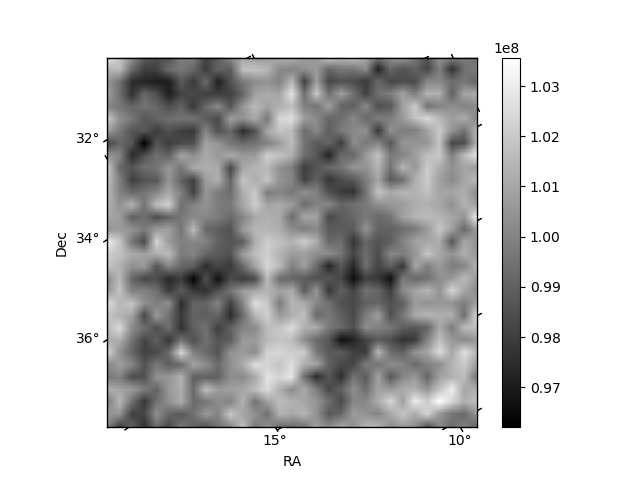
Histogram calculated using DETX and DETY for each event in the final _common_clean file
| Quadrant A | 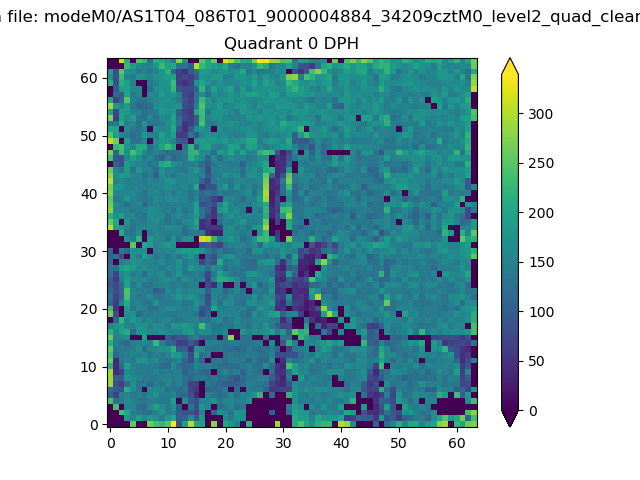 |
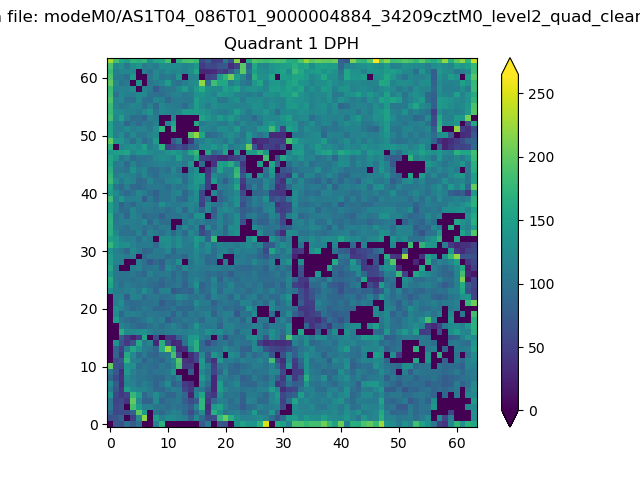 |
Quadrant B |
|---|---|---|---|
| Quadrant D | 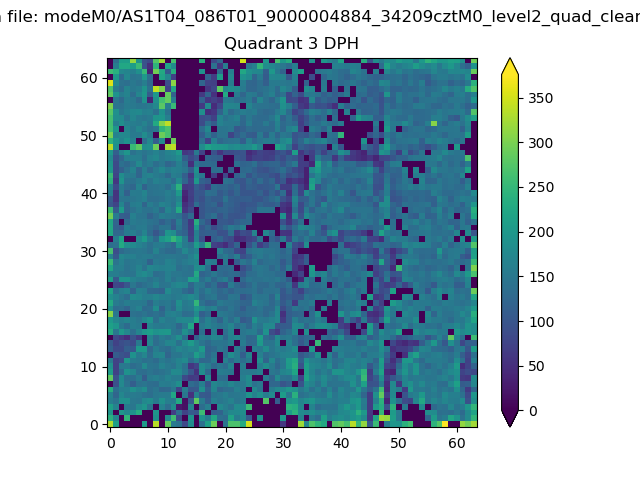 |
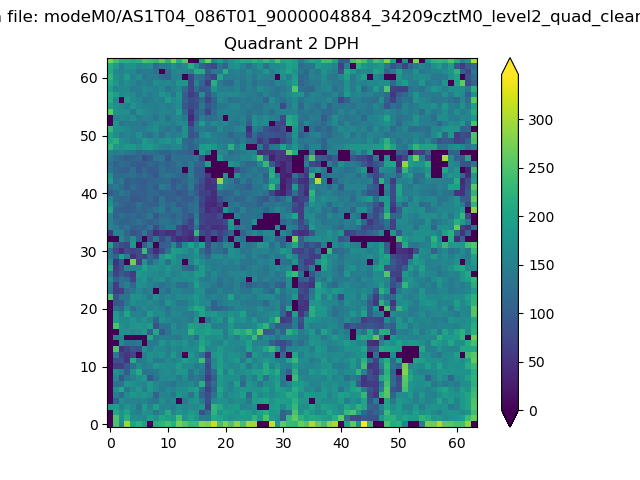 |
Quadrant C |
| Plot type | Count rate plots | Images |
|---|---|---|
| Comparison with Poisson distribution Blue bars denote a histogram of data divided into 1 sec bins. Red curve is a Poisson curve with rate = median count rate of data. |
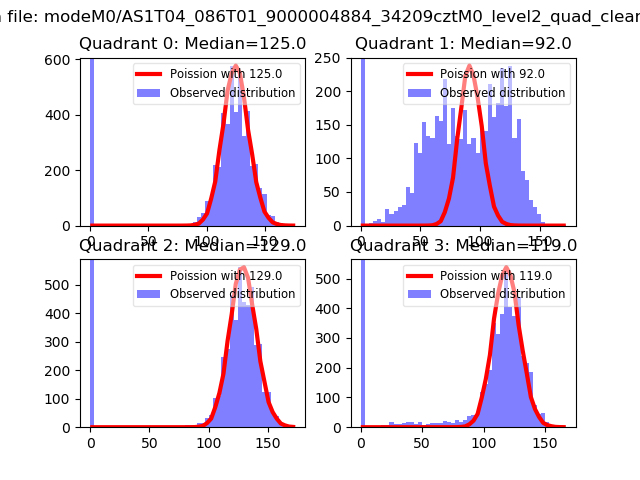 |
 |
| Quadrant-wise count rates Data is divided into 100 sec bins |
 |
|
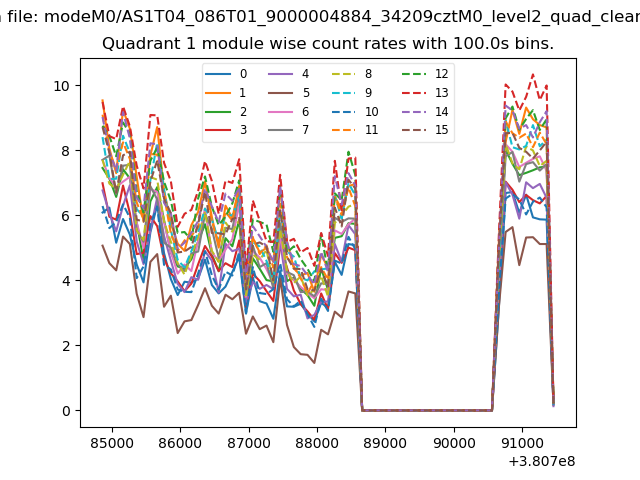
| Module-wise count rates for Quadrant A Data is divided into 100 sec bins |
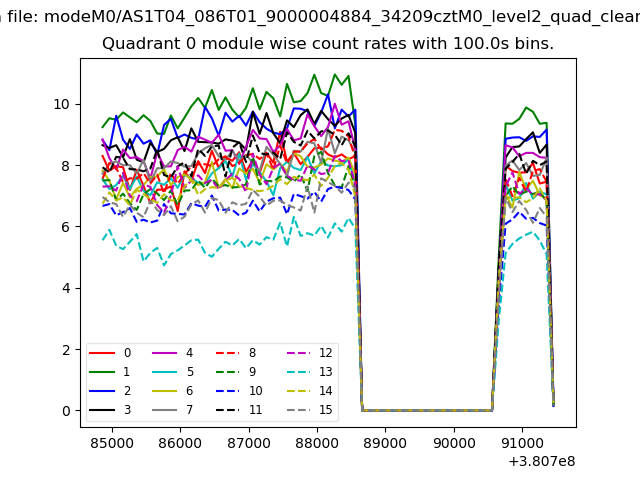 |
 |
| Module-wise count rates for Quadrant B Data is divided into 100 sec bins |
 |
 |
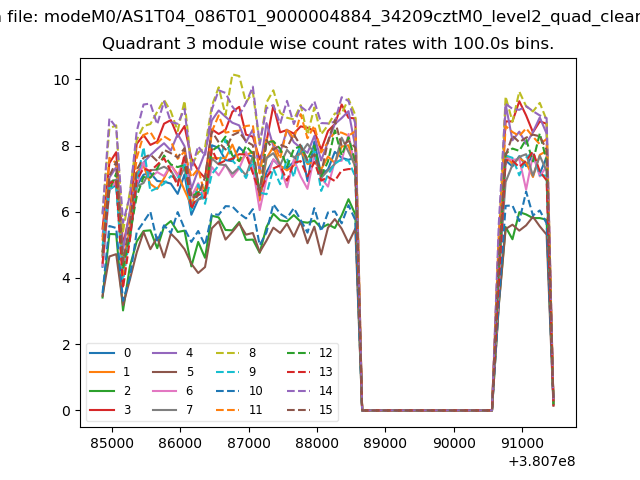
| Module-wise count rates for Quadrant C Data is divided into 100 sec bins |
 |
 |
| Module-wise count rates for Quadrant D Data is divided into 100 sec bins |
 |
 |
| Parameter | Plot |
|---|---|
| CZT HV Monitor | 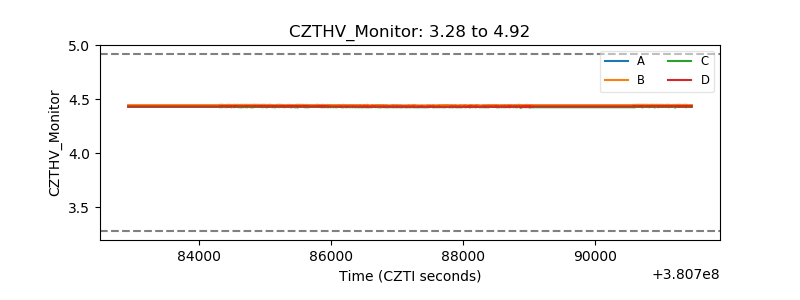 |
| D_VDD | 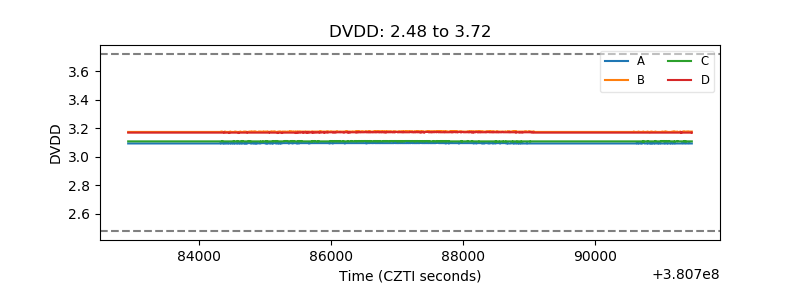 |
| Temperature 1 | 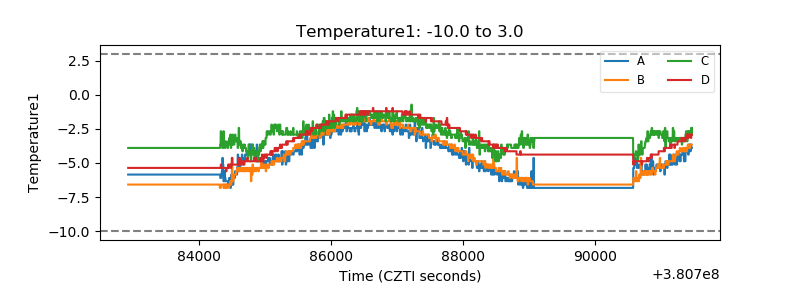 |
| Veto HV Monitor | 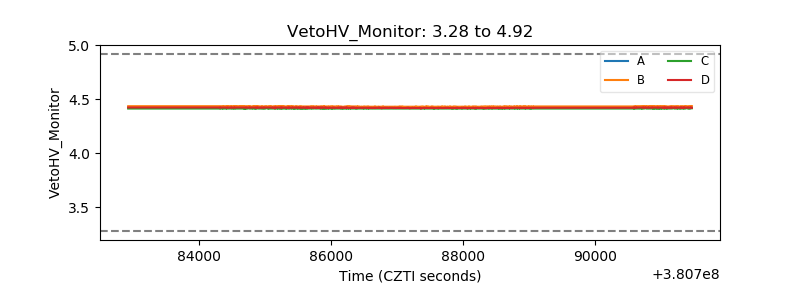 |
| Veto LLD | 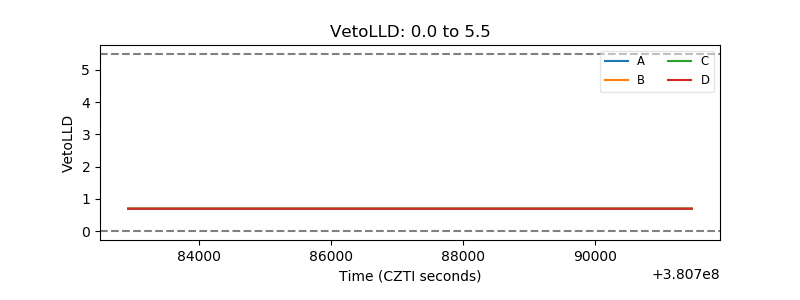 |
| Alpha Counter | 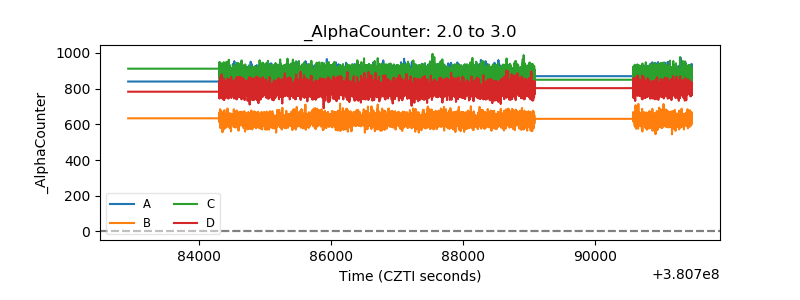 |
| _CPM_Rate | 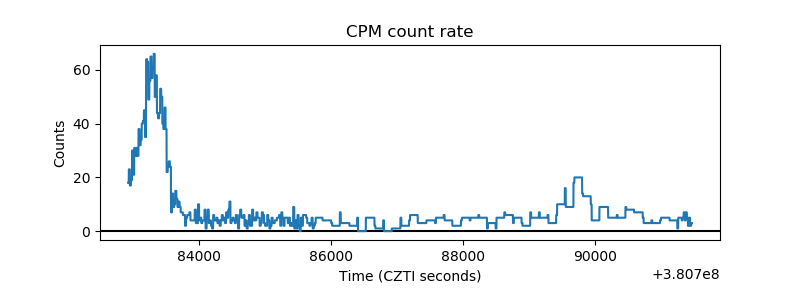 |
| CZT Counter | 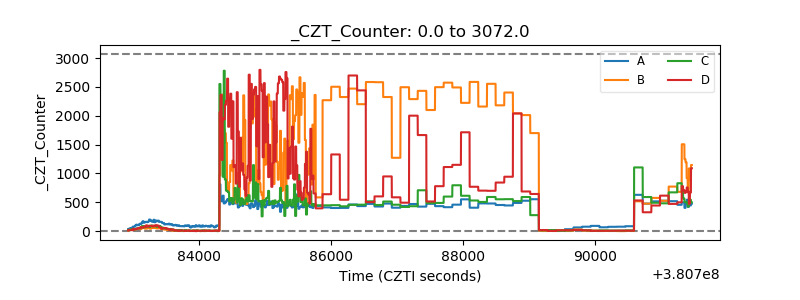 |
| +2.5 Volts monitor | 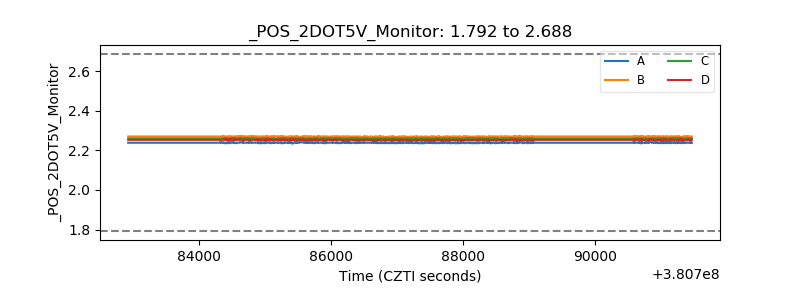 |
| +5 Volts monitor | 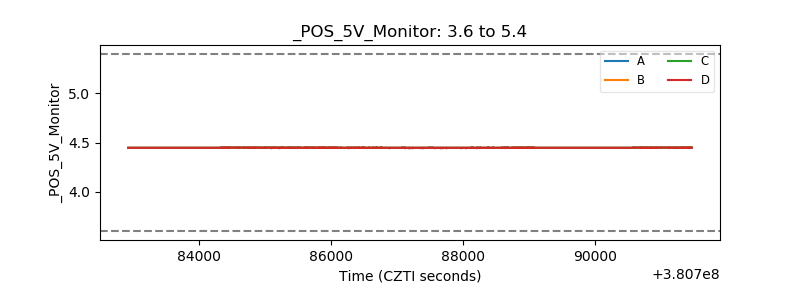 |
| _ROLL_ROT | 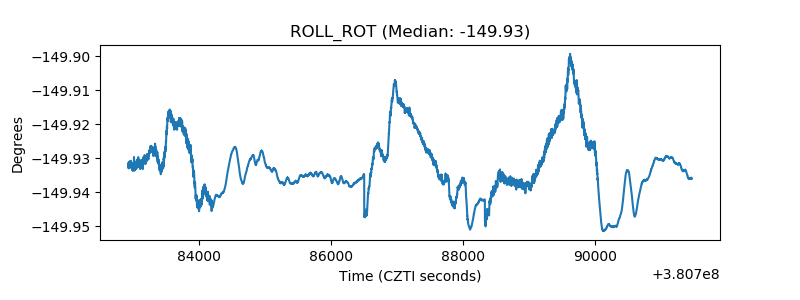 |
| _Roll_DEC | 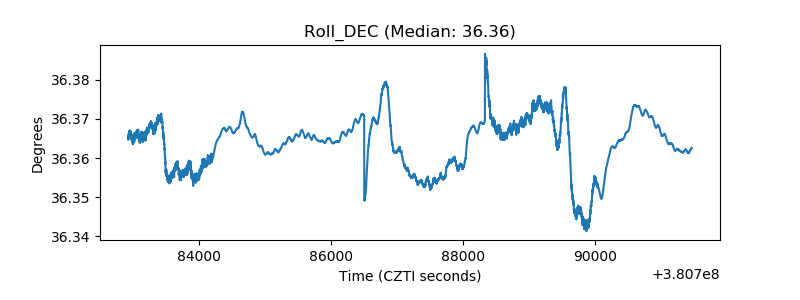 |
| _Roll_RA | 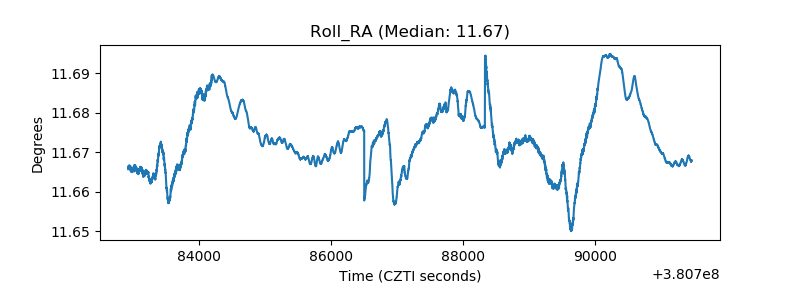 |
| Veto Counter | 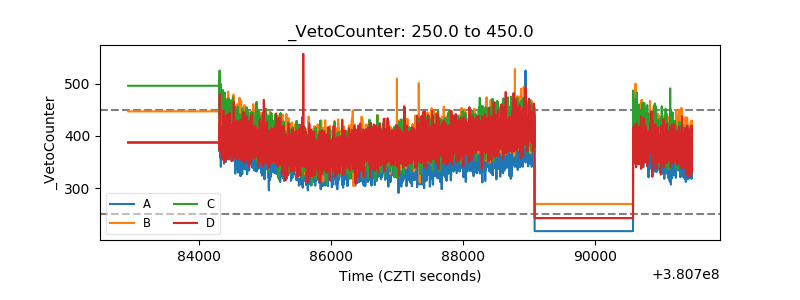 |