| Param | Original file | Final file |
|---|---|---|
| Filename | modeM0/AS1T04_086T01_9000004884_34207cztM0_level2.evt | modeM0/AS1T04_086T01_9000004884_34207cztM0_level2_quad_clean.evt |
| Size (bytes) | 707,855,040 | 57,049,920 |
| Size | 675.1 MB | 54.4 MB |
| Events in quadrant A | 2,455,654 | 377,261 |
| Events in quadrant B | 8,727,241 | 290,032 |
| Events in quadrant C | 2,794,798 | 389,669 |
| Events in quadrant D | 7,120,892 | 316,805 |
| Mode SS | |||
|---|---|---|---|
| Quadrant | BADHDUFLAG | Total packets | Discarded packets |
| A | 0 | 102 | 0 |
| B | 0 | 102 | 0 |
| C | 0 | 102 | 0 |
| D | 0 | 102 | 0 |
| Mode M9 | |||
|---|---|---|---|
| Quadrant | BADHDUFLAG | Total packets | Discarded packets |
| A | 0 | 34 | 0 |
| B | 0 | 34 | 0 |
| C | 0 | 34 | 0 |
| D | 0 | 35 | 0 |
| Mode M0 | |||
|---|---|---|---|
| Quadrant | BADHDUFLAG | Total packets | Discarded packets |
| A | 0 | 10340 | 3 |
| B | 0 | 29385 | 2 |
| C | 0 | 11023 | 2 |
| D | 0 | 24625 | 2 |
| Quadrant | Total seconds | Saturated seconds | Saturation percentage |
|---|---|---|---|
| A | 5027 | 6 | 0.119355% |
| B | 5027 | 2317 | 46.091108% |
| C | 5027 | 84 | 1.670977% |
| D | 5027 | 1223 | 24.328625% |
Noise dominated data is calculated using 1-second bins in cleaned event files. If a bin has >2000 counts, and if more than 50% of those come from <1% of pixels, then it is considered to be noise-dominated and hence unusable.
| Quadrant | # 1 sec bins | Bins with >0 counts | Bins with >2000 counts | High rate bins dominated by noise | Noise dominated (total time) | Noise dominated (detector-on time) | Marked lightcurve |
|---|---|---|---|---|---|---|---|
| A | 7089 | 5028 | 1 | 1 | 0.01% | 0.02% | 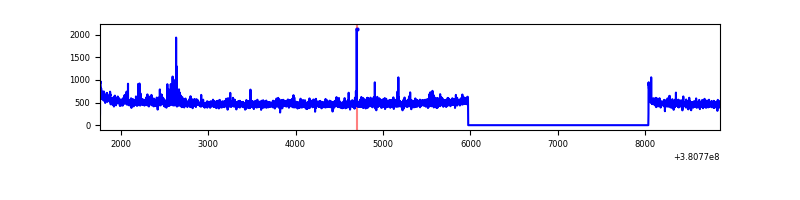 |
| B | 7089 | 5028 | 1903 | 1903 | 26.84% | 37.85% | 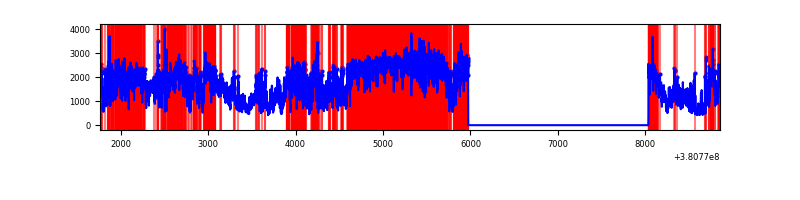 |
| C | 7089 | 5028 | 55 | 55 | 0.78% | 1.09% | 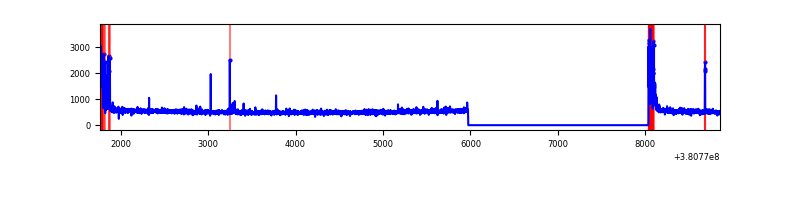 |
| D | 7089 | 5028 | 1107 | 1107 | 15.62% | 22.02% | 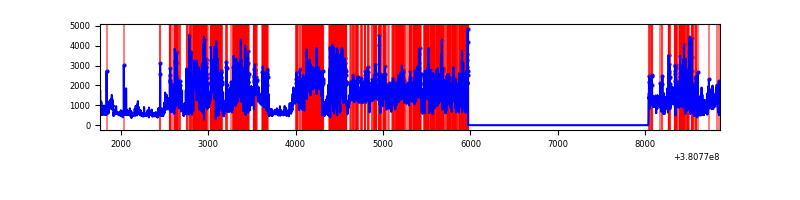 |
Top three noisy pixels from each quadrant. If the there are fewer than three noisy pixels in the level2.evt file, extra rows are filled as -1
| Pixel properties | Quadrant properties | ||||||
|---|---|---|---|---|---|---|---|
| Quadrant | DetID | PixID | Counts | Sigma | Mean | Median | Sigma |
| A | 15 | 169 | 63021 | 514.8 | 609 | 598 | 121.3 |
| A | 10 | 83 | 22270 | 178.73 | 609 | 598 | 121.3 |
| A | 13 | 254 | 9576 | 74.04 | 609 | 598 | 121.3 |
| B | 5 | 31 | 3878351 | 39142.47 | 517 | 506 | 99.1 |
| B | 5 | 15 | 1988111 | 20062.63 | 517 | 506 | 99.1 |
| B | 5 | 172 | 341694 | 3443.91 | 517 | 506 | 99.1 |
| C | 15 | 214 | 232962 | 1702.58 | 593 | 599 | 136.5 |
| C | 0 | 10 | 224387 | 1639.75 | 593 | 599 | 136.5 |
| C | 9 | 187 | 10635 | 73.54 | 593 | 599 | 136.5 |
| D | 10 | 118 | 1550509 | 11825.02 | 538 | 524 | 131.1 |
| D | 12 | 217 | 1120286 | 8542.8 | 538 | 524 | 131.1 |
| D | 8 | 195 | 1083337 | 8260.91 | 538 | 524 | 131.1 |
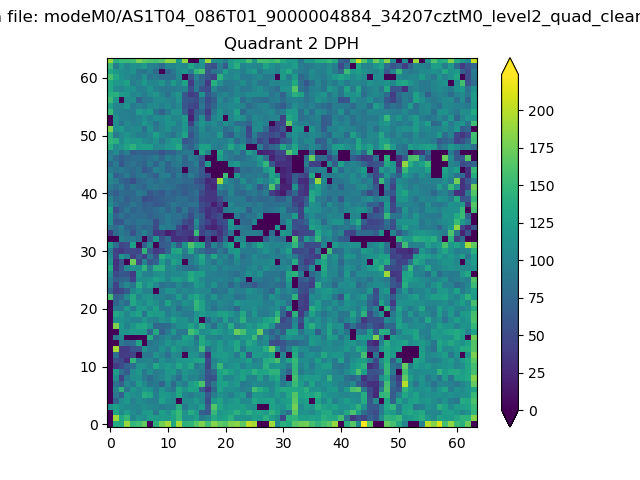
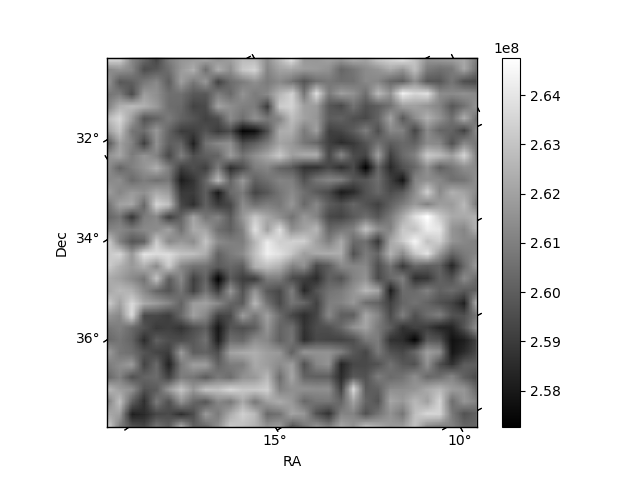
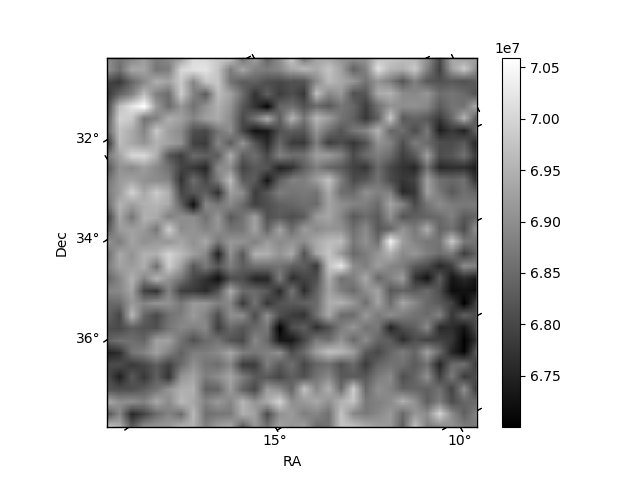
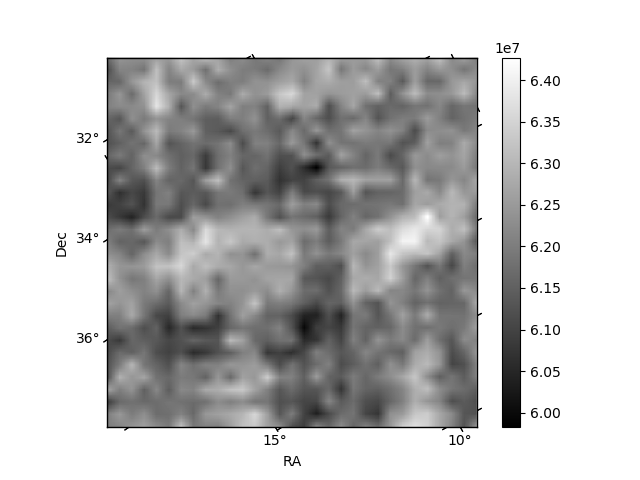
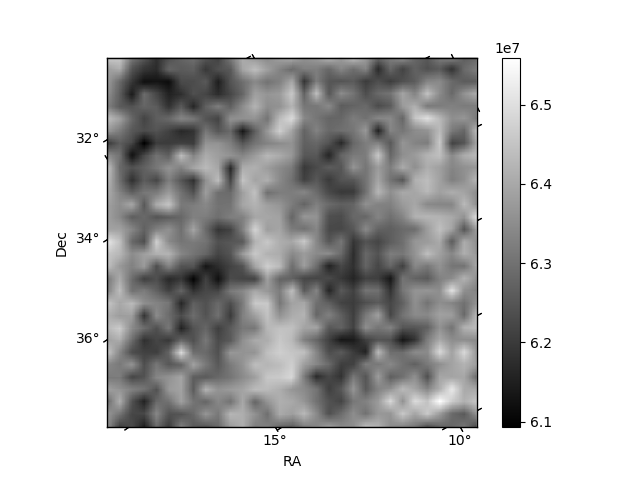
Histogram calculated using DETX and DETY for each event in the final _common_clean file
| Quadrant A | 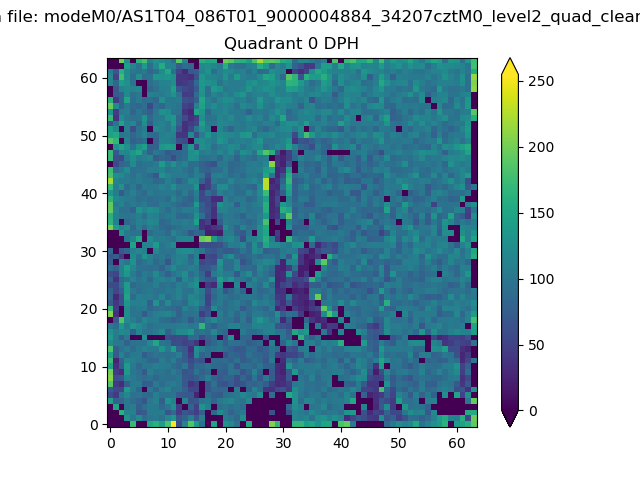 |
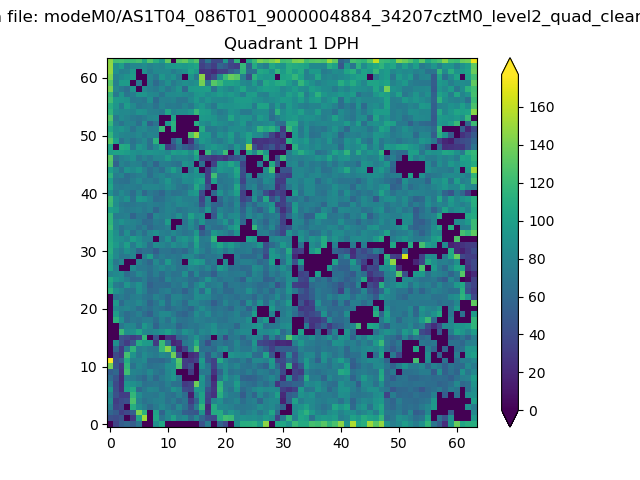 |
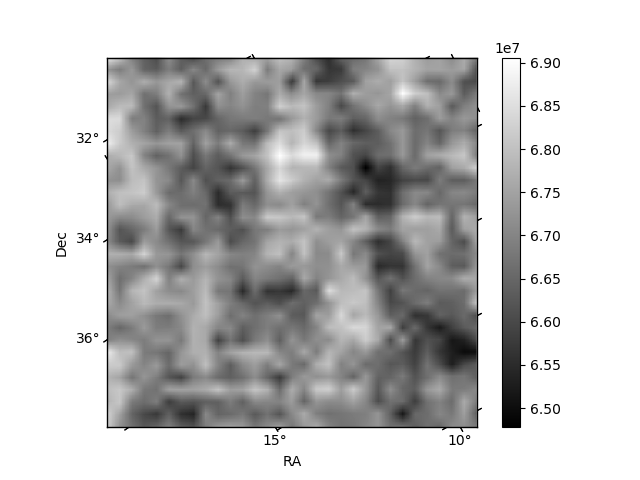
Quadrant B |
|---|---|---|---|
| Quadrant D | 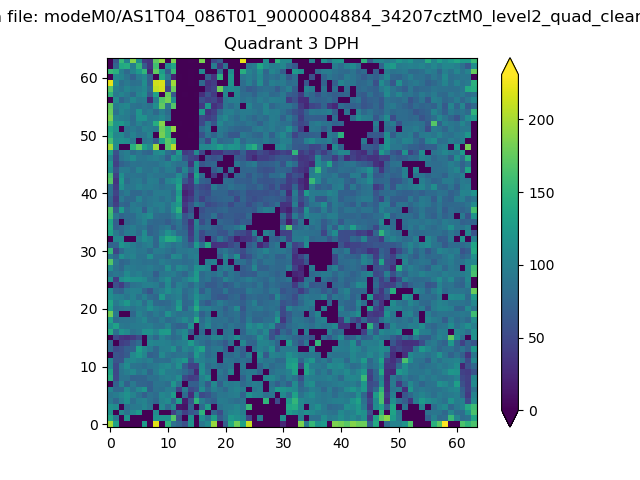 |
 |
Quadrant C |
| Plot type | Count rate plots | Images |
|---|---|---|
| Comparison with Poisson distribution Blue bars denote a histogram of data divided into 1 sec bins. Red curve is a Poisson curve with rate = median count rate of data. |
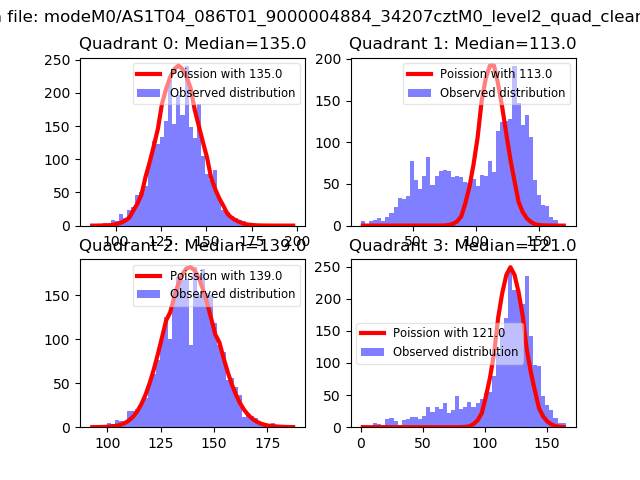 |
 |
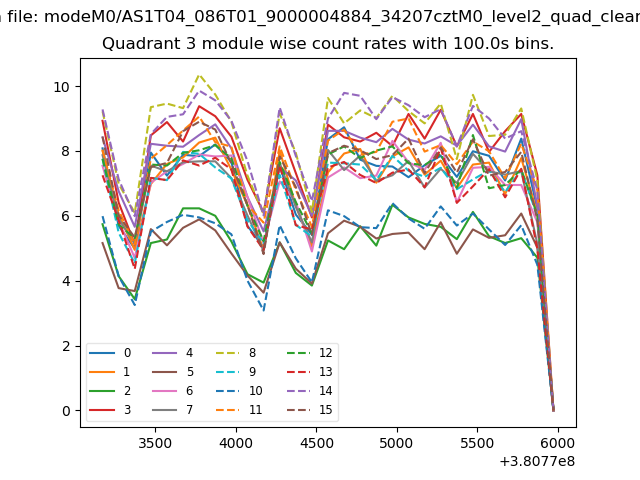
| Quadrant-wise count rates Data is divided into 100 sec bins |
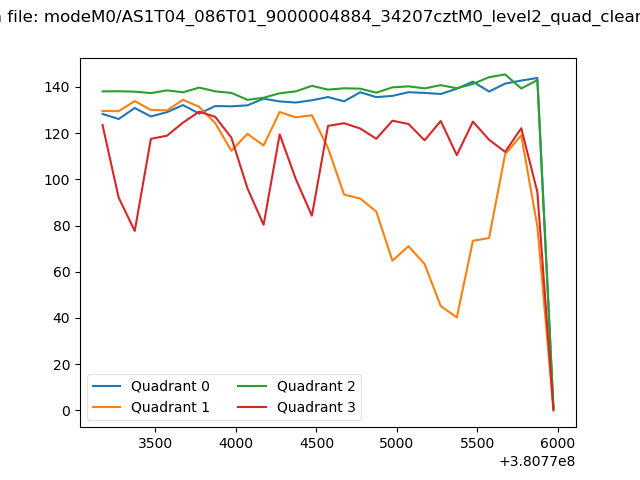 |
|
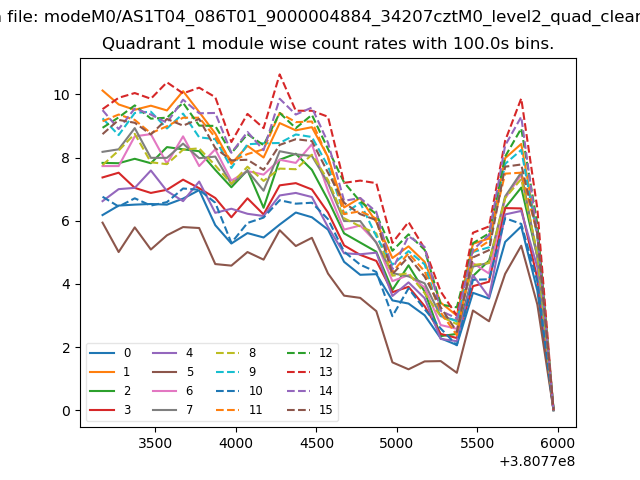
| Module-wise count rates for Quadrant A Data is divided into 100 sec bins |
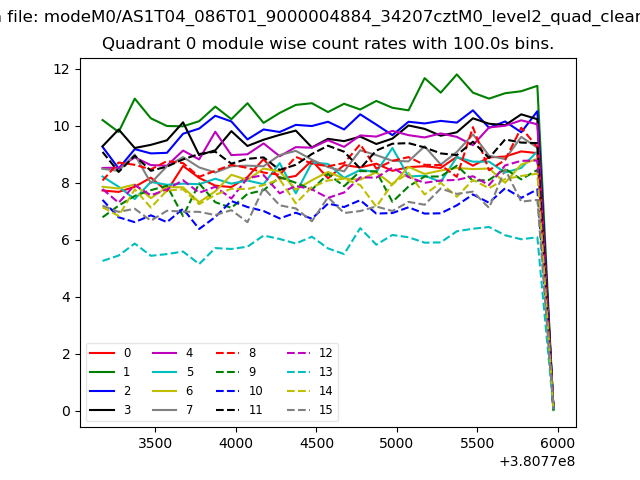 |
 |
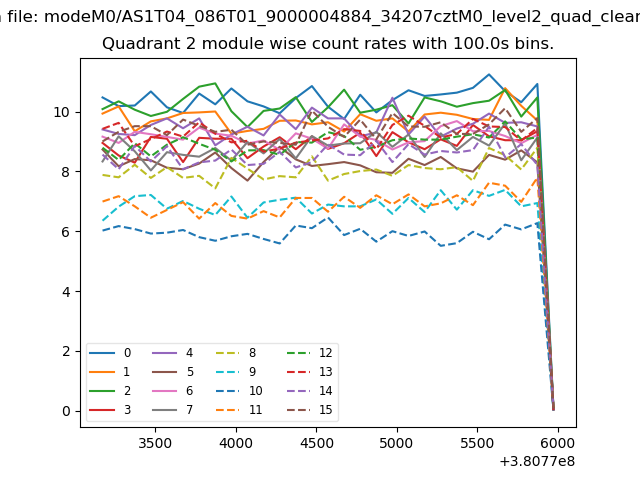
| Module-wise count rates for Quadrant B Data is divided into 100 sec bins |
 |
 |
| Module-wise count rates for Quadrant C Data is divided into 100 sec bins |
 |
 |
| Module-wise count rates for Quadrant D Data is divided into 100 sec bins |
 |
 |
| Parameter | Plot |
|---|---|
| CZT HV Monitor | 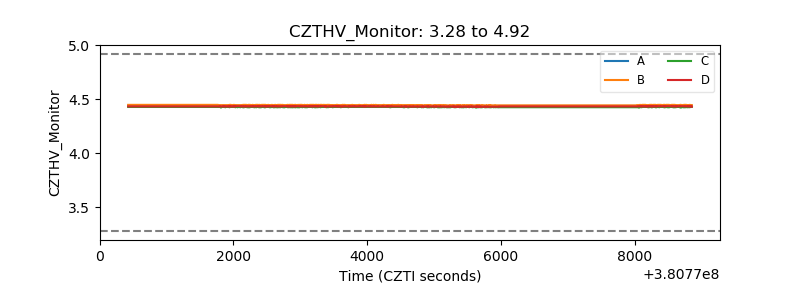 |
| D_VDD | 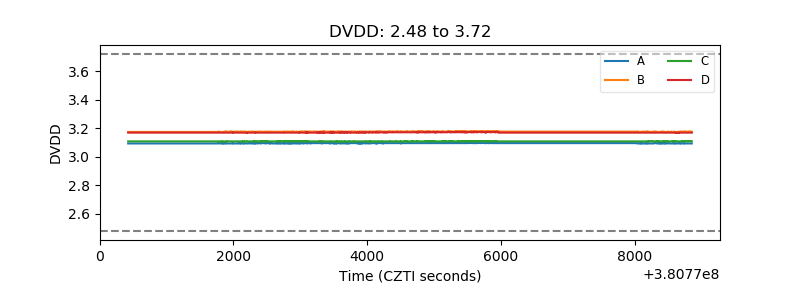 |
| Temperature 1 | 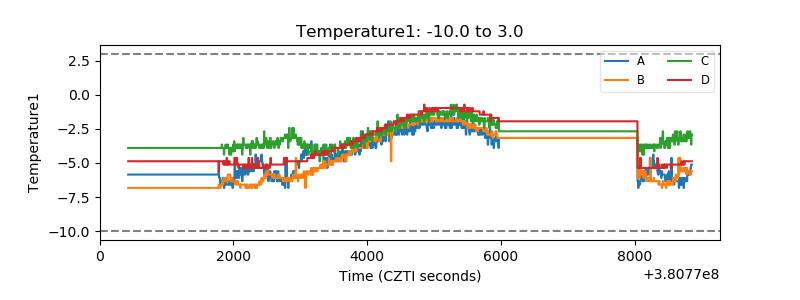 |
| Veto HV Monitor | 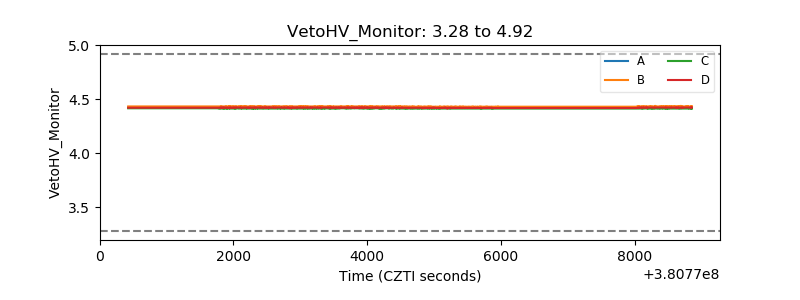 |
| Veto LLD | 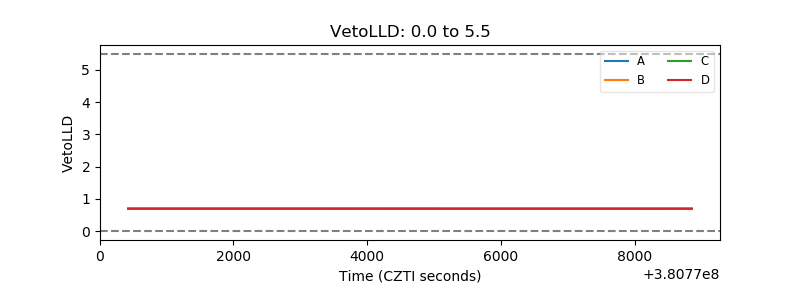 |
| Alpha Counter | 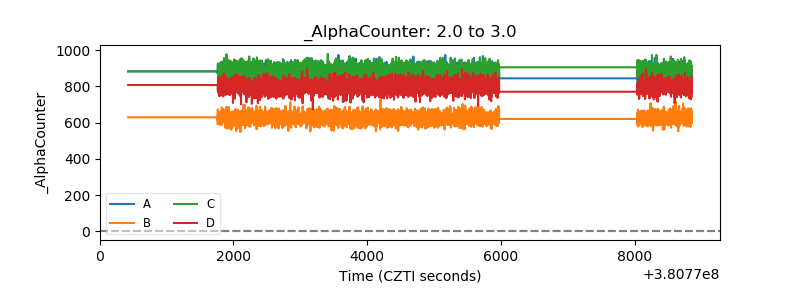 |
| _CPM_Rate | 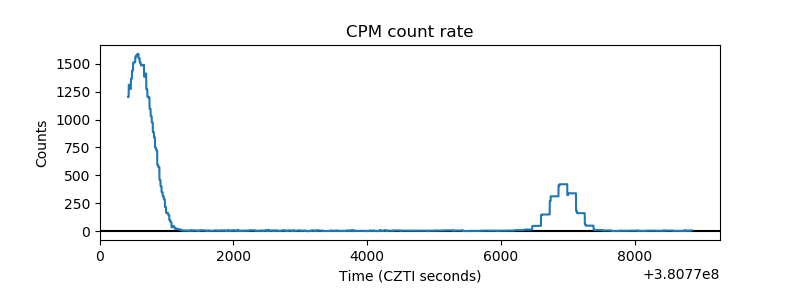 |
| CZT Counter | 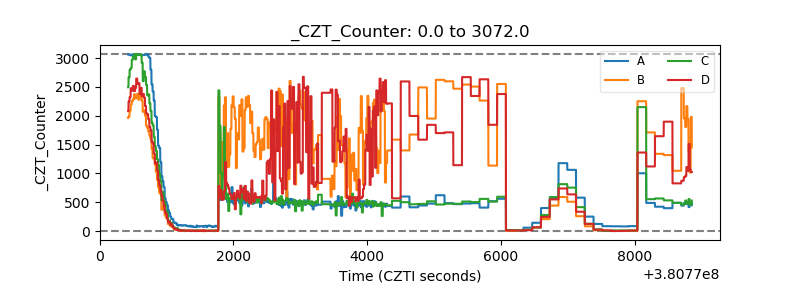 |
| +2.5 Volts monitor | 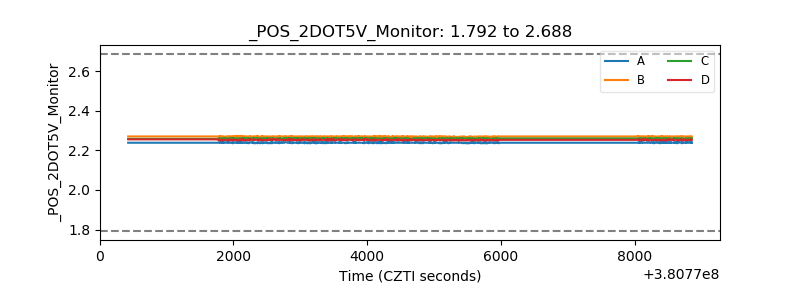 |
| +5 Volts monitor | 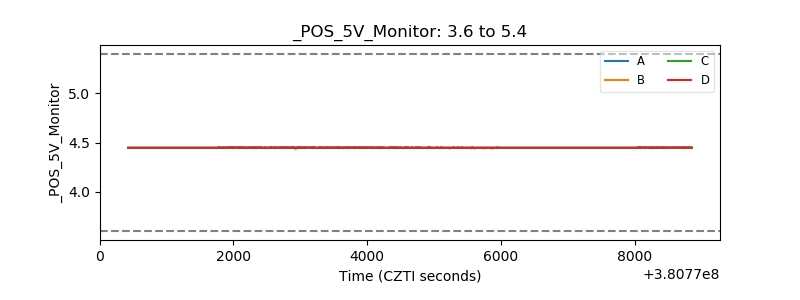 |
| _ROLL_ROT | 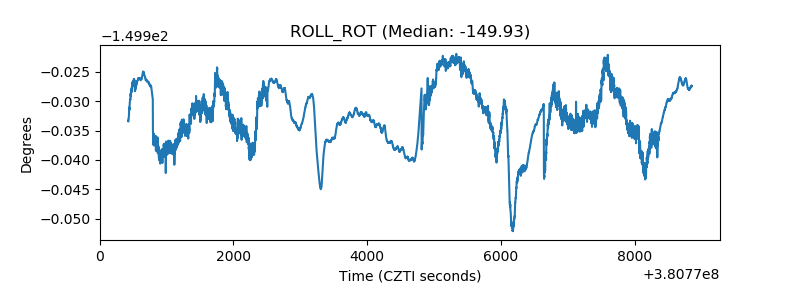 |
| _Roll_DEC | 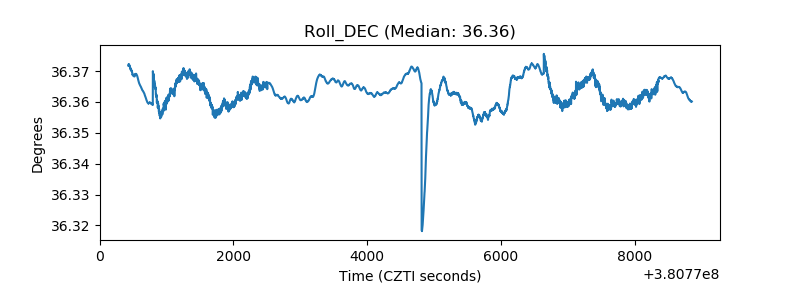 |
| _Roll_RA | 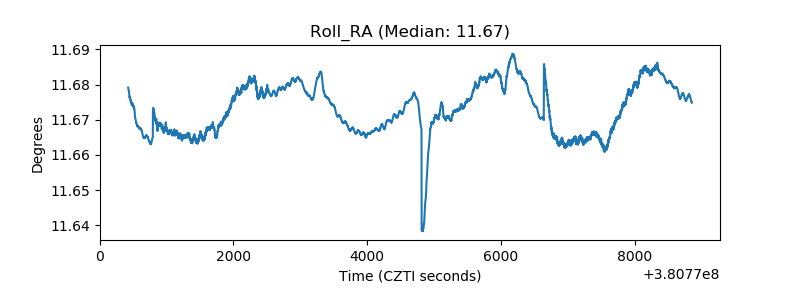 |
| Veto Counter | 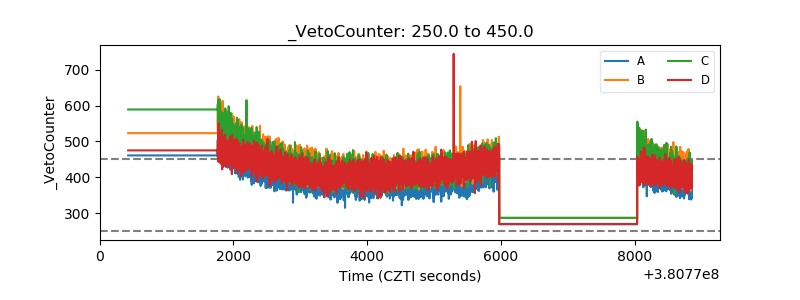 |