| Param | Original file | Final file |
|---|---|---|
| Filename | modeM0/AS1T04_086T01_9000004884_34205cztM0_level2.evt | modeM0/AS1T04_086T01_9000004884_34205cztM0_level2_quad_clean.evt |
| Size (bytes) | 463,199,040 | 39,911,040 |
| Size | 441.7 MB | 38.1 MB |
| Events in quadrant A | 1,754,032 | 266,536 |
| Events in quadrant B | 5,777,999 | 180,025 |
| Events in quadrant C | 2,024,759 | 278,074 |
| Events in quadrant D | 4,240,172 | 241,297 |
| Mode SS | |||
|---|---|---|---|
| Quadrant | BADHDUFLAG | Total packets | Discarded packets |
| A | 0 | 70 | 0 |
| B | 0 | 70 | 0 |
| C | 0 | 70 | 0 |
| D | 0 | 70 | 0 |
| Mode M9 | |||
|---|---|---|---|
| Quadrant | BADHDUFLAG | Total packets | Discarded packets |
| A | 0 | 21 | 0 |
| B | 0 | 21 | 0 |
| C | 0 | 21 | 0 |
| D | 0 | 21 | 0 |
| Mode M0 | |||
|---|---|---|---|
| Quadrant | BADHDUFLAG | Total packets | Discarded packets |
| A | 0 | 7195 | 2 |
| B | 0 | 19465 | 1 |
| C | 0 | 7834 | 1 |
| D | 0 | 15029 | 1 |
| Quadrant | Total seconds | Saturated seconds | Saturation percentage |
|---|---|---|---|
| A | 3403 | 7 | 0.205701% |
| B | 3403 | 1878 | 55.186600% |
| C | 3403 | 50 | 1.469292% |
| D | 3403 | 382 | 11.225389% |
Noise dominated data is calculated using 1-second bins in cleaned event files. If a bin has >2000 counts, and if more than 50% of those come from <1% of pixels, then it is considered to be noise-dominated and hence unusable.
| Quadrant | # 1 sec bins | Bins with >0 counts | Bins with >2000 counts | High rate bins dominated by noise | Noise dominated (total time) | Noise dominated (detector-on time) | Marked lightcurve |
|---|---|---|---|---|---|---|---|
| A | 5495 | 3404 | 2 | 2 | 0.04% | 0.06% | 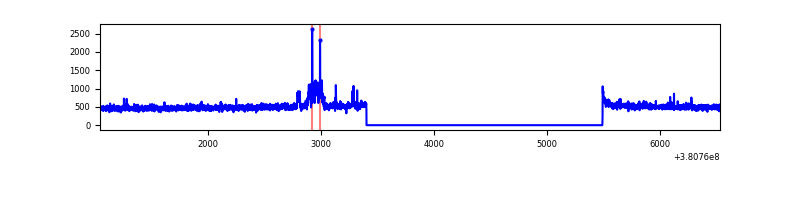 |
| B | 5495 | 3404 | 1672 | 1672 | 30.43% | 49.12% | 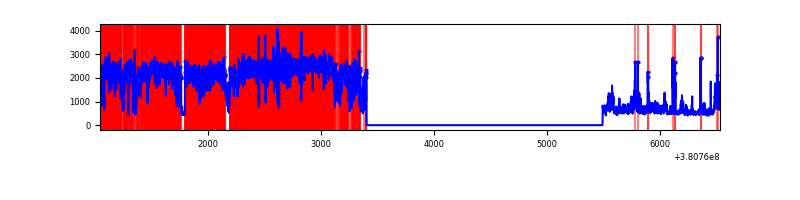 |
| C | 5495 | 3404 | 33 | 33 | 0.60% | 0.97% | 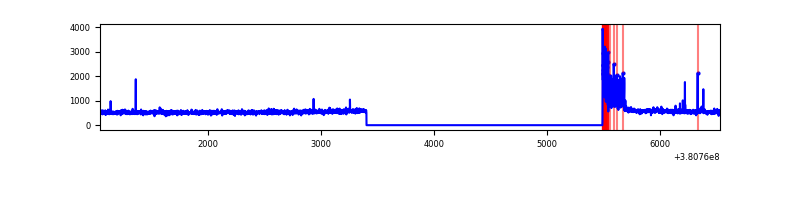 |
| D | 5495 | 3404 | 352 | 352 | 6.41% | 10.34% | 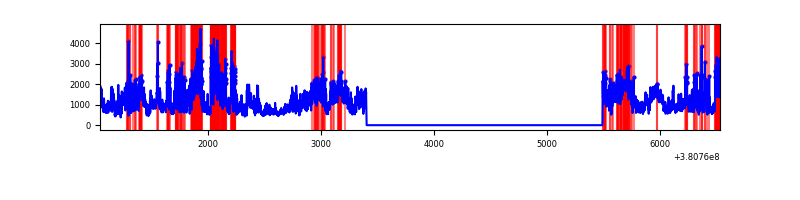 |
Top three noisy pixels from each quadrant. If the there are fewer than three noisy pixels in the level2.evt file, extra rows are filled as -1
| Pixel properties | Quadrant properties | ||||||
|---|---|---|---|---|---|---|---|
| Quadrant | DetID | PixID | Counts | Sigma | Mean | Median | Sigma |
| A | 15 | 169 | 67832 | 786.94 | 428 | 420 | 85.7 |
| A | 9 | 143 | 11882 | 133.8 | 428 | 420 | 85.7 |
| A | 10 | 83 | 11361 | 127.72 | 428 | 420 | 85.7 |
| B | 5 | 31 | 2313810 | 34924.05 | 348 | 340 | 66.2 |
| B | 5 | 15 | 1430800 | 21594.16 | 348 | 340 | 66.2 |
| B | 5 | 172 | 254580 | 3838.0 | 348 | 340 | 66.2 |
| C | 0 | 10 | 205374 | 2122.79 | 418 | 422 | 96.5 |
| C | 15 | 214 | 154379 | 1594.61 | 418 | 422 | 96.5 |
| C | 15 | 159 | 14162 | 142.31 | 418 | 422 | 96.5 |
| D | 12 | 217 | 1119767 | 11287.09 | 403 | 392 | 99.2 |
| D | 2 | 250 | 816422 | 8228.34 | 403 | 392 | 99.2 |
| D | 8 | 195 | 522662 | 5266.25 | 403 | 392 | 99.2 |
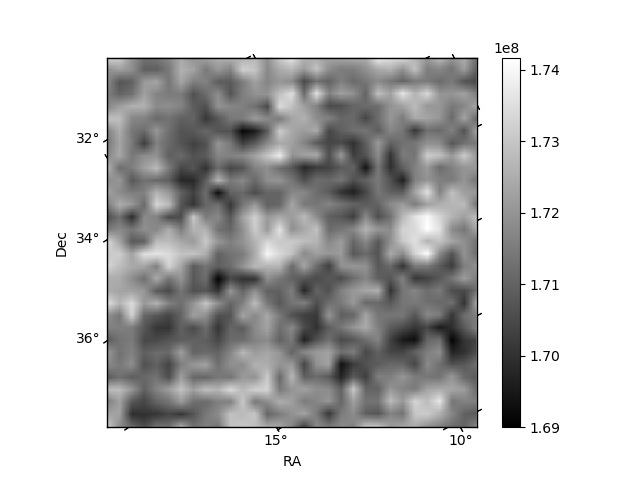
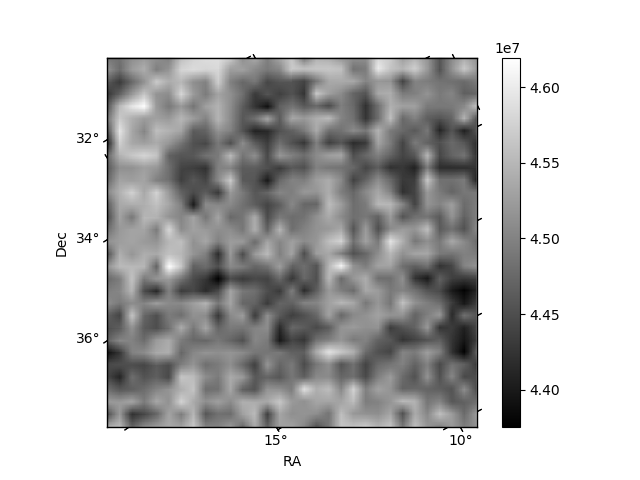
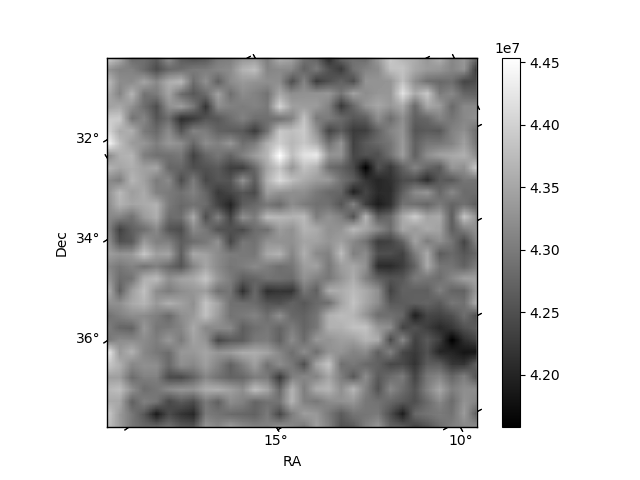
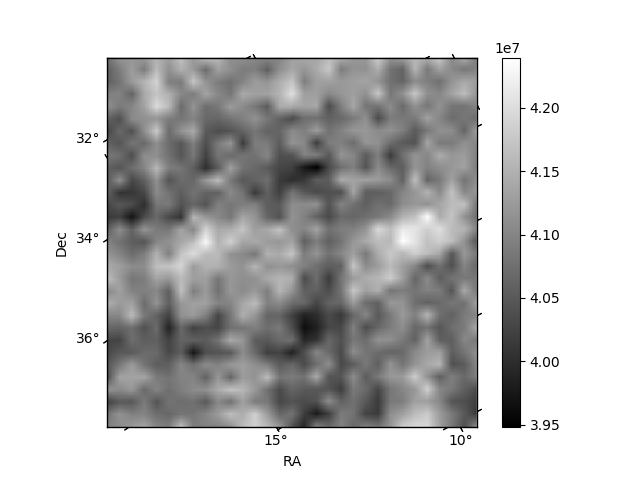
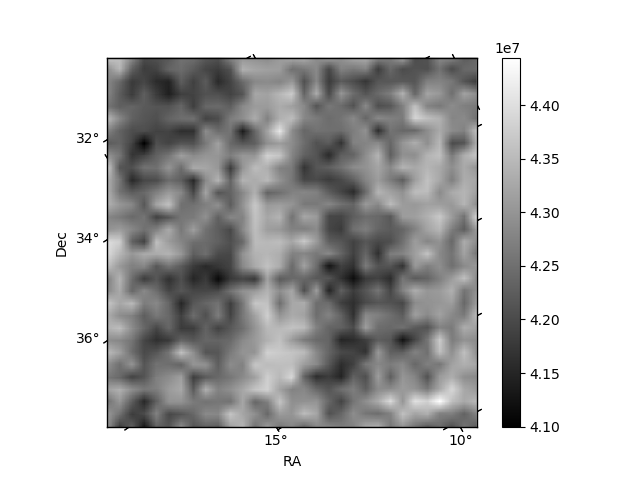
Histogram calculated using DETX and DETY for each event in the final _common_clean file
| Quadrant A | 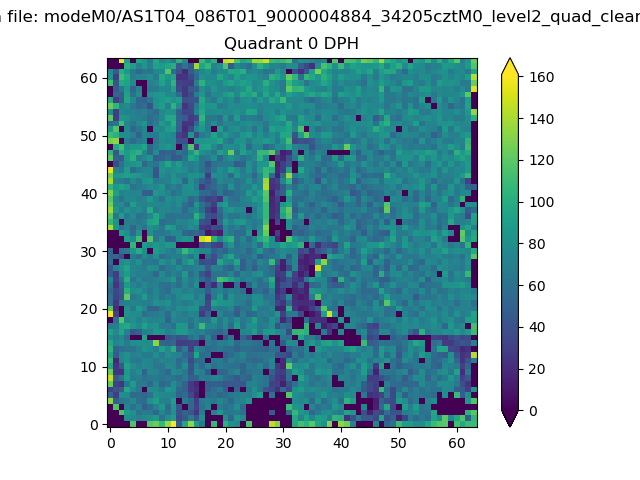 |
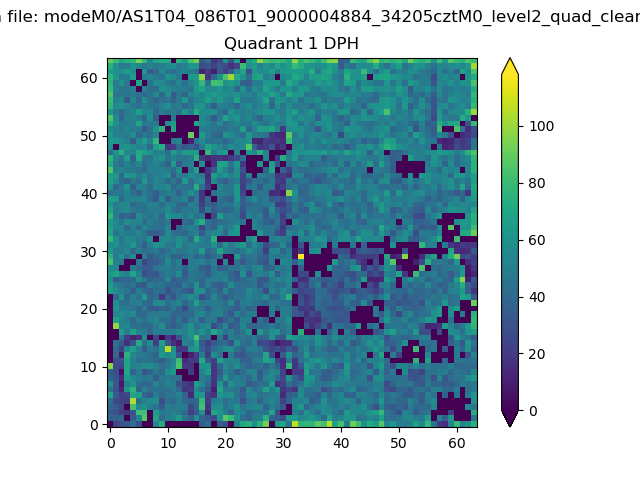 |
Quadrant B |
|---|---|---|---|
| Quadrant D | 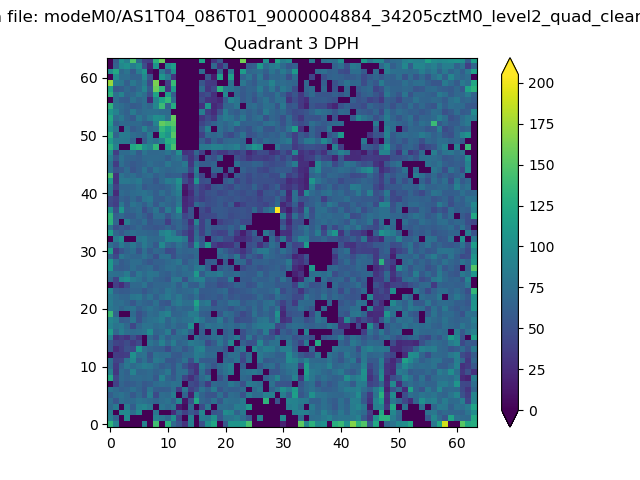 |
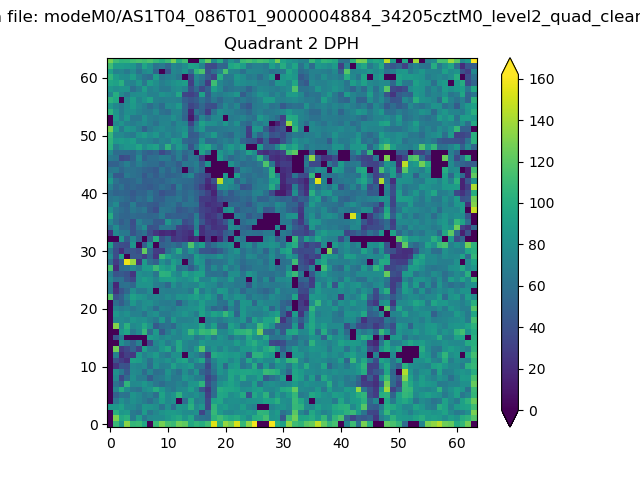 |
Quadrant C |
| Plot type | Count rate plots | Images |
|---|---|---|
| Comparison with Poisson distribution Blue bars denote a histogram of data divided into 1 sec bins. Red curve is a Poisson curve with rate = median count rate of data. |
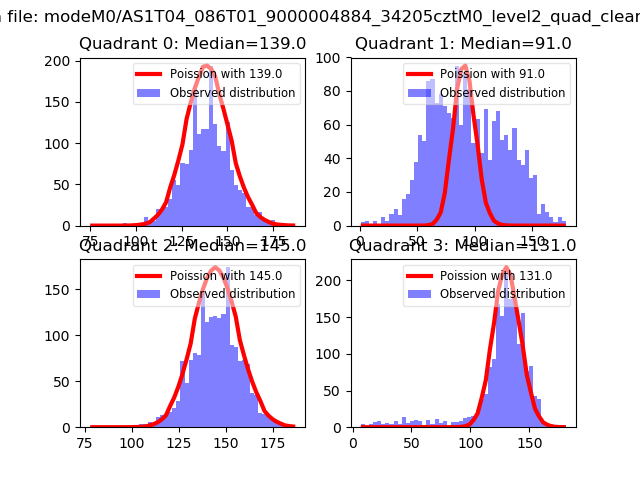 |
 |
| Quadrant-wise count rates Data is divided into 100 sec bins |
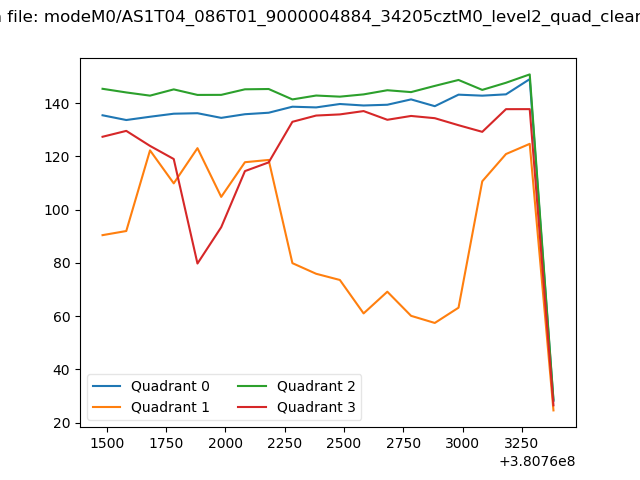 |
|
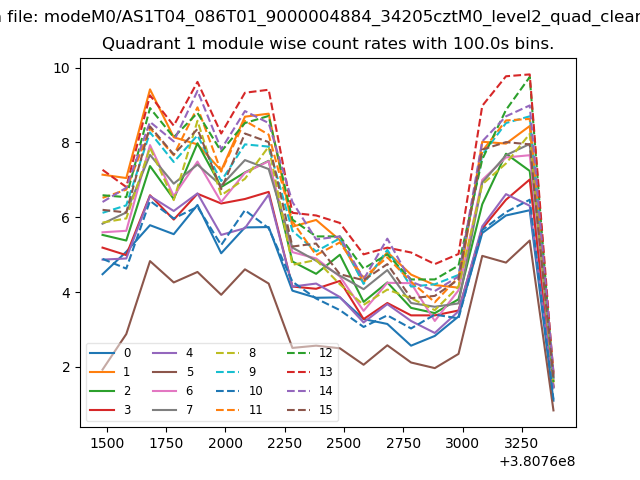
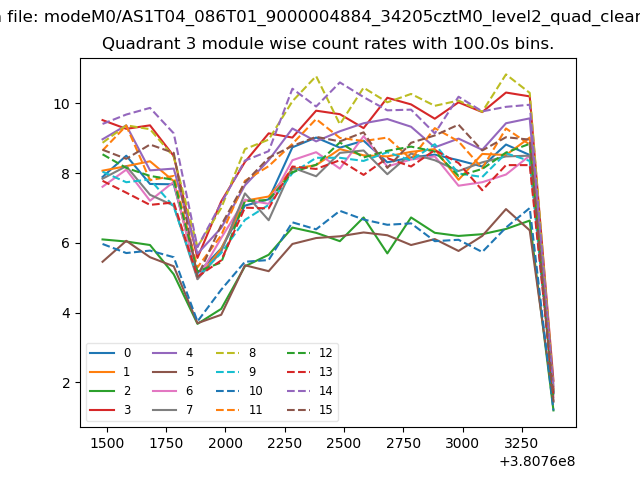
| Module-wise count rates for Quadrant A Data is divided into 100 sec bins |
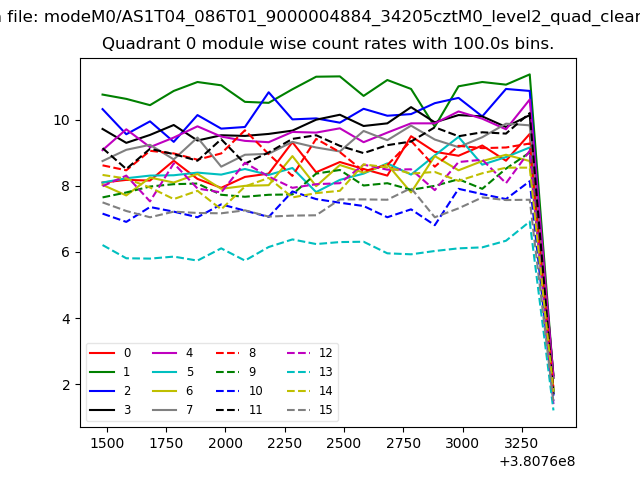 |
 |
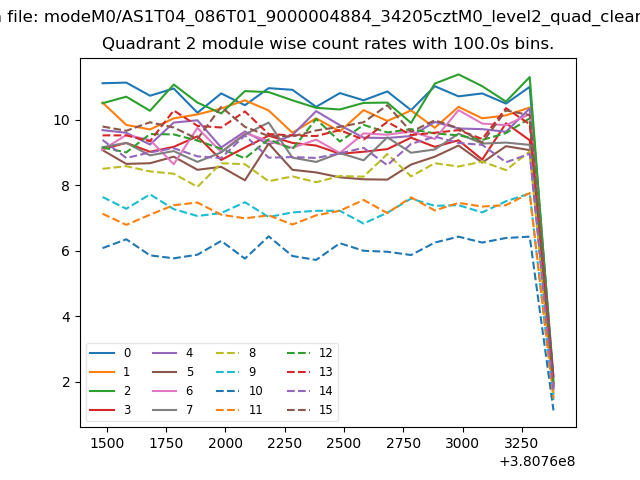
| Module-wise count rates for Quadrant B Data is divided into 100 sec bins |
 |
 |
| Module-wise count rates for Quadrant C Data is divided into 100 sec bins |
 |
 |
| Module-wise count rates for Quadrant D Data is divided into 100 sec bins |
 |
 |
| Parameter | Plot |
|---|---|
| CZT HV Monitor | 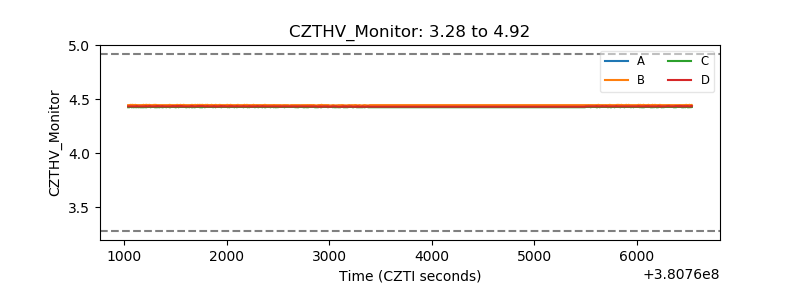 |
| D_VDD | 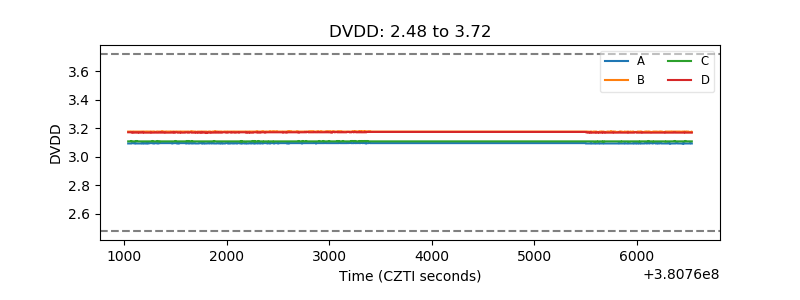 |
| Temperature 1 | 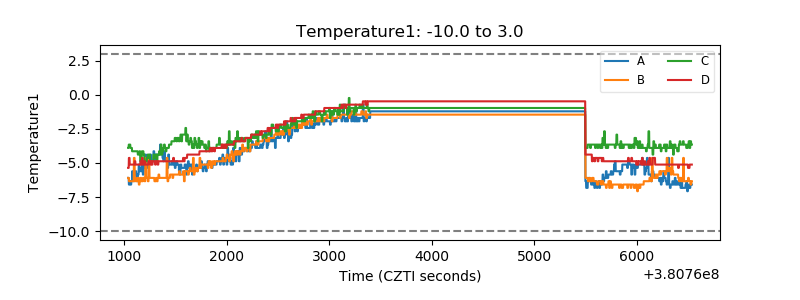 |
| Veto HV Monitor |  |
| Veto LLD |  |
| Alpha Counter | 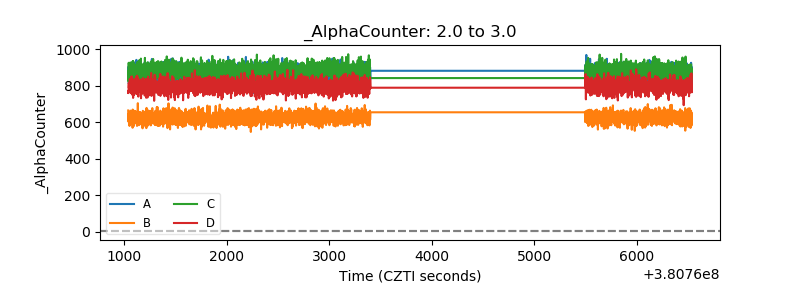 |
| _CPM_Rate | 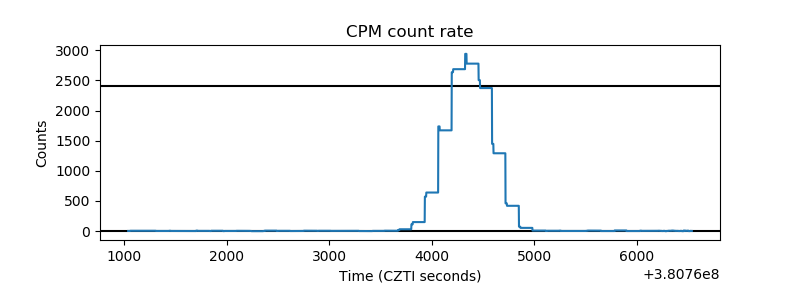 |
| CZT Counter | 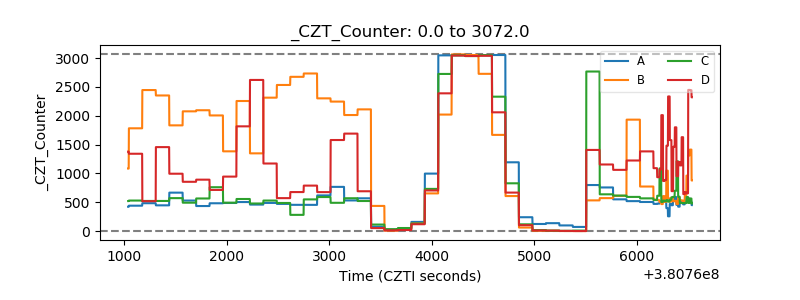 |
| +2.5 Volts monitor | 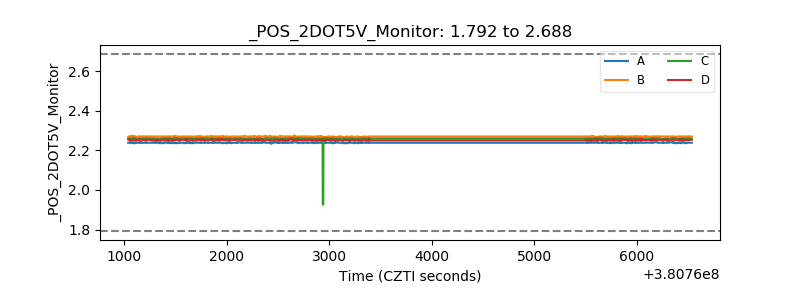 |
| +5 Volts monitor | 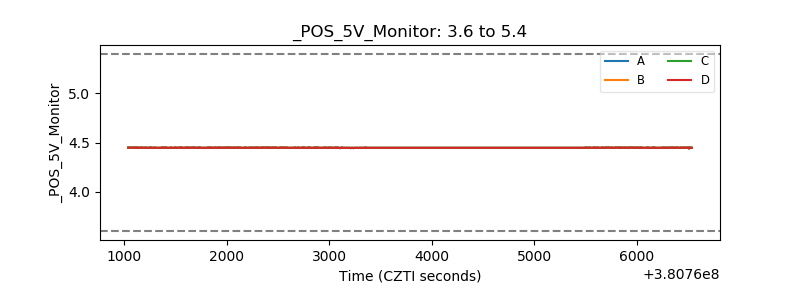 |
| _ROLL_ROT | 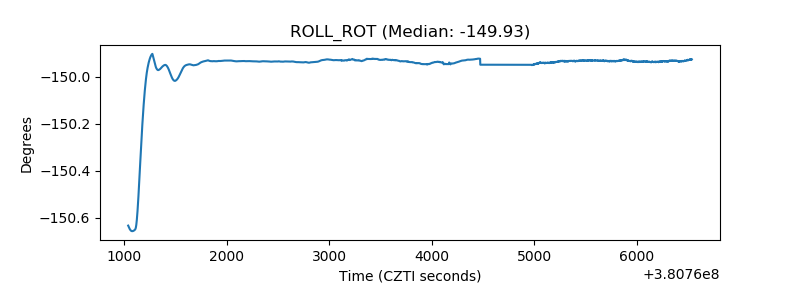 |
| _Roll_DEC | 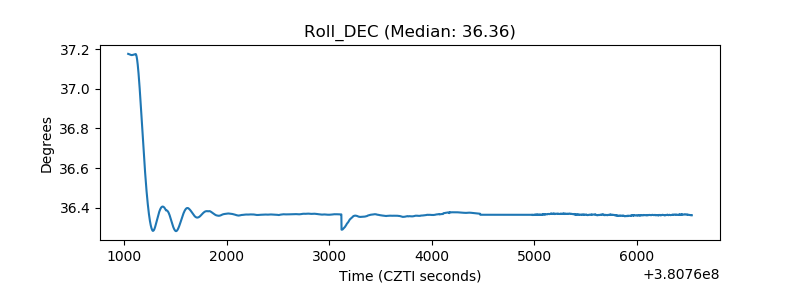 |
| _Roll_RA | 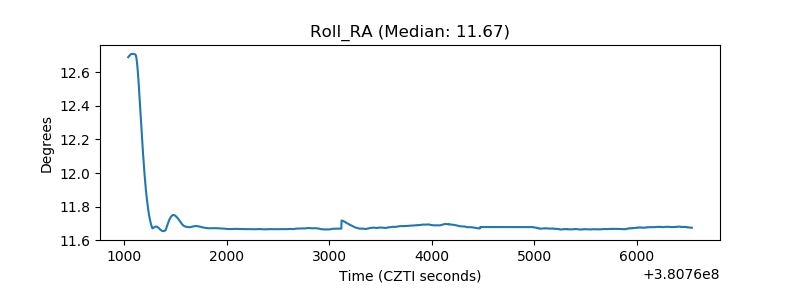 |
| Veto Counter | 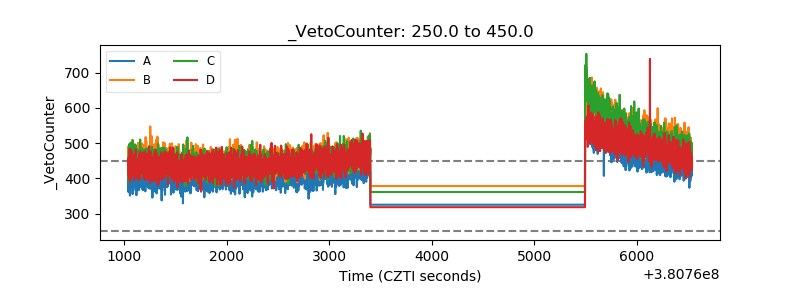 |