| Param | Original file | Final file |
|---|---|---|
| Filename | modeM0/AS1T04_086T01_9000004884cztM0_level2_bc.evt | modeM0/AS1T04_086T01_9000004884cztM0_level2_quad_clean.evt |
| Size (bytes) | 4,662,014,400 | 817,643,520 |
| Size | 4.3 GB | 779.8 MB |
| Events in quadrant A | 14,577,832 | 5,318,248 |
| Events in quadrant B | 51,963,498 | 4,704,075 |
| Events in quadrant C | 22,935,882 | 5,319,629 |
| Events in quadrant D | 47,170,875 | 4,825,215 |
| Mode SS | |||
|---|---|---|---|
| Quadrant | BADHDUFLAG | Total packets | Discarded packets |
| A | 0 | 1364 | 0 |
| B | 0 | 1364 | 0 |
| C | 0 | 1364 | 0 |
| D | 0 | 1364 | 0 |
| Mode M9 | |||
|---|---|---|---|
| Quadrant | BADHDUFLAG | Total packets | Discarded packets |
| A | 0 | 267 | 0 |
| B | 0 | 267 | 0 |
| C | 0 | 267 | 0 |
| D | 0 | 267 | 0 |
| Mode M0 | |||
|---|---|---|---|
| Quadrant | BADHDUFLAG | Total packets | Discarded packets |
| A | 0 | 137177 | 0 |
| B | 0 | 280252 | 0 |
| C | 0 | 163309 | 0 |
| D | 0 | 256835 | 0 |
| Quadrant | Total seconds | Saturated seconds | Saturation percentage |
|---|---|---|---|
| A | 66964 | 115 | 0.171734% |
| B | 66964 | 16316 | 24.365331% |
| C | 66964 | 2056 | 3.070306% |
| D | 66964 | 7451 | 11.126874% |
Noise dominated data is calculated using 1-second bins in cleaned event files. If a bin has >2000 counts, and if more than 50% of those come from <1% of pixels, then it is considered to be noise-dominated and hence unusable.
| Quadrant | # 1 sec bins | Bins with >0 counts | Bins with >2000 counts | High rate bins dominated by noise | Noise dominated (total time) | Noise dominated (detector-on time) | Marked lightcurve |
|---|---|---|---|---|---|---|---|
| A | 93460 | 66974 | 5 | 5 | 0.01% | 0.01% | 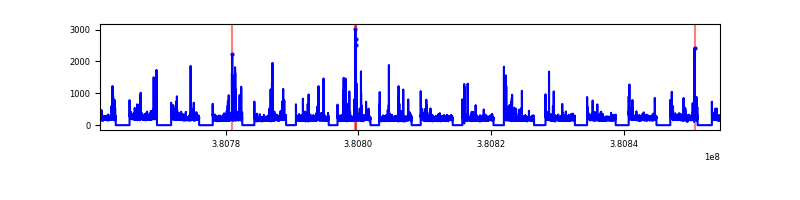 |
| B | 93460 | 66963 | 2233 | 2233 | 2.39% | 3.33% | 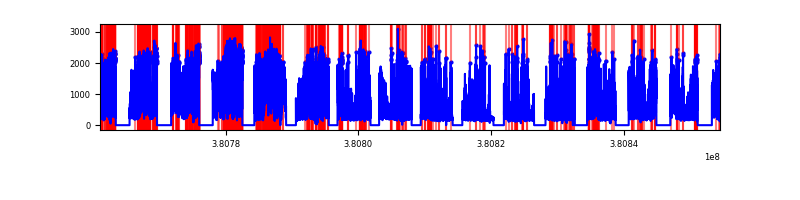 |
| C | 93460 | 66964 | 317 | 317 | 0.34% | 0.47% | 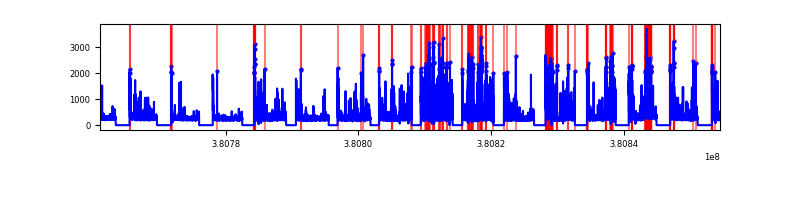 |
| D | 93460 | 66960 | 692 | 692 | 0.74% | 1.03% | 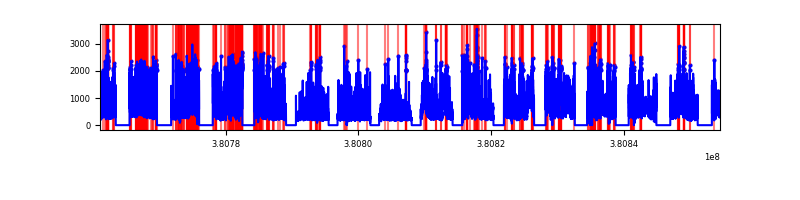 |
Top three noisy pixels from each quadrant. If the there are fewer than three noisy pixels in the level2.evt file, extra rows are filled as -1
| Pixel properties | Quadrant properties | ||||||
|---|---|---|---|---|---|---|---|
| Quadrant | DetID | PixID | Counts | Sigma | Mean | Median | Sigma |
| A | 15 | 169 | 308708 | 399.76 | 3503 | 3443 | 763.6 |
| A | 9 | 143 | 302815 | 392.05 | 3503 | 3443 | 763.6 |
| A | 10 | 83 | 177240 | 227.6 | 3503 | 3443 | 763.6 |
| B | 5 | 31 | 21539819 | 33781.55 | 3224 | 3156 | 637.5 |
| B | 5 | 15 | 8284171 | 12989.27 | 3224 | 3156 | 637.5 |
| B | 5 | 172 | 7060826 | 11070.38 | 3224 | 3156 | 637.5 |
| C | 4 | 254 | 2930647 | 3721.28 | 3472 | 3461 | 786.6 |
| C | 15 | 214 | 2791276 | 3544.1 | 3472 | 3461 | 786.6 |
| C | 0 | 10 | 1263651 | 1602.06 | 3472 | 3461 | 786.6 |
| D | 8 | 195 | 11122203 | 13758.95 | 3362 | 3270 | 808.1 |
| D | 10 | 118 | 7014906 | 8676.44 | 3362 | 3270 | 808.1 |
| D | 2 | 250 | 5969065 | 7382.28 | 3362 | 3270 | 808.1 |
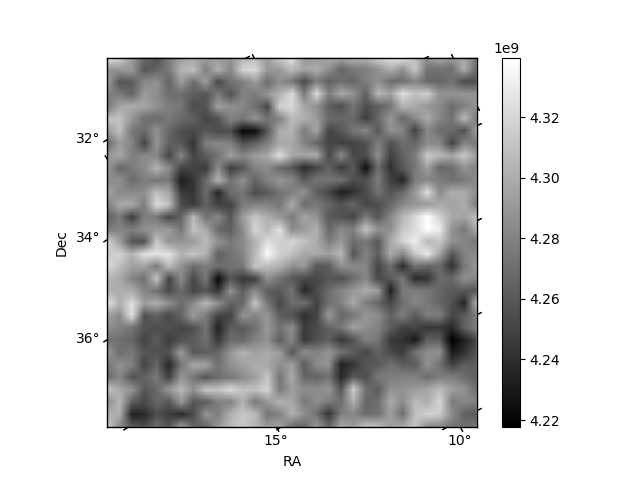
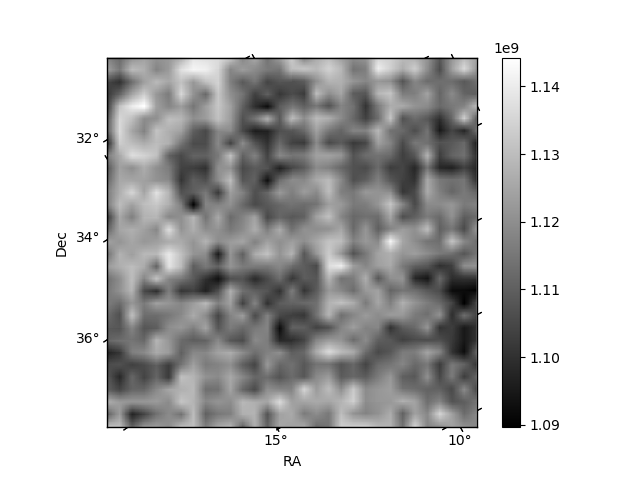
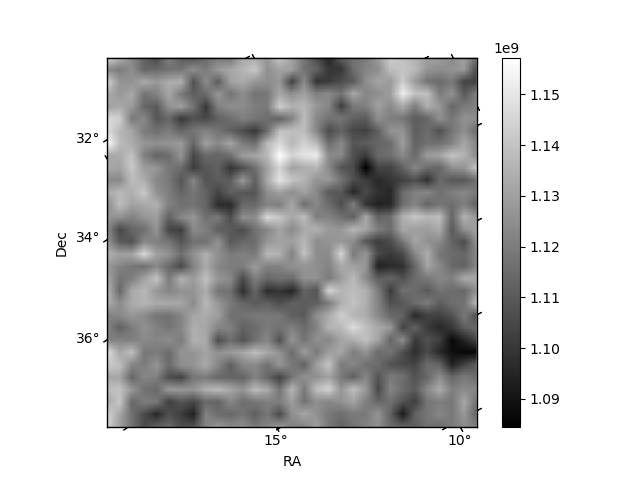
Histogram calculated using DETX and DETY for each event in the final _common_clean file
| Quadrant A | 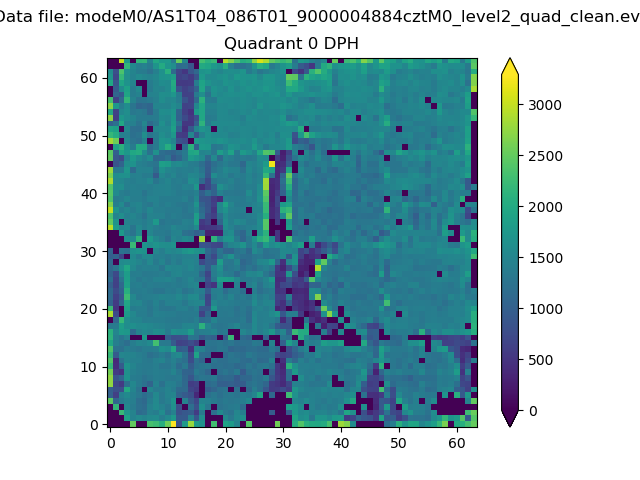 |
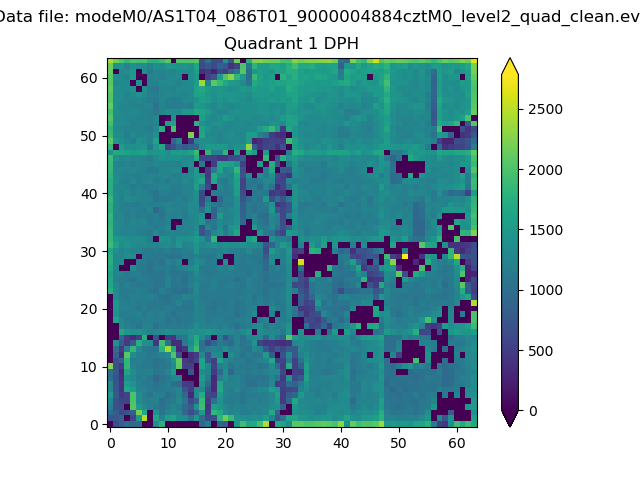 |
Quadrant B |
|---|---|---|---|
| Quadrant D | 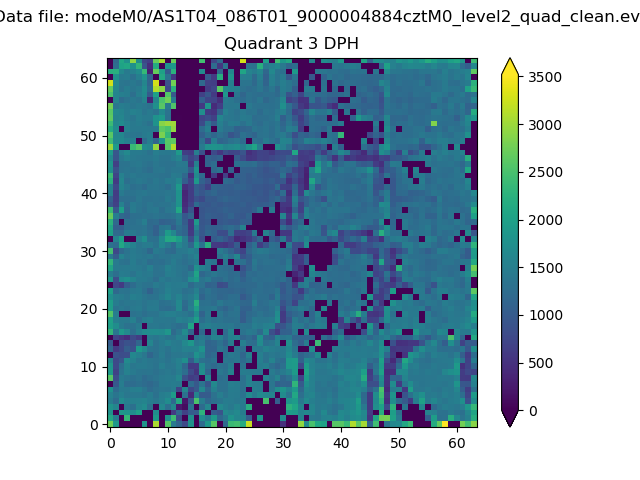 |
 |
Quadrant C |
| Plot type | Count rate plots | Images |
|---|---|---|
| Comparison with Poisson distribution Blue bars denote a histogram of data divided into 1 sec bins. Red curve is a Poisson curve with rate = median count rate of data. |
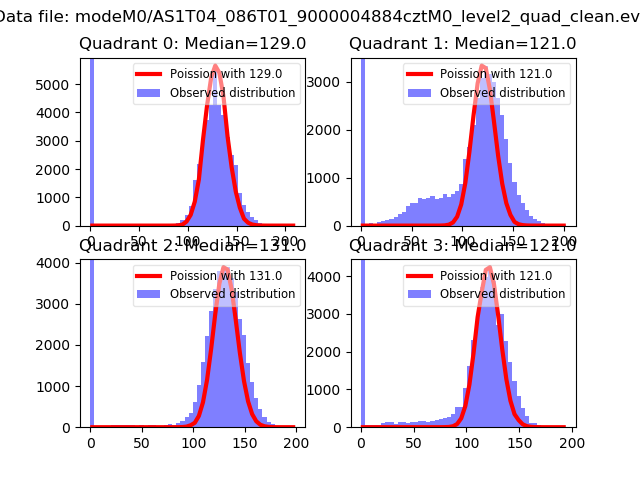 |
 |
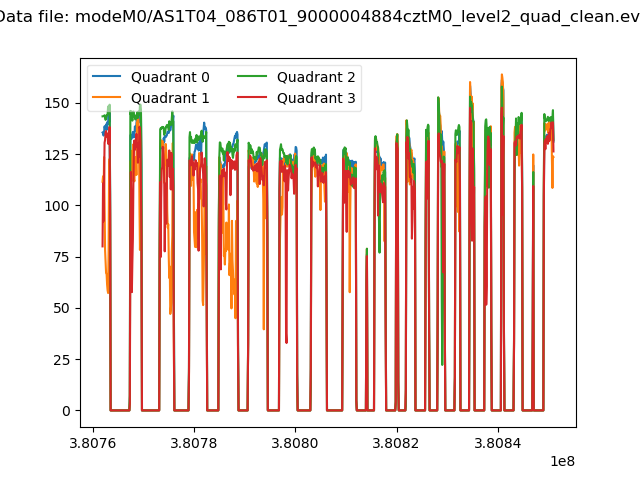
| Quadrant-wise count rates Data is divided into 100 sec bins |
 |
|
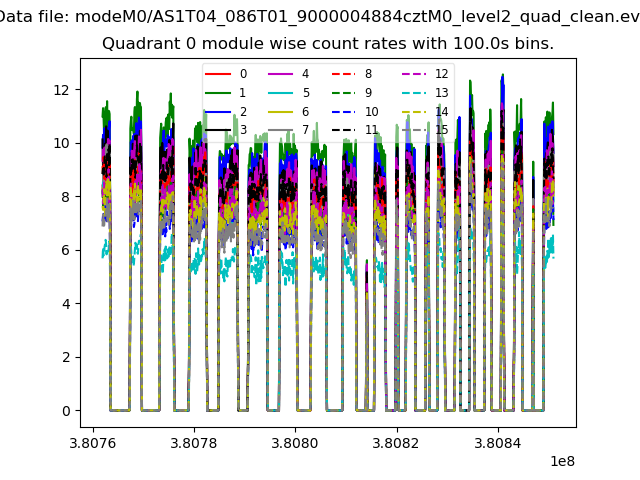
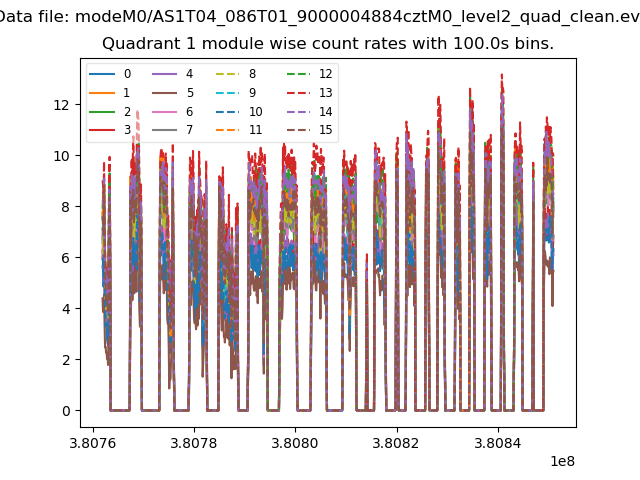
| Module-wise count rates for Quadrant A Data is divided into 100 sec bins |
 |
 |
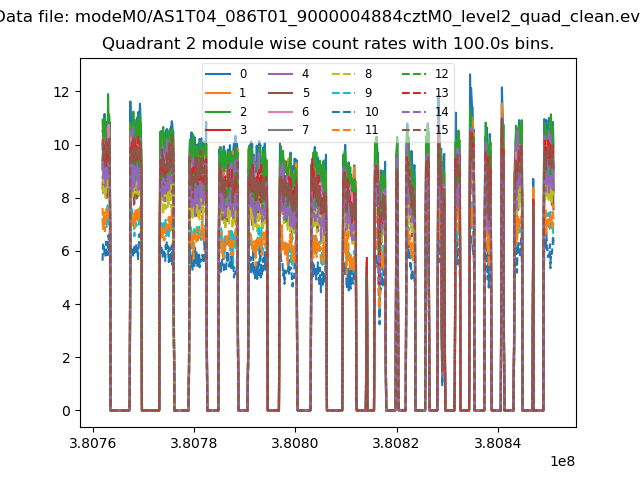
| Module-wise count rates for Quadrant B Data is divided into 100 sec bins |
 |
 |
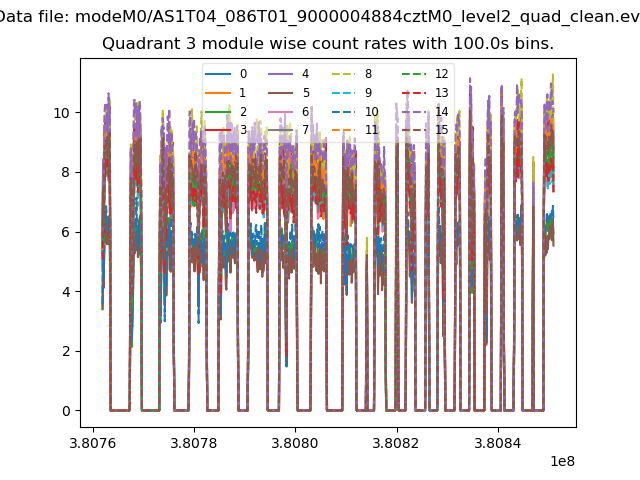
| Module-wise count rates for Quadrant C Data is divided into 100 sec bins |
 |
 |
| Module-wise count rates for Quadrant D Data is divided into 100 sec bins |
 |
 |
| Parameter | Plot |
|---|---|
| CZT HV Monitor | 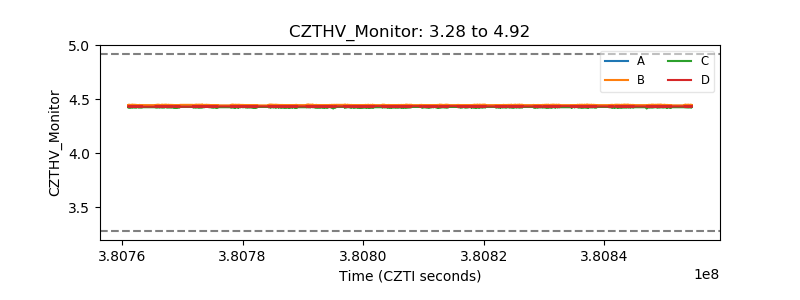 |
| D_VDD | 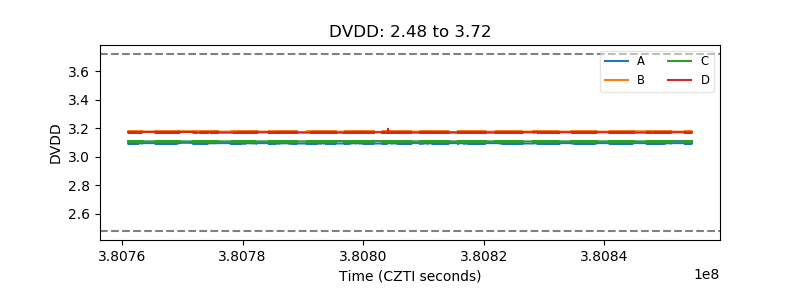 |
| Temperature 1 | 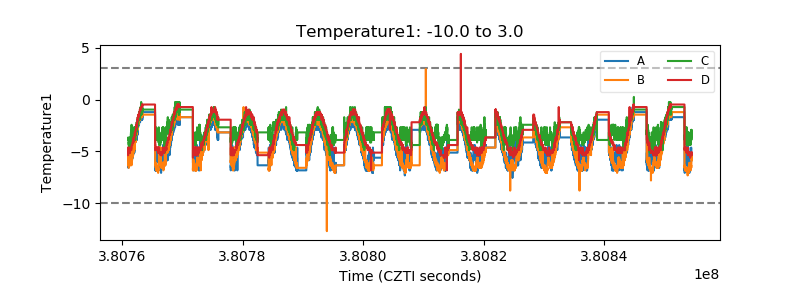 |
| Veto HV Monitor | 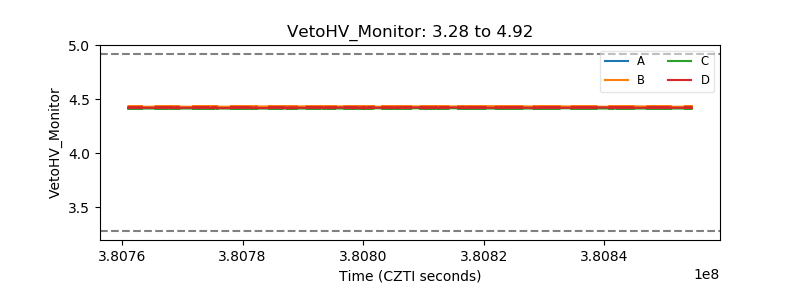 |
| Veto LLD | 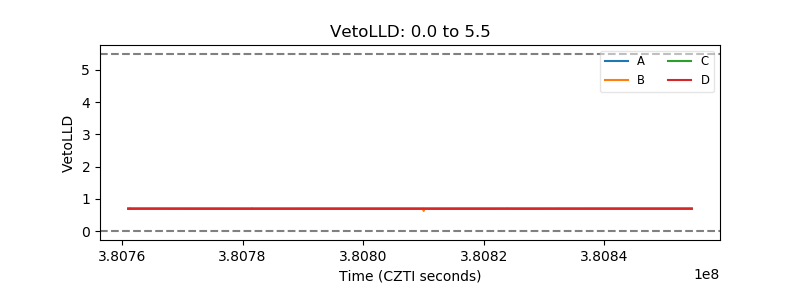 |
| Alpha Counter | 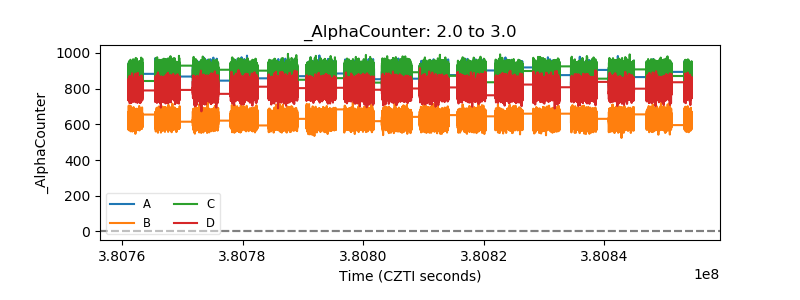 |
| _CPM_Rate | 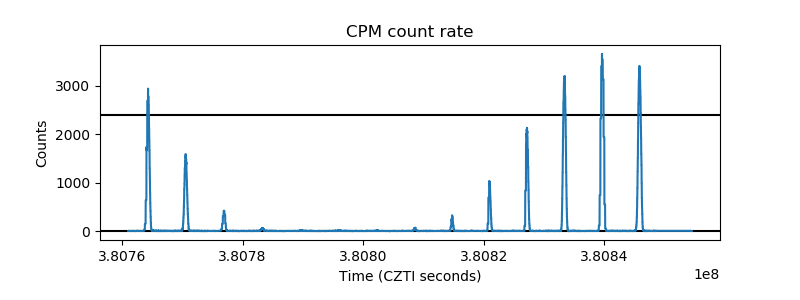 |
| CZT Counter | 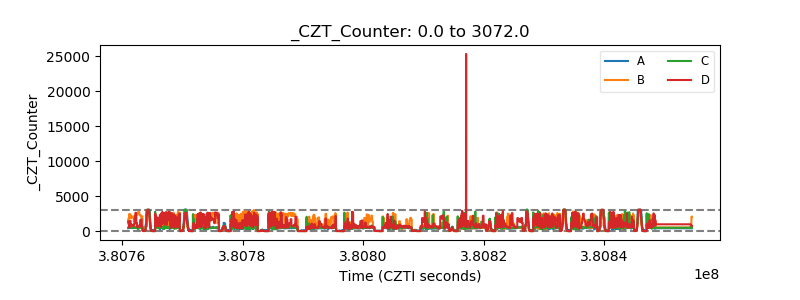 |
| +2.5 Volts monitor | 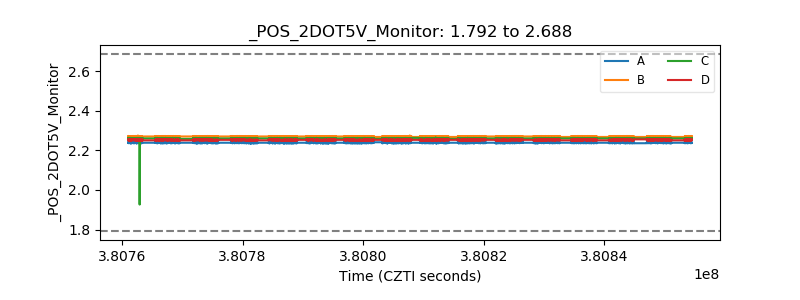 |
| +5 Volts monitor | 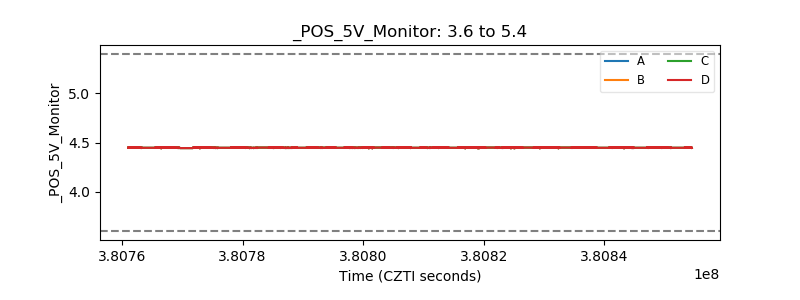 |
| _ROLL_ROT | 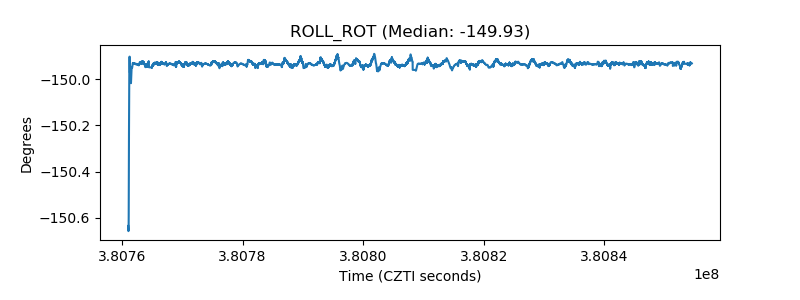 |
| _Roll_DEC | 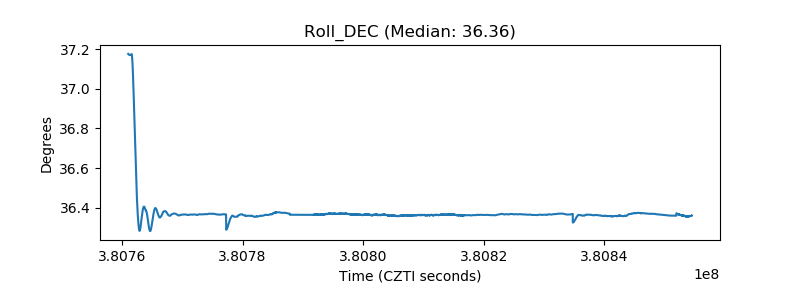 |
| _Roll_RA | 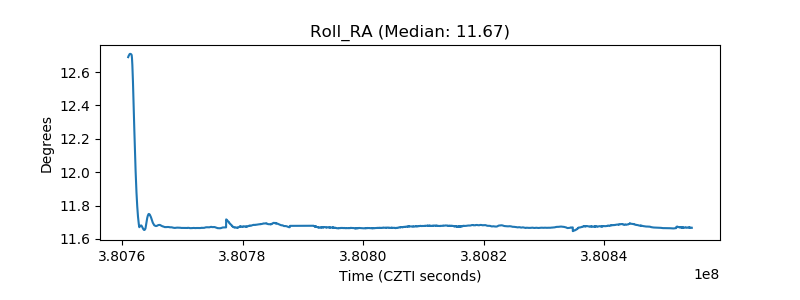 |
| Veto Counter | 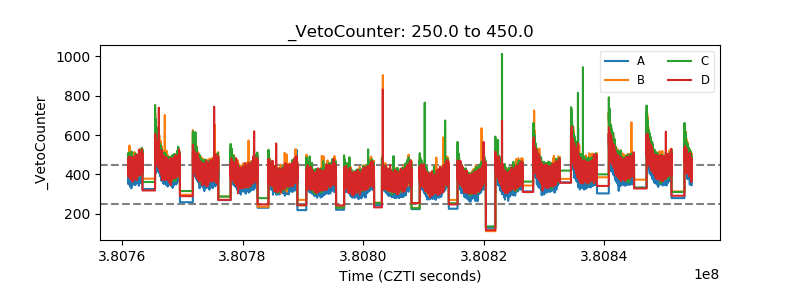 |