| Param | Original file | Final file |
|---|---|---|
| Filename | modeM0/AS1A11_047T15_9000004882_34202cztM0_level2.evt | modeM0/AS1A11_047T15_9000004882_34202cztM0_level2_quad_clean.evt |
| Size (bytes) | 636,577,920 | 61,715,520 |
| Size | 607.1 MB | 58.9 MB |
| Events in quadrant A | 2,885,743 | 380,668 |
| Events in quadrant B | 6,290,339 | 371,208 |
| Events in quadrant C | 3,475,742 | 375,386 |
| Events in quadrant D | 6,251,746 | 352,585 |
| Mode SS | |||
|---|---|---|---|
| Quadrant | BADHDUFLAG | Total packets | Discarded packets |
| A | 0 | 114 | 0 |
| B | 0 | 114 | 0 |
| C | 0 | 114 | 0 |
| D | 0 | 114 | 0 |
| Mode M9 | |||
|---|---|---|---|
| Quadrant | BADHDUFLAG | Total packets | Discarded packets |
| A | 0 | 26 | 0 |
| B | 0 | 26 | 0 |
| C | 0 | 26 | 0 |
| D | 0 | 27 | 0 |
| Mode M0 | |||
|---|---|---|---|
| Quadrant | BADHDUFLAG | Total packets | Discarded packets |
| A | 0 | 12070 | 3 |
| B | 0 | 22460 | 2 |
| C | 0 | 13698 | 2 |
| D | 0 | 22480 | 2 |
| Quadrant | Total seconds | Saturated seconds | Saturation percentage |
|---|---|---|---|
| A | 5549 | 55 | 0.991170% |
| B | 5549 | 1413 | 25.464048% |
| C | 5549 | 228 | 4.108848% |
| D | 5549 | 607 | 10.938908% |
Noise dominated data is calculated using 1-second bins in cleaned event files. If a bin has >2000 counts, and if more than 50% of those come from <1% of pixels, then it is considered to be noise-dominated and hence unusable.
| Quadrant | # 1 sec bins | Bins with >0 counts | Bins with >2000 counts | High rate bins dominated by noise | Noise dominated (total time) | Noise dominated (detector-on time) | Marked lightcurve |
|---|---|---|---|---|---|---|---|
| A | 7312 | 5550 | 33 | 33 | 0.45% | 0.59% | 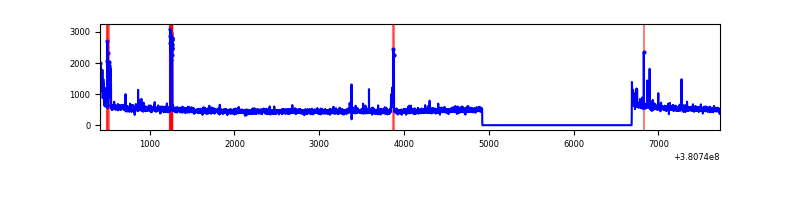 |
| B | 7312 | 5550 | 1146 | 1146 | 15.67% | 20.65% | 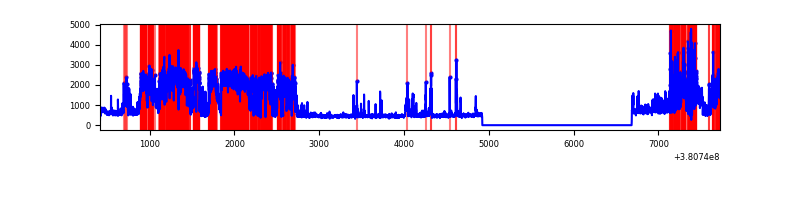 |
| C | 7312 | 5550 | 164 | 164 | 2.24% | 2.95% | 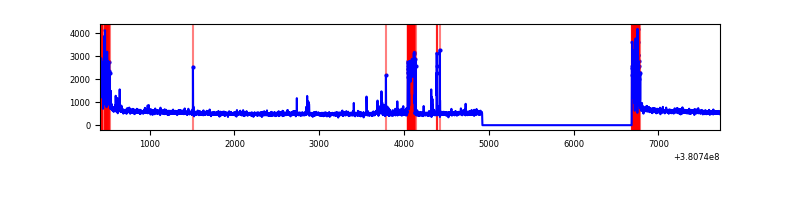 |
| D | 7312 | 5550 | 509 | 509 | 6.96% | 9.17% | 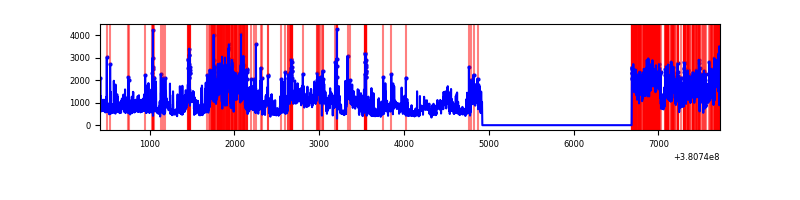 |
Top three noisy pixels from each quadrant. If the there are fewer than three noisy pixels in the level2.evt file, extra rows are filled as -1
| Pixel properties | Quadrant properties | ||||||
|---|---|---|---|---|---|---|---|
| Quadrant | DetID | PixID | Counts | Sigma | Mean | Median | Sigma |
| A | 15 | 169 | 117090 | 845.53 | 684 | 671 | 137.7 |
| A | 9 | 143 | 46099 | 329.93 | 684 | 671 | 137.7 |
| A | 15 | 17 | 34690 | 247.07 | 684 | 671 | 137.7 |
| B | 5 | 31 | 1395227 | 11629.5 | 631 | 615 | 119.9 |
| B | 5 | 15 | 1070409 | 8920.89 | 631 | 615 | 119.9 |
| B | 5 | 14 | 396513 | 3301.35 | 631 | 615 | 119.9 |
| C | 0 | 10 | 377093 | 2475.46 | 659 | 666 | 152.1 |
| C | 15 | 214 | 249591 | 1636.98 | 659 | 666 | 152.1 |
| C | 9 | 187 | 218789 | 1434.42 | 659 | 666 | 152.1 |
| D | 8 | 195 | 1552274 | 8993.1 | 647 | 634 | 172.5 |
| D | 12 | 217 | 1043023 | 6041.55 | 647 | 634 | 172.5 |
| D | 2 | 249 | 468304 | 2710.55 | 647 | 634 | 172.5 |
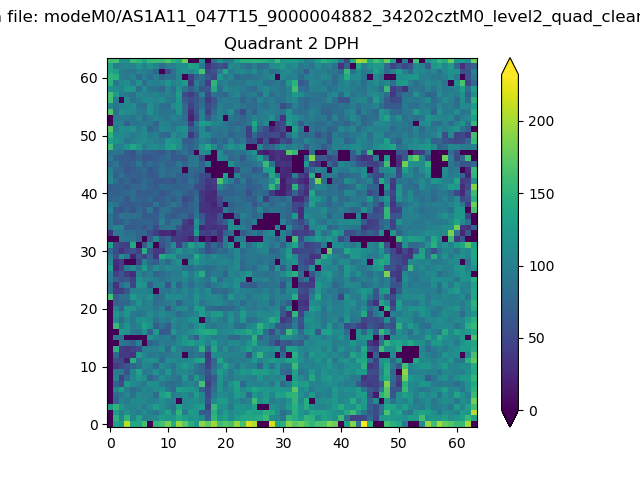
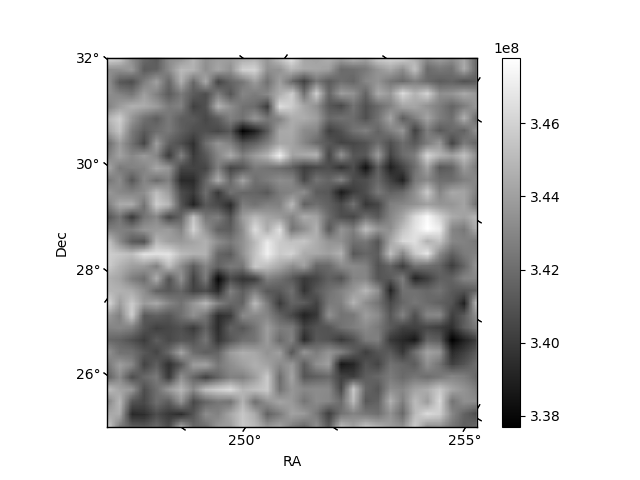
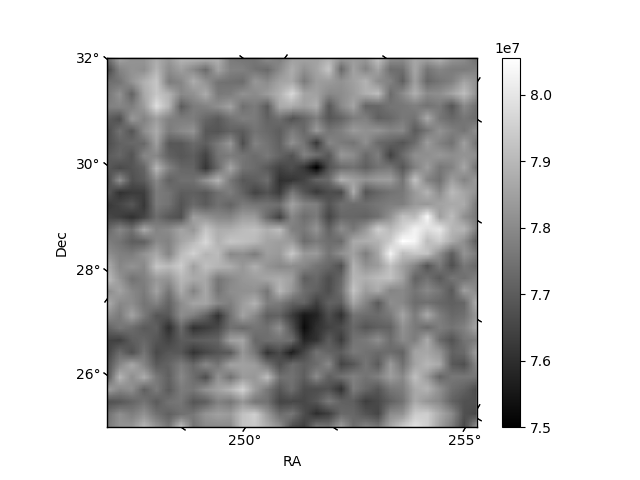
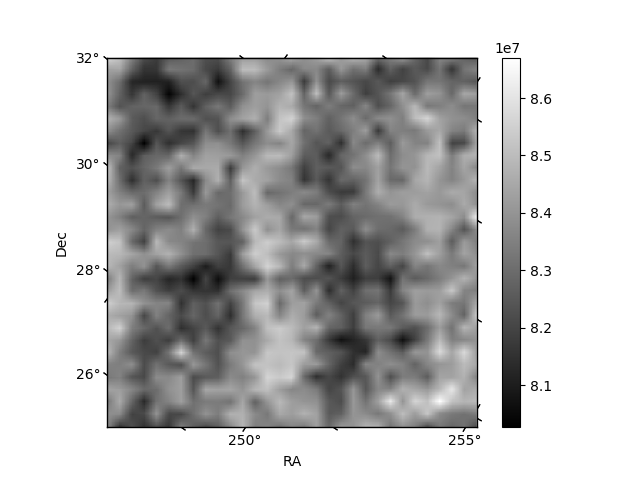
Histogram calculated using DETX and DETY for each event in the final _common_clean file
| Quadrant A | 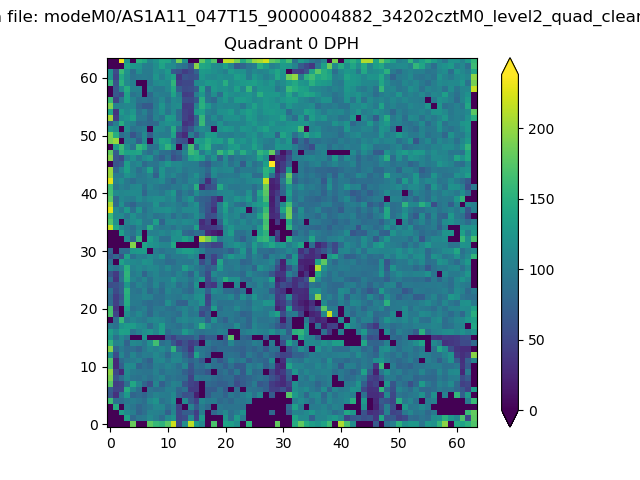 |
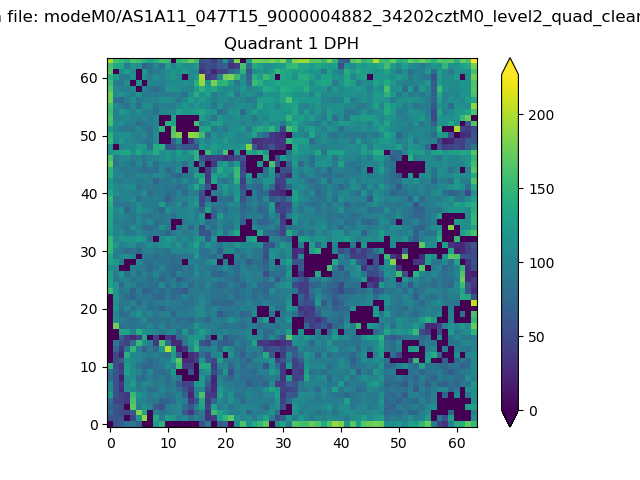 |
Quadrant B |
|---|---|---|---|
| Quadrant D | 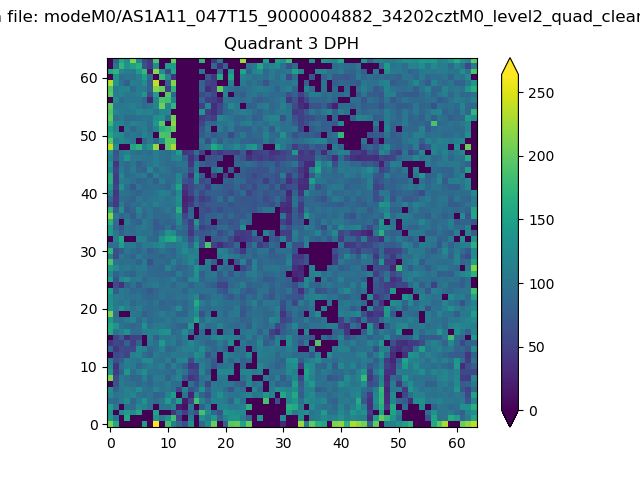 |
 |
Quadrant C |
| Plot type | Count rate plots | Images |
|---|---|---|
| Comparison with Poisson distribution Blue bars denote a histogram of data divided into 1 sec bins. Red curve is a Poisson curve with rate = median count rate of data. |
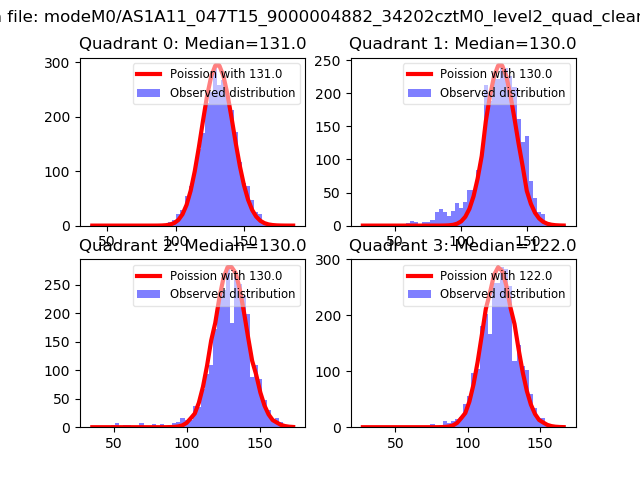 |
 |
| Quadrant-wise count rates Data is divided into 100 sec bins |
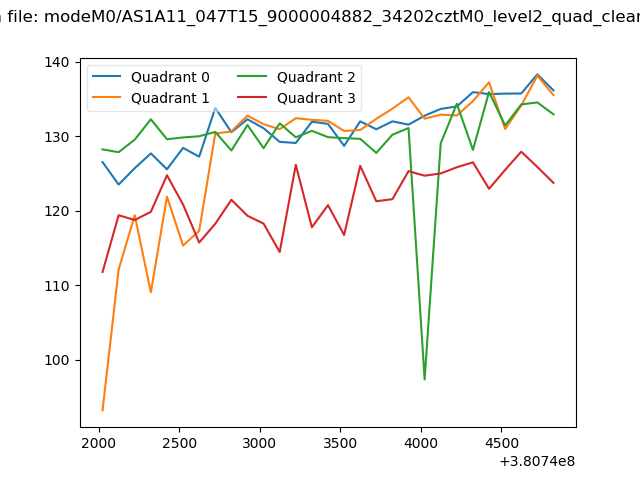 |
|
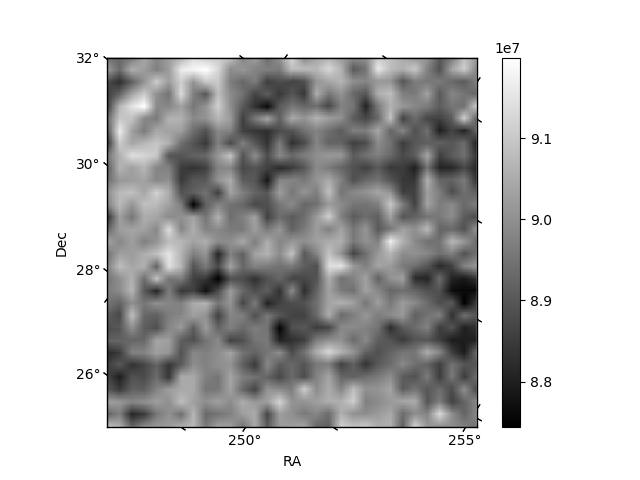
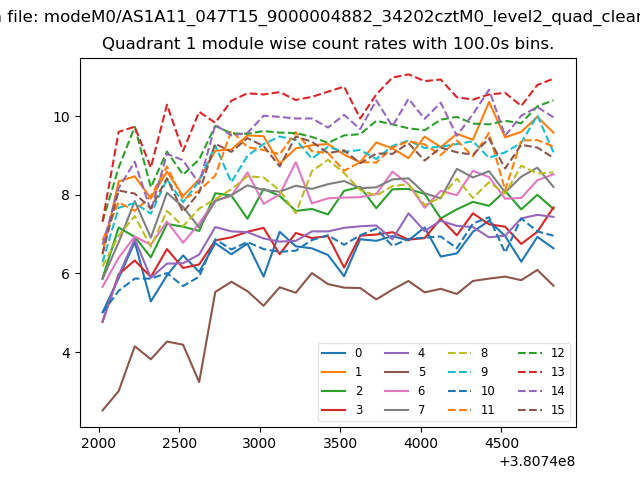
| Module-wise count rates for Quadrant A Data is divided into 100 sec bins |
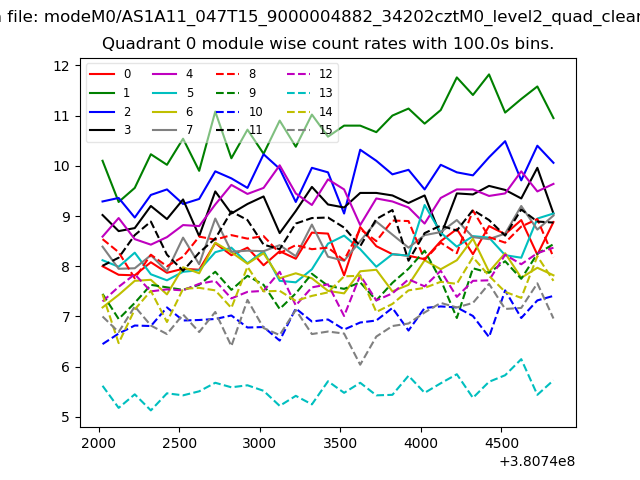 |
 |
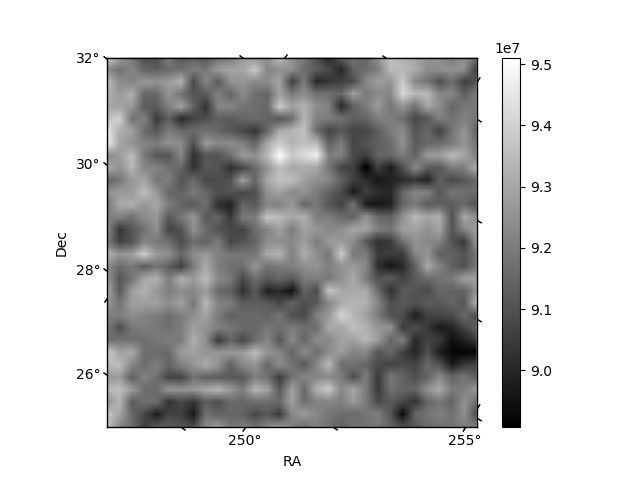
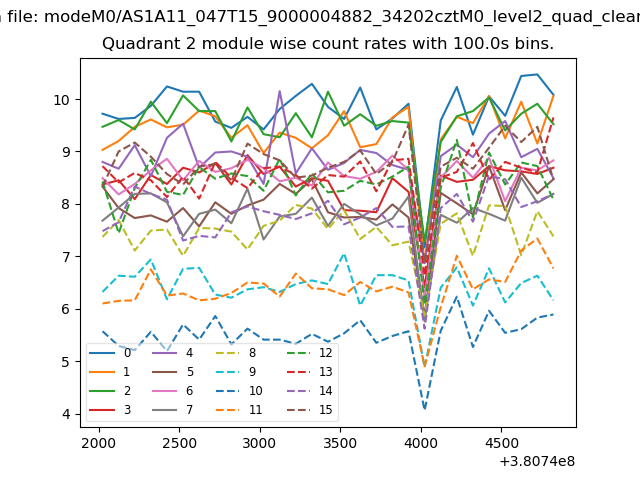
| Module-wise count rates for Quadrant B Data is divided into 100 sec bins |
 |
 |
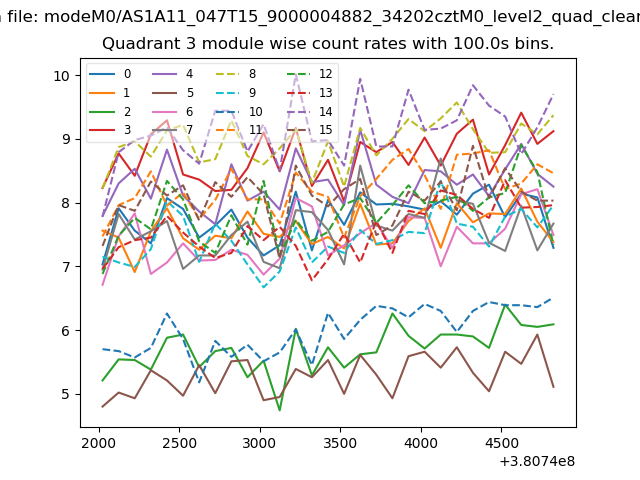
| Module-wise count rates for Quadrant C Data is divided into 100 sec bins |
 |
 |
| Module-wise count rates for Quadrant D Data is divided into 100 sec bins |
 |
 |
| Parameter | Plot |
|---|---|
| CZT HV Monitor | 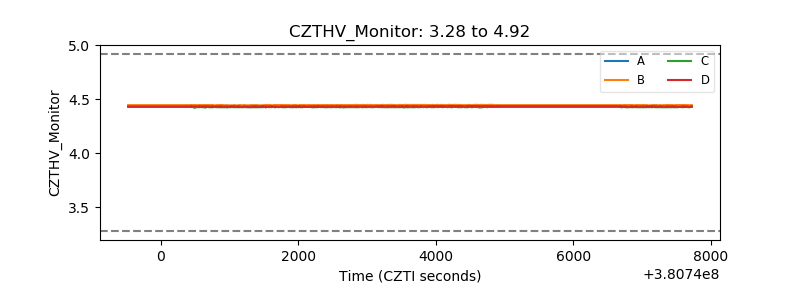 |
| D_VDD | 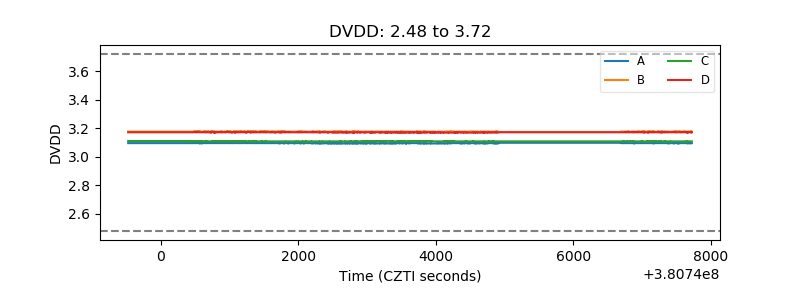 |
| Temperature 1 | 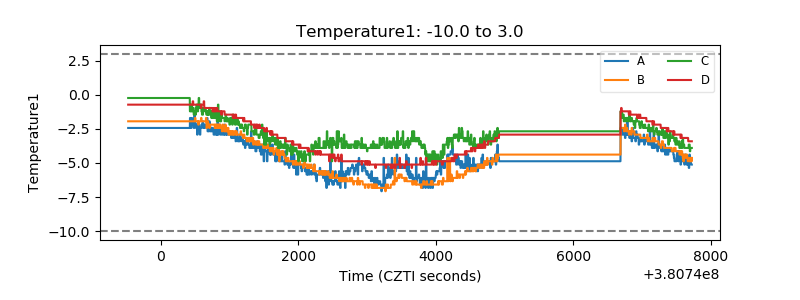 |
| Veto HV Monitor | 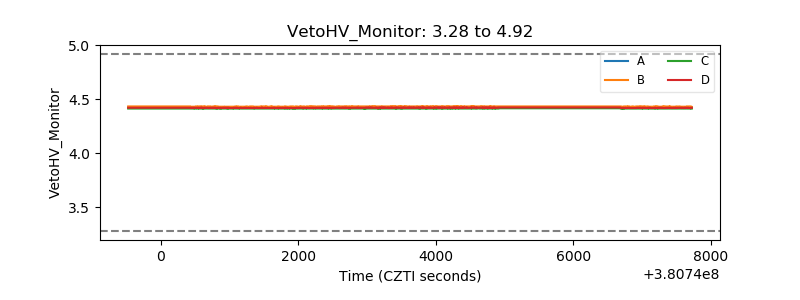 |
| Veto LLD | 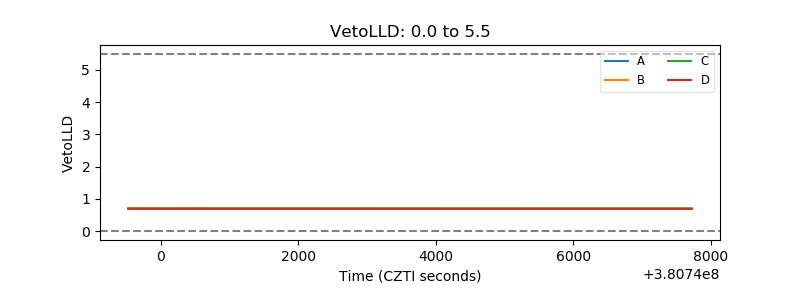 |
| Alpha Counter | 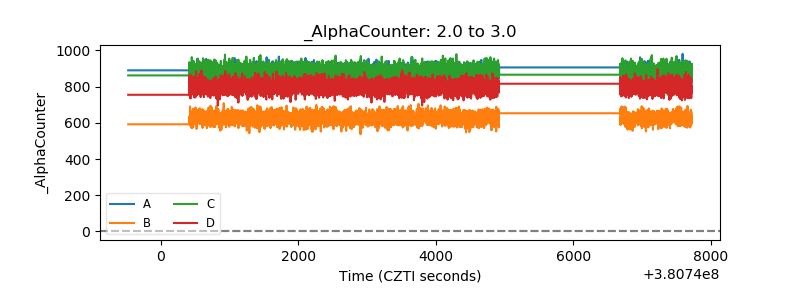 |
| _CPM_Rate | 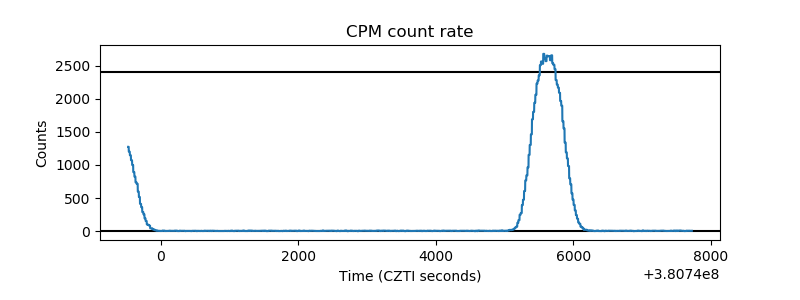 |
| CZT Counter | 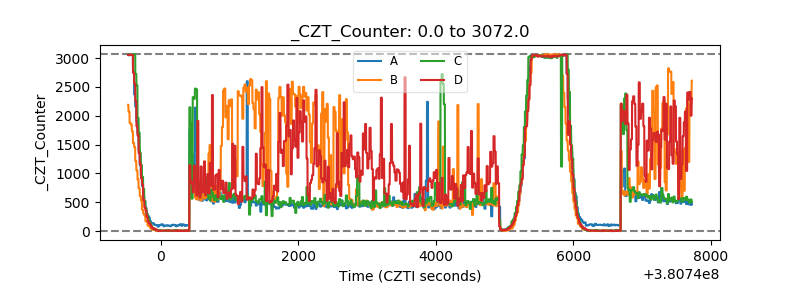 |
| +2.5 Volts monitor | 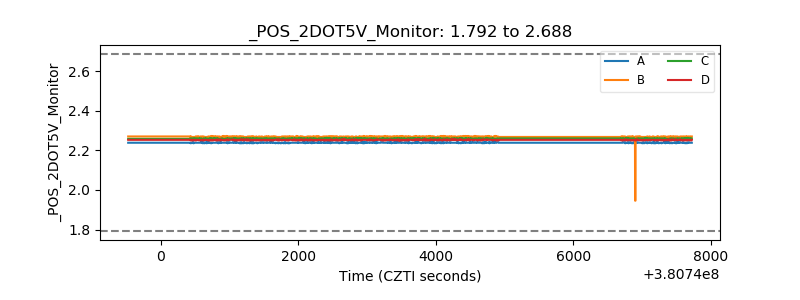 |
| +5 Volts monitor | 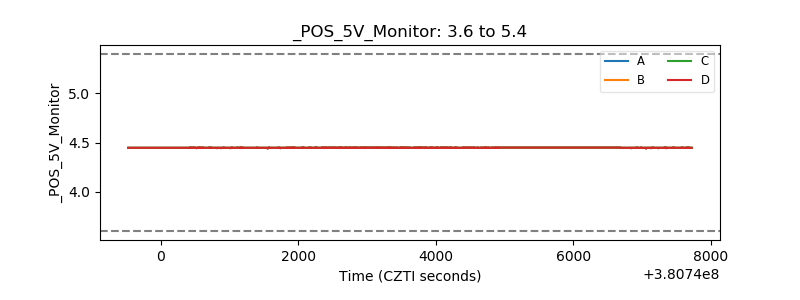 |
| _ROLL_ROT | 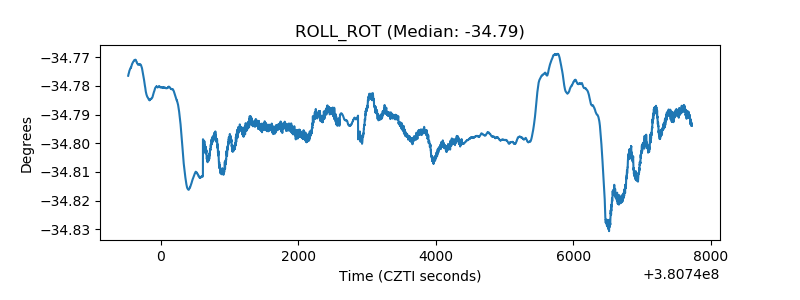 |
| _Roll_DEC | 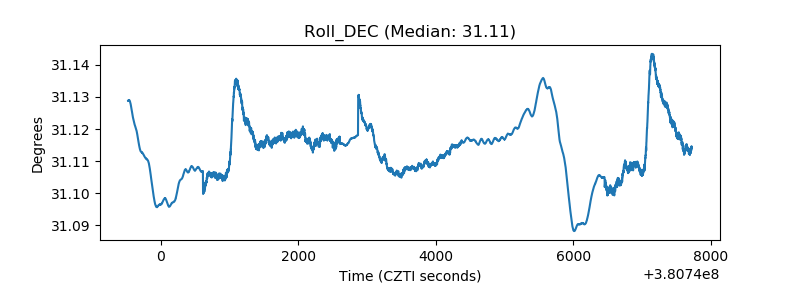 |
| _Roll_RA | 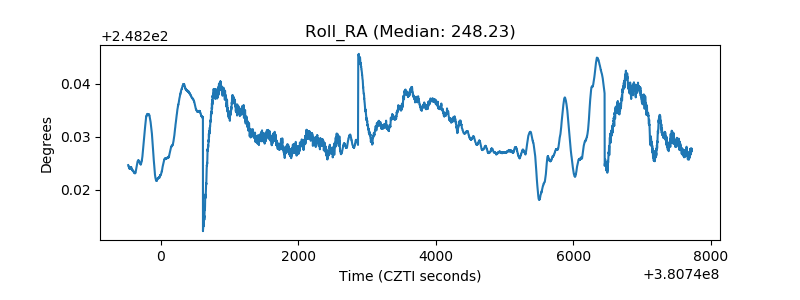 |
| Veto Counter | 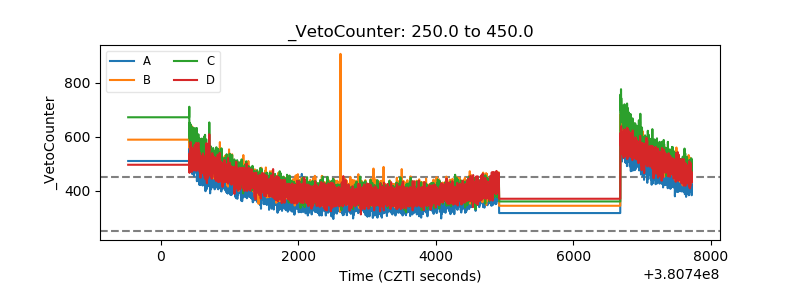 |