| Param | Original file | Final file |
|---|---|---|
| Filename | modeM0/AS1A11_047T15_9000004882_34200cztM0_level2.evt | modeM0/AS1A11_047T15_9000004882_34200cztM0_level2_quad_clean.evt |
| Size (bytes) | 611,991,360 | 55,353,600 |
| Size | 583.6 MB | 52.8 MB |
| Events in quadrant A | 2,824,677 | 331,595 |
| Events in quadrant B | 5,032,907 | 333,345 |
| Events in quadrant C | 3,363,369 | 329,446 |
| Events in quadrant D | 6,936,555 | 291,768 |
| Mode SS | |||
|---|---|---|---|
| Quadrant | BADHDUFLAG | Total packets | Discarded packets |
| A | 0 | 114 | 0 |
| B | 0 | 114 | 0 |
| C | 0 | 114 | 0 |
| D | 0 | 114 | 0 |
| Mode M9 | |||
|---|---|---|---|
| Quadrant | BADHDUFLAG | Total packets | Discarded packets |
| A | 0 | 22 | 0 |
| B | 0 | 22 | 0 |
| C | 0 | 22 | 0 |
| D | 0 | 23 | 0 |
| Mode M0 | |||
|---|---|---|---|
| Quadrant | BADHDUFLAG | Total packets | Discarded packets |
| A | 0 | 11961 | 3 |
| B | 0 | 18596 | 2 |
| C | 0 | 13227 | 2 |
| D | 0 | 24476 | 2 |
| Quadrant | Total seconds | Saturated seconds | Saturation percentage |
|---|---|---|---|
| A | 5564 | 62 | 1.114306% |
| B | 5564 | 983 | 17.667146% |
| C | 5564 | 163 | 2.929547% |
| D | 5564 | 1133 | 20.363048% |
Noise dominated data is calculated using 1-second bins in cleaned event files. If a bin has >2000 counts, and if more than 50% of those come from <1% of pixels, then it is considered to be noise-dominated and hence unusable.
| Quadrant | # 1 sec bins | Bins with >0 counts | Bins with >2000 counts | High rate bins dominated by noise | Noise dominated (total time) | Noise dominated (detector-on time) | Marked lightcurve |
|---|---|---|---|---|---|---|---|
| A | 7207 | 5566 | 32 | 32 | 0.44% | 0.57% | 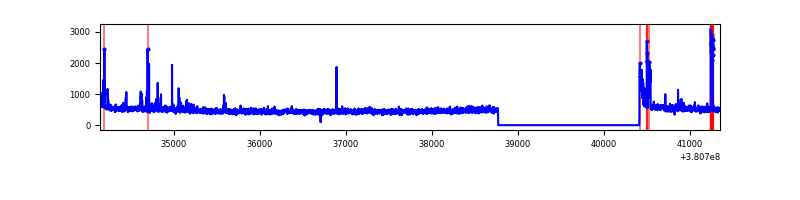 |
| B | 7207 | 5566 | 808 | 808 | 11.21% | 14.52% | 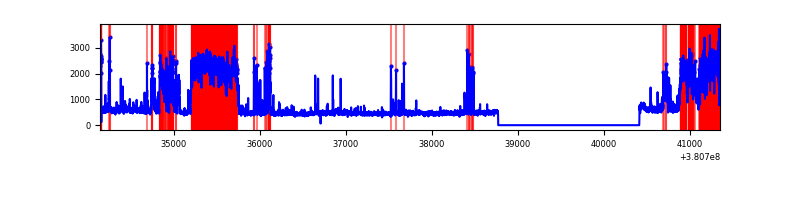 |
| C | 7207 | 5566 | 102 | 102 | 1.42% | 1.83% | 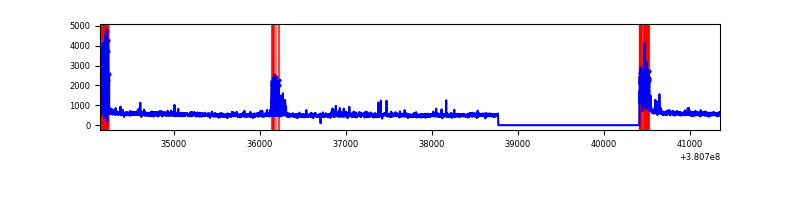 |
| D | 7207 | 5566 | 971 | 971 | 13.47% | 17.45% | 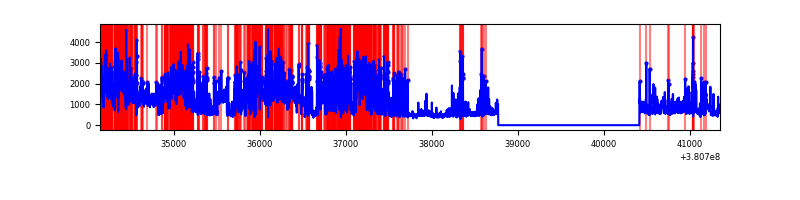 |
Top three noisy pixels from each quadrant. If the there are fewer than three noisy pixels in the level2.evt file, extra rows are filled as -1
| Pixel properties | Quadrant properties | ||||||
|---|---|---|---|---|---|---|---|
| Quadrant | DetID | PixID | Counts | Sigma | Mean | Median | Sigma |
| A | 15 | 169 | 115272 | 842.09 | 670 | 656 | 136.1 |
| A | 9 | 143 | 77105 | 561.67 | 670 | 656 | 136.1 |
| A | 10 | 83 | 23593 | 168.52 | 670 | 656 | 136.1 |
| B | 5 | 31 | 898114 | 7405.09 | 631 | 615 | 121.2 |
| B | 5 | 15 | 736816 | 6074.25 | 631 | 615 | 121.2 |
| B | 5 | 172 | 459882 | 3789.32 | 631 | 615 | 121.2 |
| C | 0 | 10 | 371123 | 2460.32 | 647 | 653 | 150.6 |
| C | 15 | 214 | 253659 | 1680.23 | 647 | 653 | 150.6 |
| C | 14 | 254 | 171876 | 1137.11 | 647 | 653 | 150.6 |
| D | 2 | 249 | 2565779 | 16968.29 | 612 | 593 | 151.2 |
| D | 8 | 195 | 1202470 | 7950.22 | 612 | 593 | 151.2 |
| D | 2 | 250 | 332870 | 2197.96 | 612 | 593 | 151.2 |
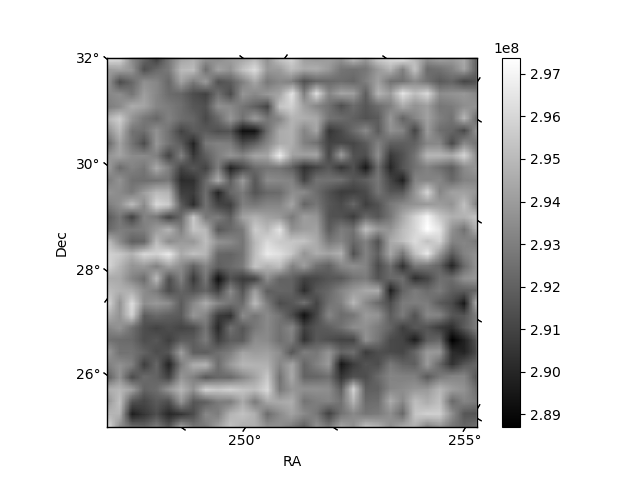
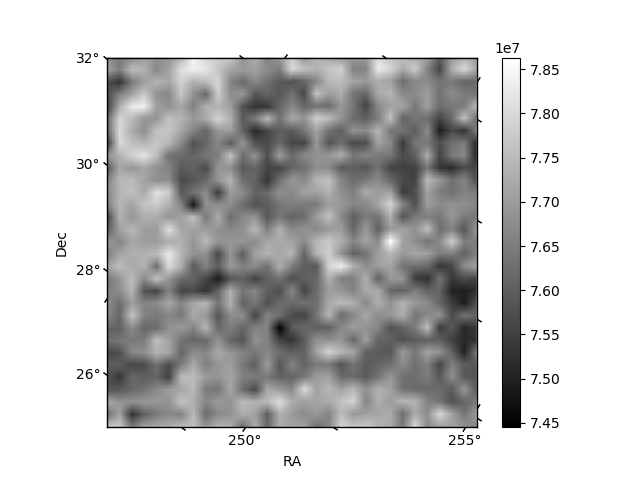
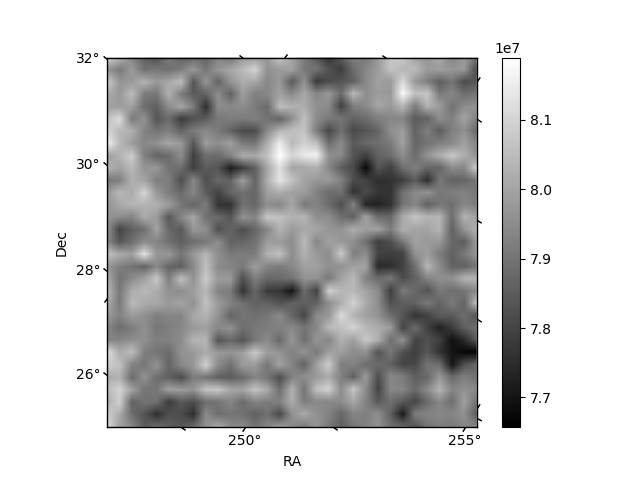
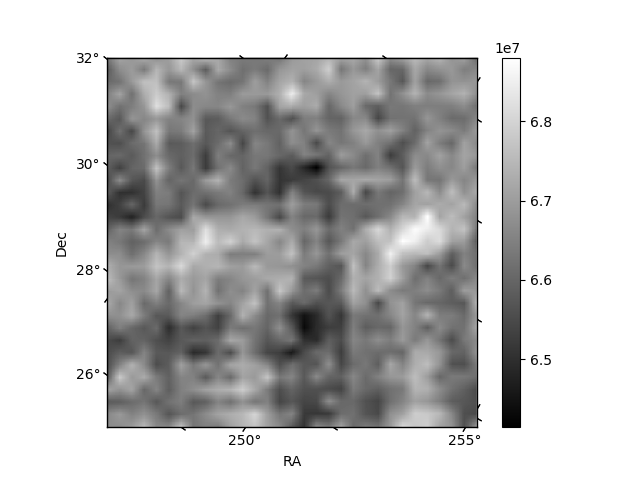
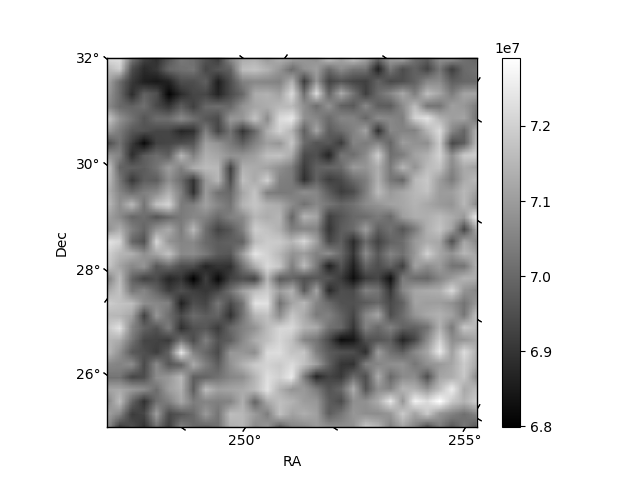
Histogram calculated using DETX and DETY for each event in the final _common_clean file
| Quadrant A | 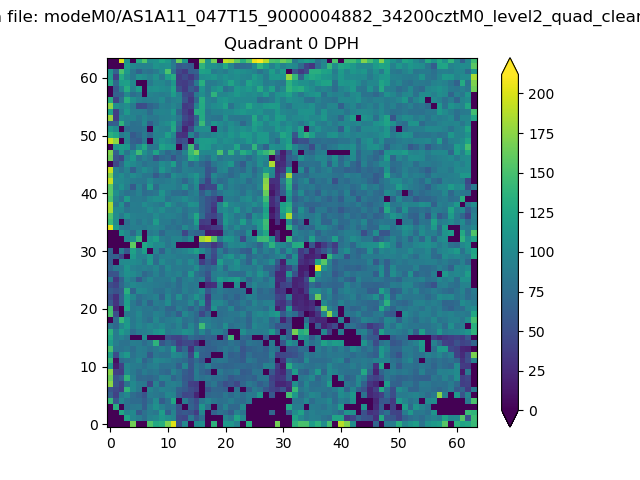 |
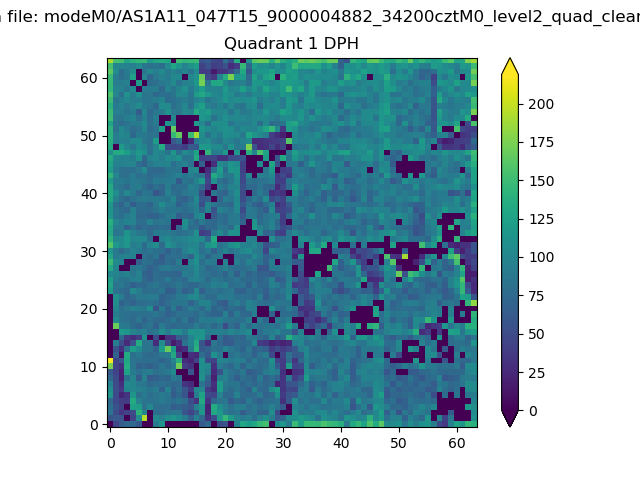 |
Quadrant B |
|---|---|---|---|
| Quadrant D | 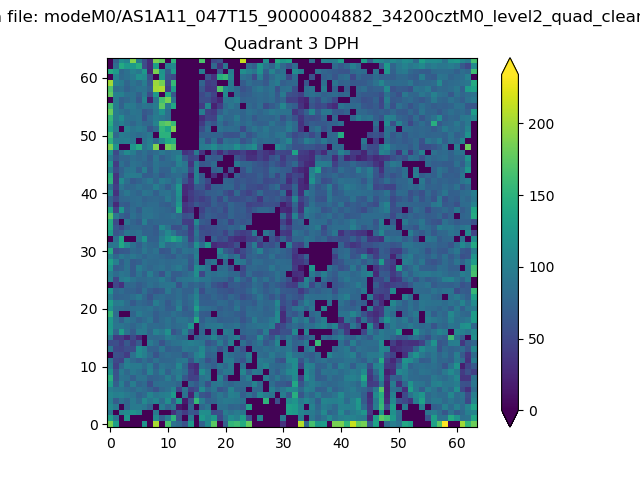 |
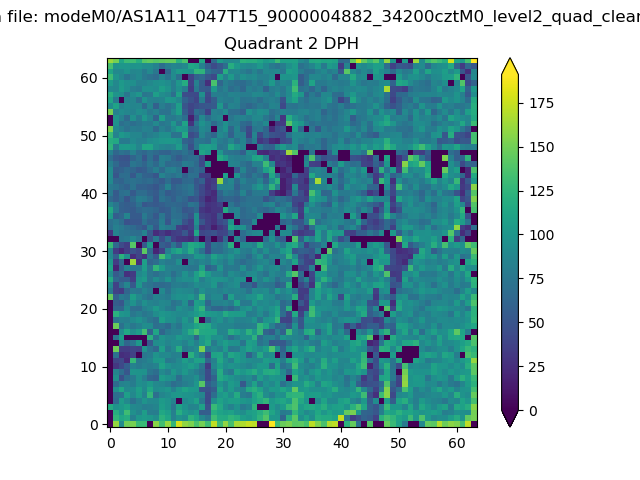 |
Quadrant C |
| Plot type | Count rate plots | Images |
|---|---|---|
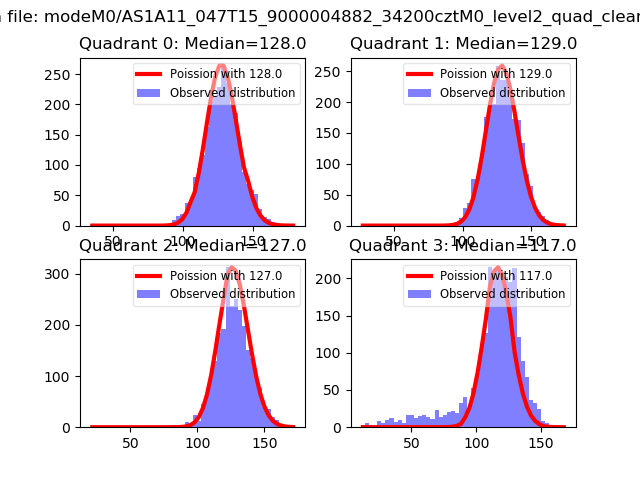
| Comparison with Poisson distribution Blue bars denote a histogram of data divided into 1 sec bins. Red curve is a Poisson curve with rate = median count rate of data. |
 |
 |
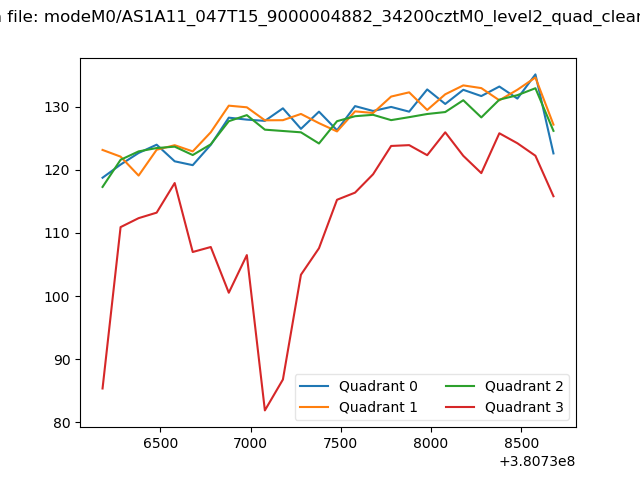
| Quadrant-wise count rates Data is divided into 100 sec bins |
 |
|
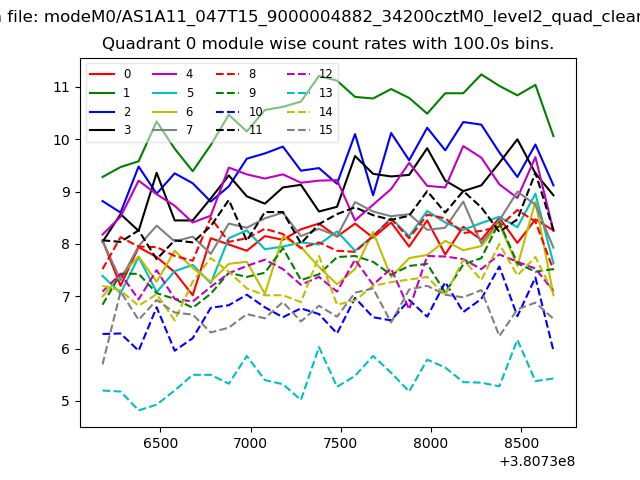
| Module-wise count rates for Quadrant A Data is divided into 100 sec bins |
 |
 |
| Module-wise count rates for Quadrant B Data is divided into 100 sec bins |
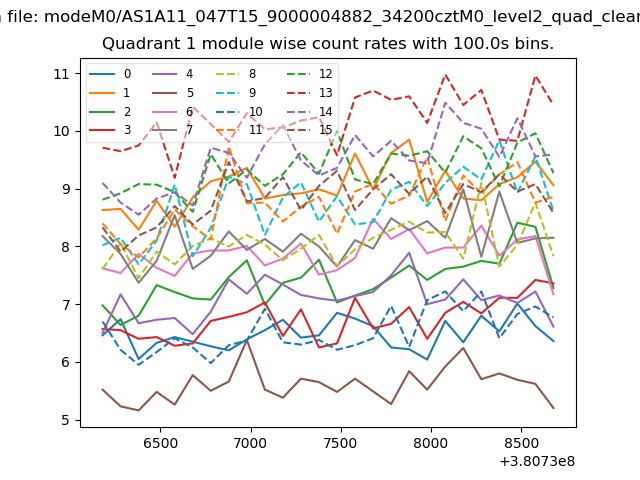 |
 |
| Module-wise count rates for Quadrant C Data is divided into 100 sec bins |
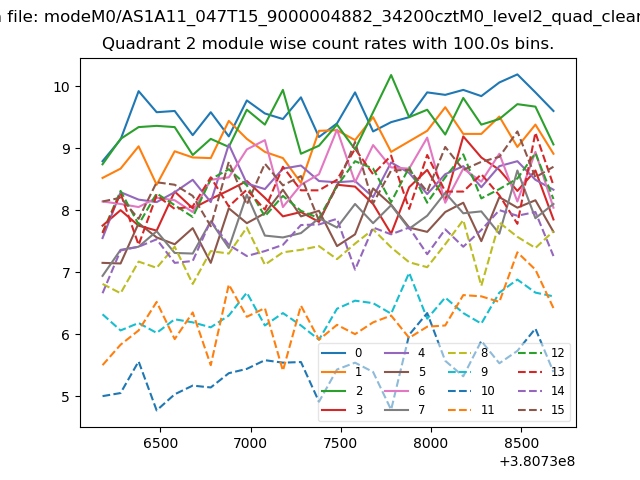 |
 |
| Module-wise count rates for Quadrant D Data is divided into 100 sec bins |
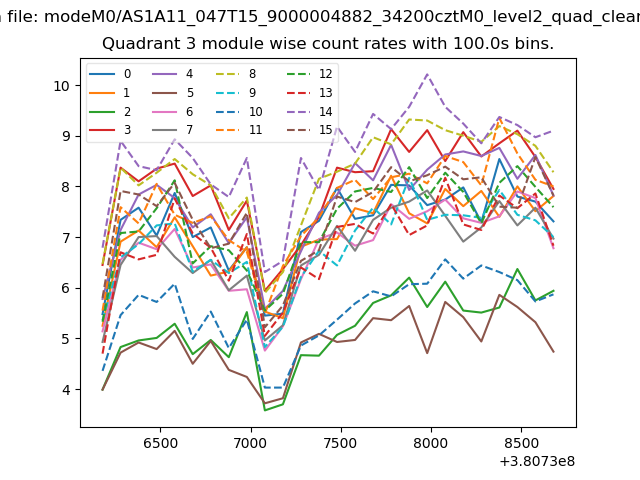 |
 |
| Parameter | Plot |
|---|---|
| CZT HV Monitor |  |
| D_VDD | 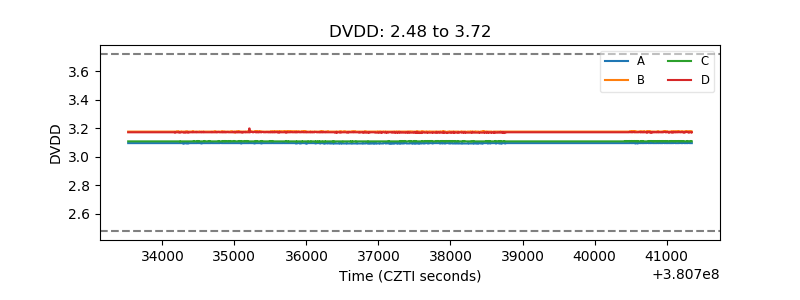 |
| Temperature 1 | 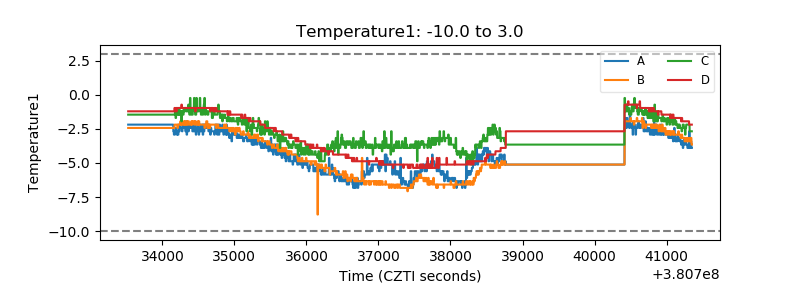 |
| Veto HV Monitor | 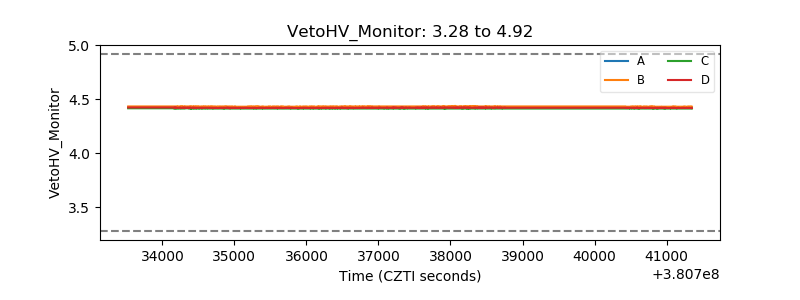 |
| Veto LLD | 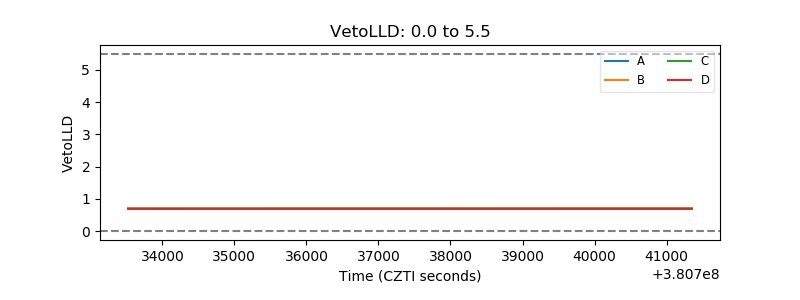 |
| Alpha Counter | 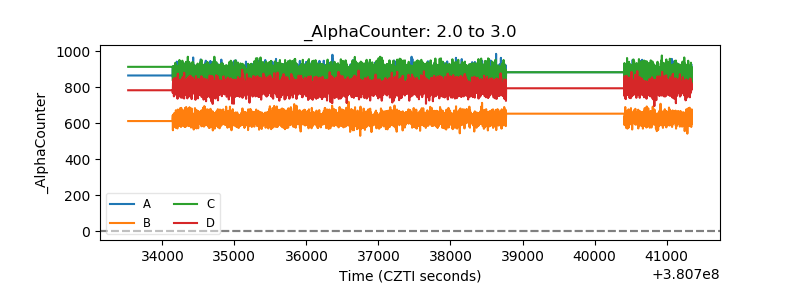 |
| _CPM_Rate | 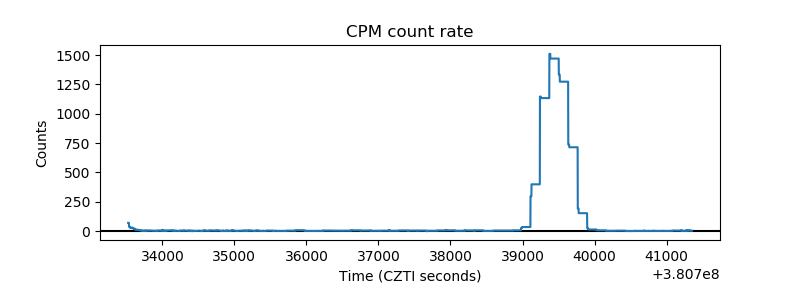 |
| CZT Counter | 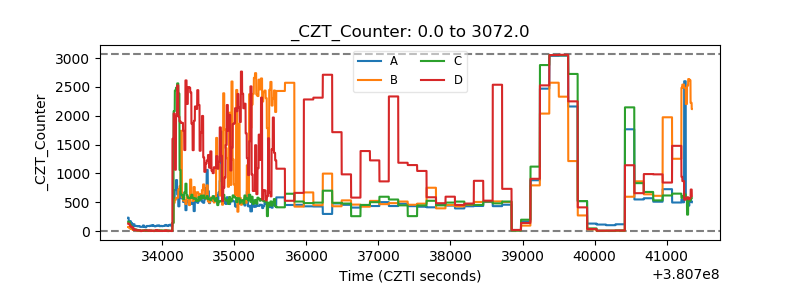 |
| +2.5 Volts monitor | 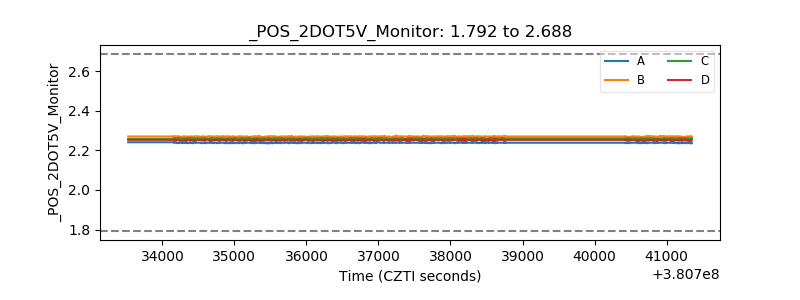 |
| +5 Volts monitor | 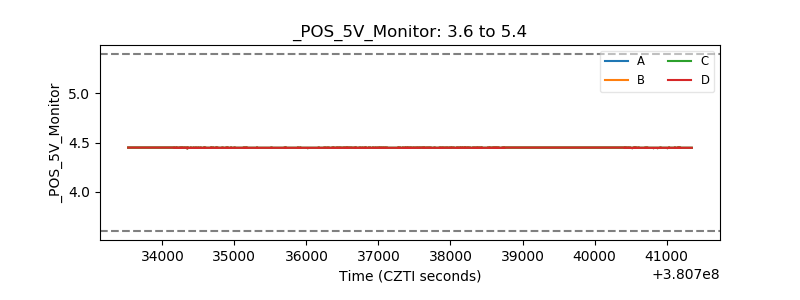 |
| _ROLL_ROT | 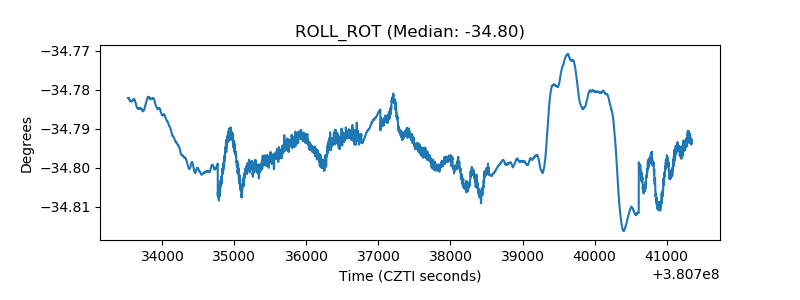 |
| _Roll_DEC | 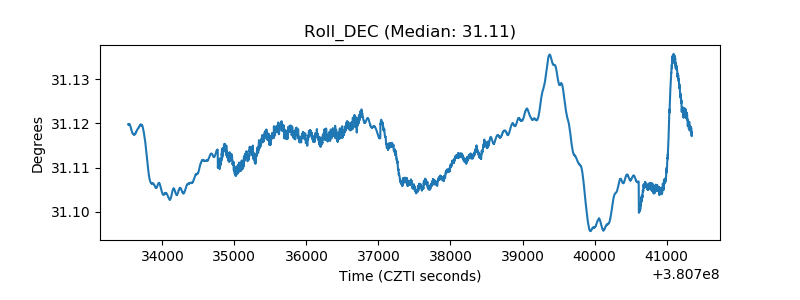 |
| _Roll_RA | 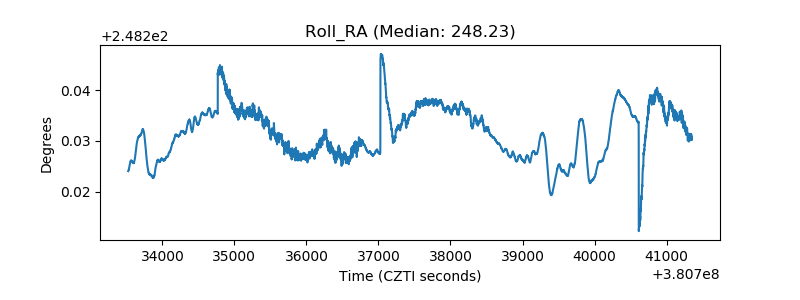 |
| Veto Counter | 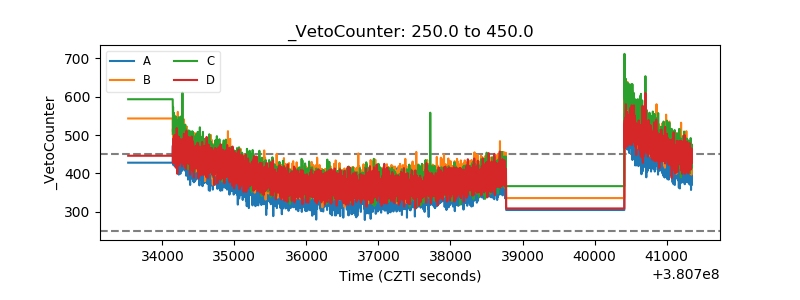 |