| Param | Original file | Final file |
|---|---|---|
| Filename | modeM0/AS1A11_047T15_9000004882_34199cztM0_level2.evt | modeM0/AS1A11_047T15_9000004882_34199cztM0_level2_quad_clean.evt |
| Size (bytes) | 1,560,312,000 | 163,909,440 |
| Size | 1.5 GB | 156.3 MB |
| Events in quadrant A | 7,389,874 | 1,013,821 |
| Events in quadrant B | 14,461,782 | 973,142 |
| Events in quadrant C | 9,098,184 | 1,003,027 |
| Events in quadrant D | 15,262,629 | 904,765 |
| Mode SS | |||
|---|---|---|---|
| Quadrant | BADHDUFLAG | Total packets | Discarded packets |
| A | 0 | 314 | 0 |
| B | 0 | 314 | 0 |
| C | 0 | 314 | 0 |
| D | 0 | 314 | 0 |
| Mode M9 | |||
|---|---|---|---|
| Quadrant | BADHDUFLAG | Total packets | Discarded packets |
| A | 0 | 45 | 0 |
| B | 0 | 45 | 0 |
| C | 0 | 45 | 0 |
| D | 0 | 46 | 0 |
| Mode M0 | |||
|---|---|---|---|
| Quadrant | BADHDUFLAG | Total packets | Discarded packets |
| A | 0 | 31823 | 5 |
| B | 0 | 53305 | 4 |
| C | 0 | 35838 | 4 |
| D | 0 | 55952 | 4 |
| Quadrant | Total seconds | Saturated seconds | Saturation percentage |
|---|---|---|---|
| A | 15490 | 43 | 0.277598% |
| B | 15490 | 2043 | 13.189154% |
| C | 15490 | 295 | 1.904454% |
| D | 15490 | 1620 | 10.458360% |
Noise dominated data is calculated using 1-second bins in cleaned event files. If a bin has >2000 counts, and if more than 50% of those come from <1% of pixels, then it is considered to be noise-dominated and hence unusable.
| Quadrant | # 1 sec bins | Bins with >0 counts | Bins with >2000 counts | High rate bins dominated by noise | Noise dominated (total time) | Noise dominated (detector-on time) | Marked lightcurve |
|---|---|---|---|---|---|---|---|
| A | 19728 | 15493 | 13 | 13 | 0.07% | 0.08% | 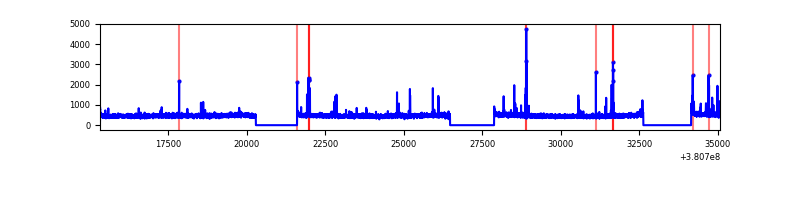 |
| B | 19728 | 15493 | 1461 | 1461 | 7.41% | 9.43% | 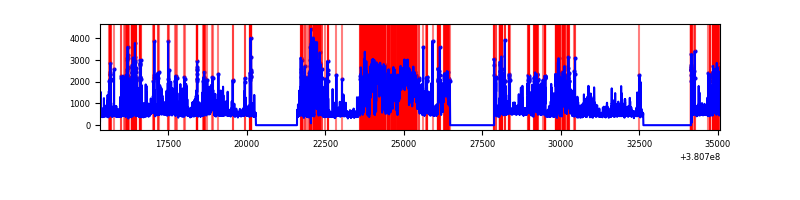 |
| C | 19728 | 15493 | 222 | 222 | 1.13% | 1.43% | 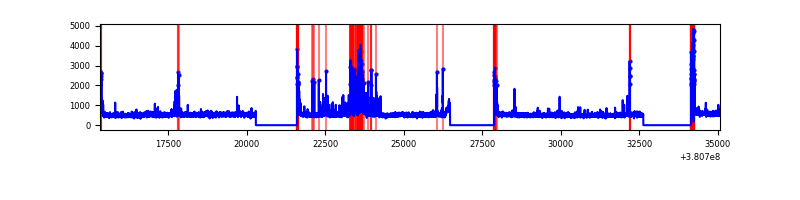 |
| D | 19728 | 15493 | 1303 | 1303 | 6.60% | 8.41% | 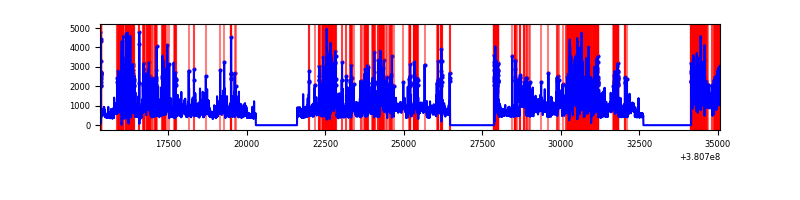 |
Top three noisy pixels from each quadrant. If the there are fewer than three noisy pixels in the level2.evt file, extra rows are filled as -1
| Pixel properties | Quadrant properties | ||||||
|---|---|---|---|---|---|---|---|
| Quadrant | DetID | PixID | Counts | Sigma | Mean | Median | Sigma |
| A | 9 | 143 | 205079 | 554.14 | 1833 | 1799 | 366.8 |
| A | 10 | 83 | 48228 | 126.57 | 1833 | 1799 | 366.8 |
| A | 13 | 6 | 48151 | 126.36 | 1833 | 1799 | 366.8 |
| B | 5 | 31 | 2708376 | 8038.98 | 1758 | 1709 | 336.7 |
| B | 5 | 172 | 1755878 | 5209.99 | 1758 | 1709 | 336.7 |
| B | 5 | 15 | 1600359 | 4748.09 | 1758 | 1709 | 336.7 |
| C | 15 | 214 | 703580 | 1723.19 | 1771 | 1780 | 407.3 |
| C | 0 | 239 | 678347 | 1661.24 | 1771 | 1780 | 407.3 |
| C | 0 | 10 | 471605 | 1153.61 | 1771 | 1780 | 407.3 |
| D | 8 | 195 | 3197906 | 7525.98 | 1708 | 1660 | 424.7 |
| D | 2 | 249 | 2426805 | 5710.32 | 1708 | 1660 | 424.7 |
| D | 2 | 250 | 995235 | 2339.5 | 1708 | 1660 | 424.7 |
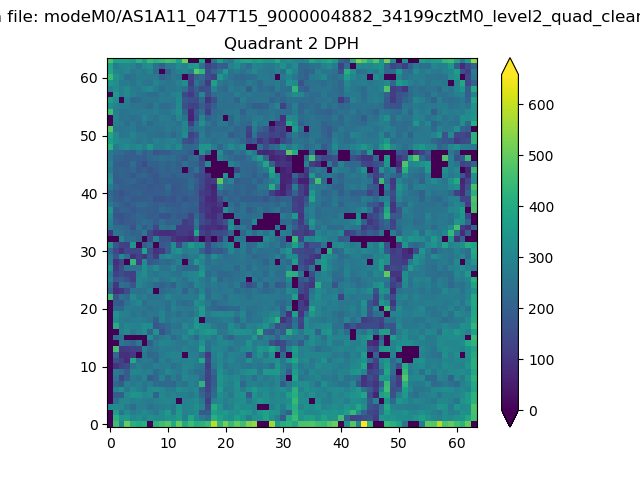
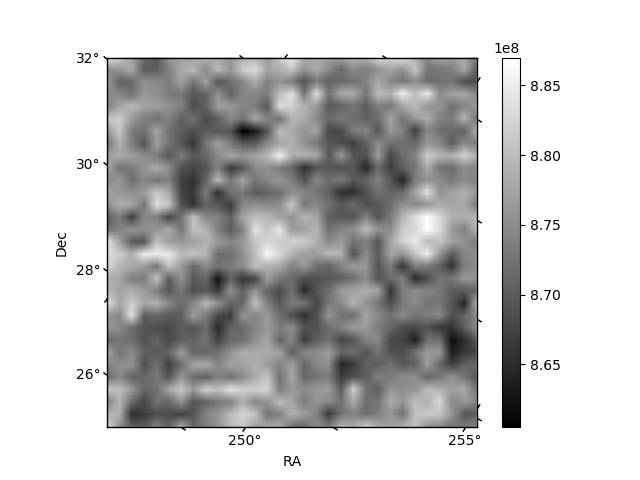
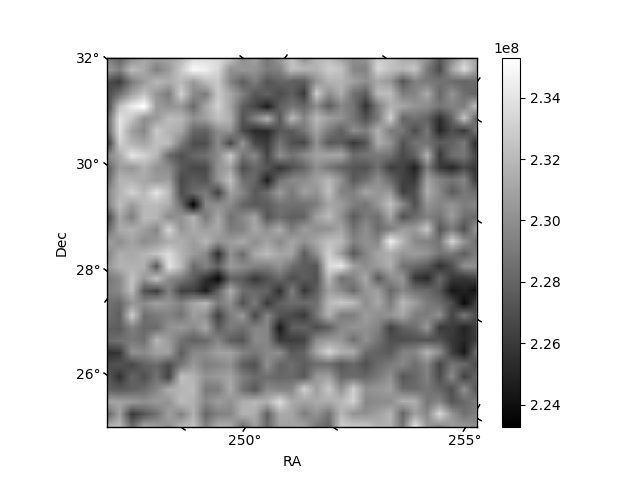
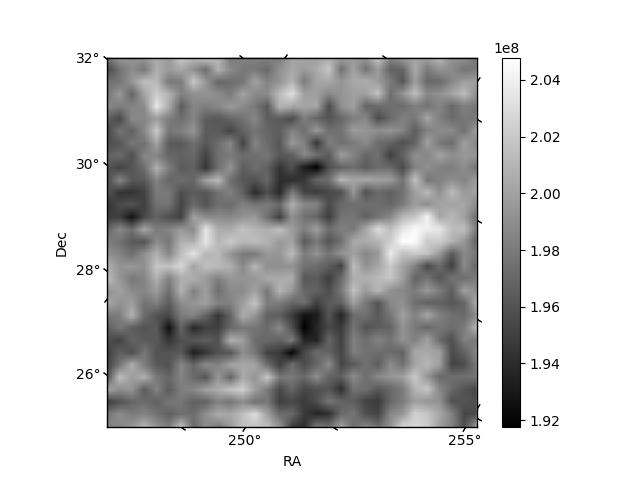
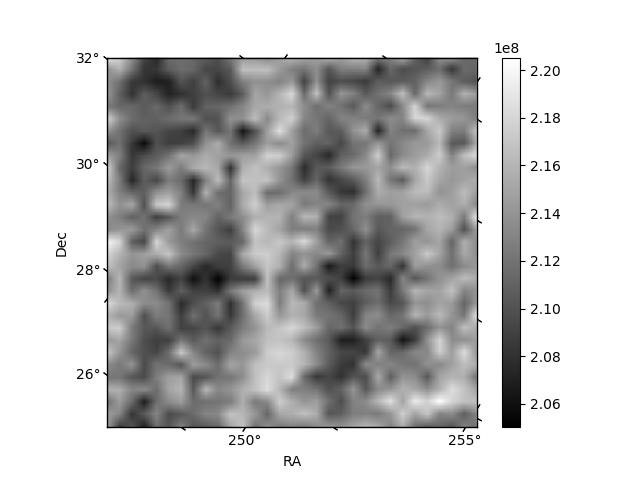
Histogram calculated using DETX and DETY for each event in the final _common_clean file
| Quadrant A | 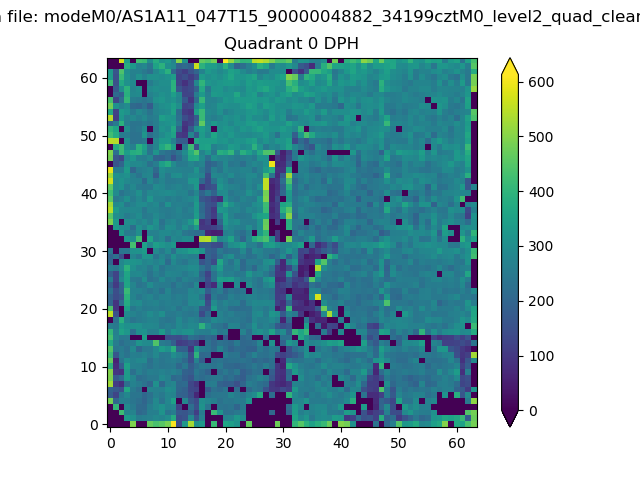 |
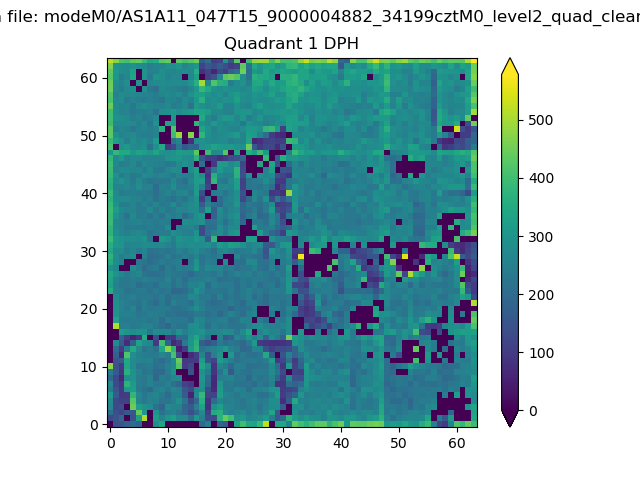 |
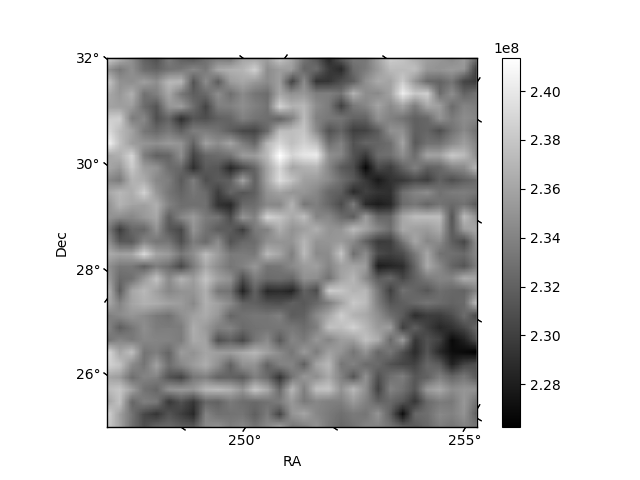
Quadrant B |
|---|---|---|---|
| Quadrant D | 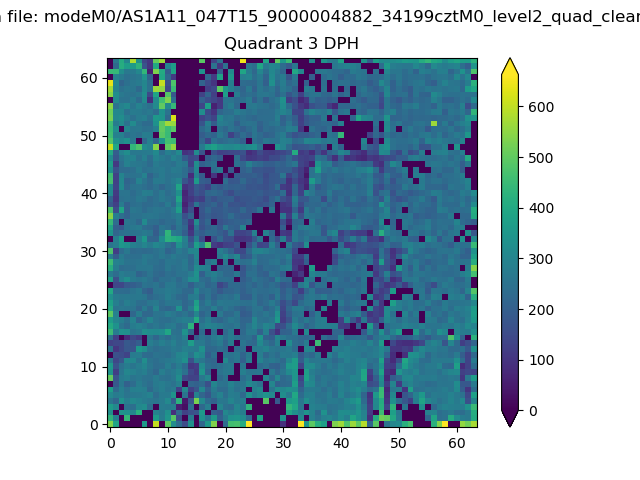 |
 |
Quadrant C |
| Plot type | Count rate plots | Images |
|---|---|---|
| Comparison with Poisson distribution Blue bars denote a histogram of data divided into 1 sec bins. Red curve is a Poisson curve with rate = median count rate of data. |
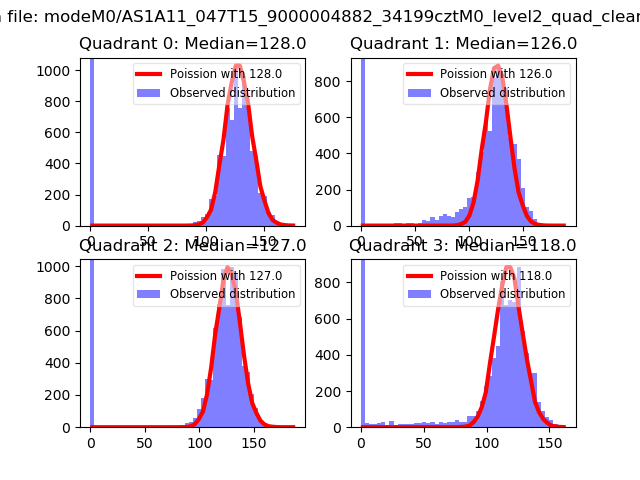 |
 |
| Quadrant-wise count rates Data is divided into 100 sec bins |
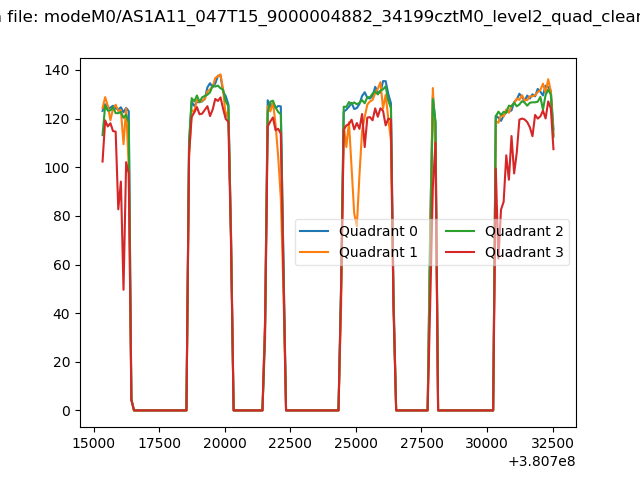 |
|
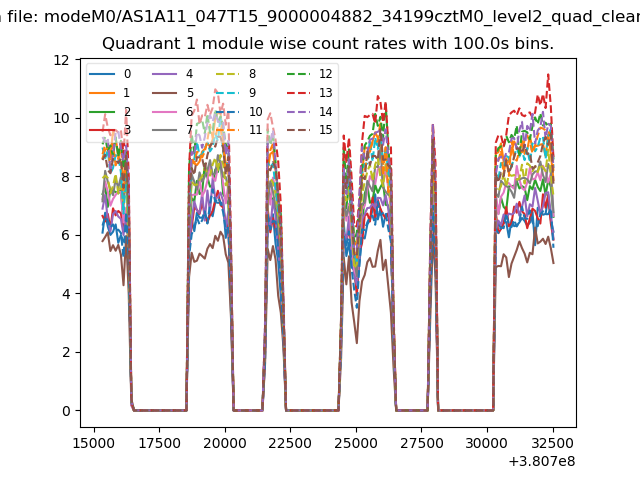
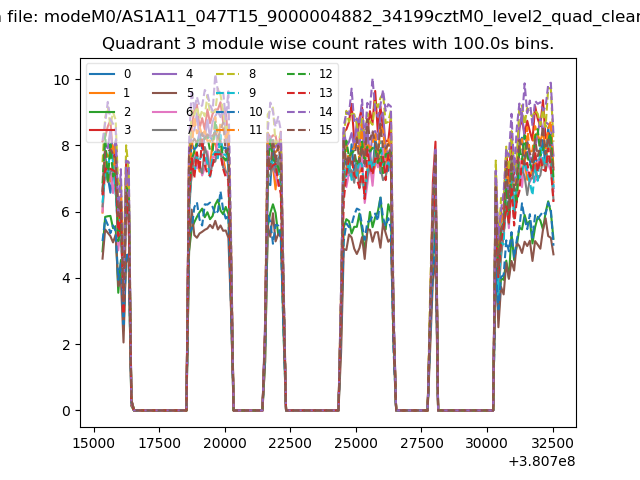
| Module-wise count rates for Quadrant A Data is divided into 100 sec bins |
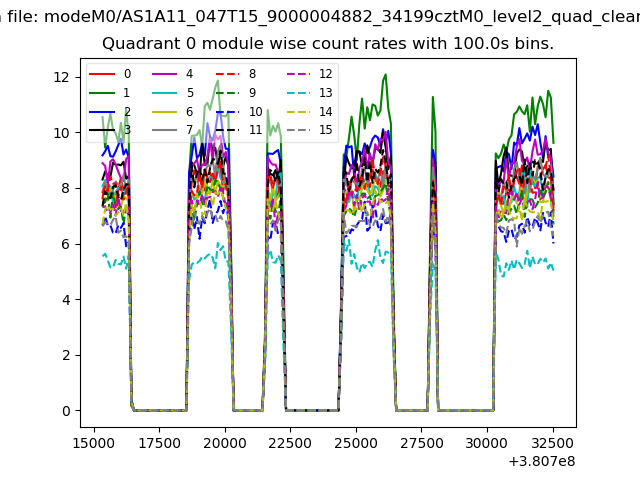 |
 |
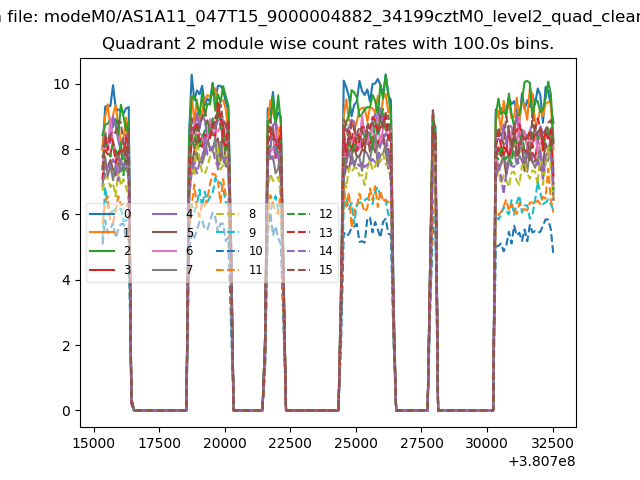
| Module-wise count rates for Quadrant B Data is divided into 100 sec bins |
 |
 |
| Module-wise count rates for Quadrant C Data is divided into 100 sec bins |
 |
 |
| Module-wise count rates for Quadrant D Data is divided into 100 sec bins |
 |
 |
| Parameter | Plot |
|---|---|
| CZT HV Monitor | 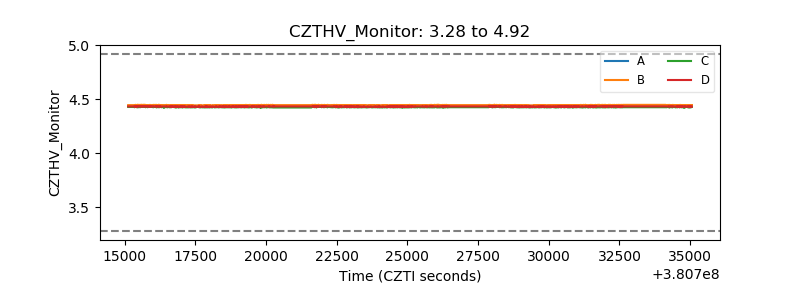 |
| D_VDD | 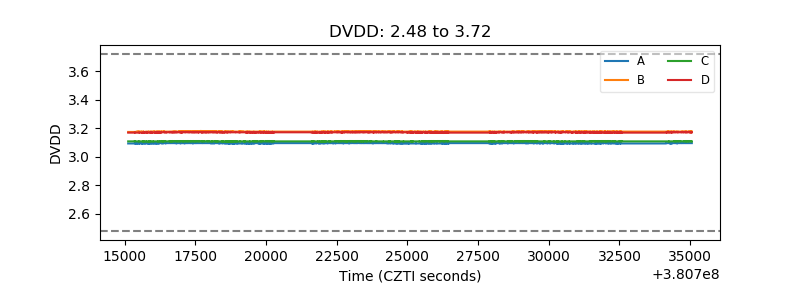 |
| Temperature 1 | 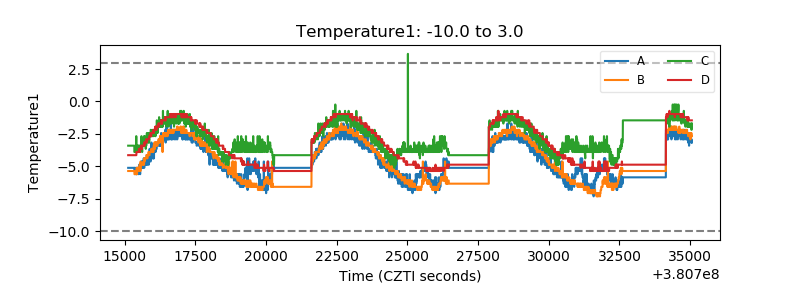 |
| Veto HV Monitor | 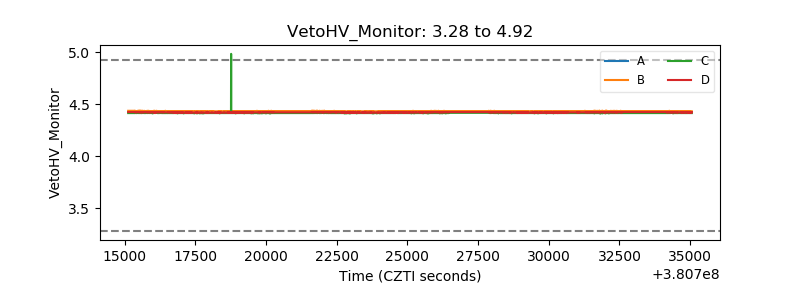 |
| Veto LLD | 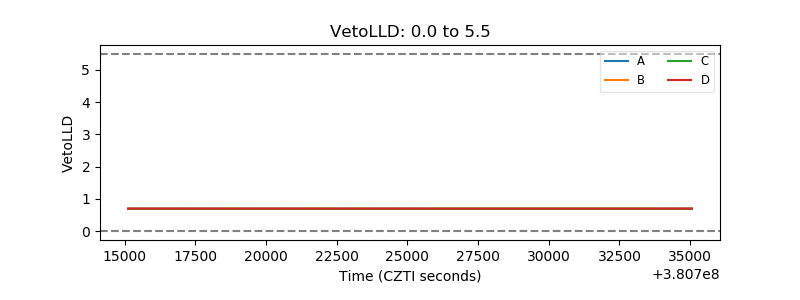 |
| Alpha Counter | 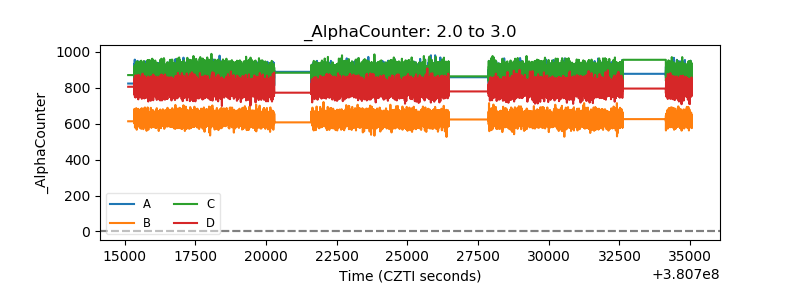 |
| _CPM_Rate | 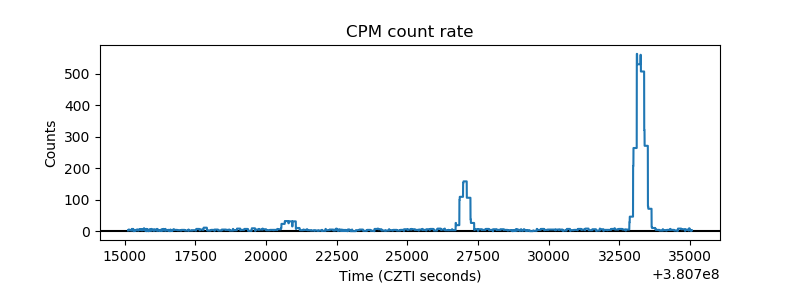 |
| CZT Counter | 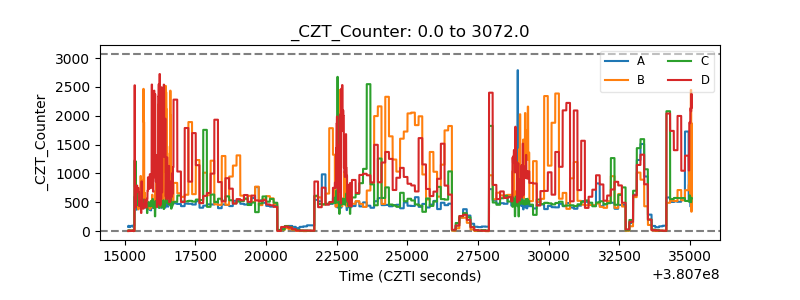 |
| +2.5 Volts monitor | 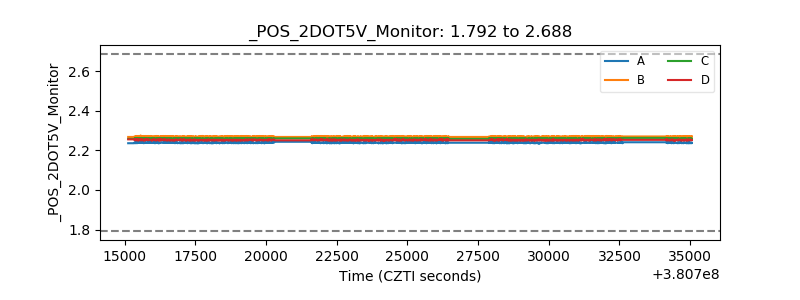 |
| +5 Volts monitor | 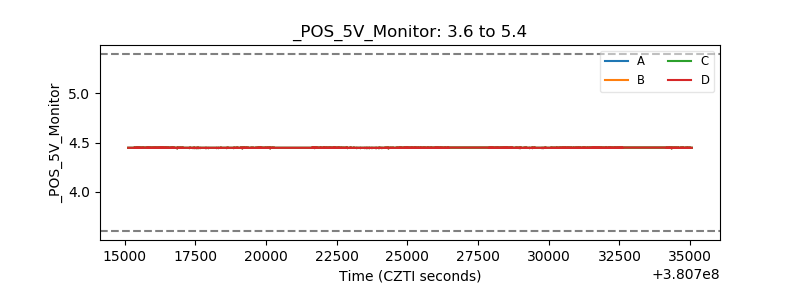 |
| _ROLL_ROT | 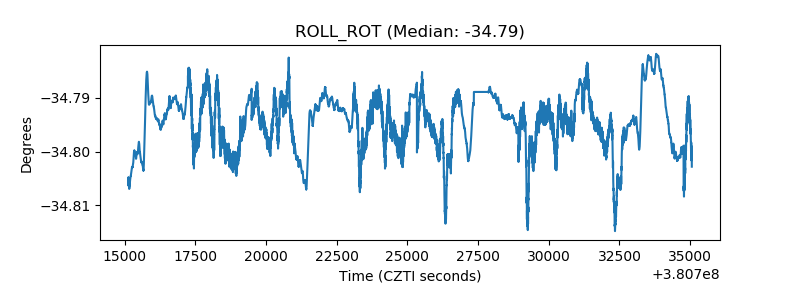 |
| _Roll_DEC | 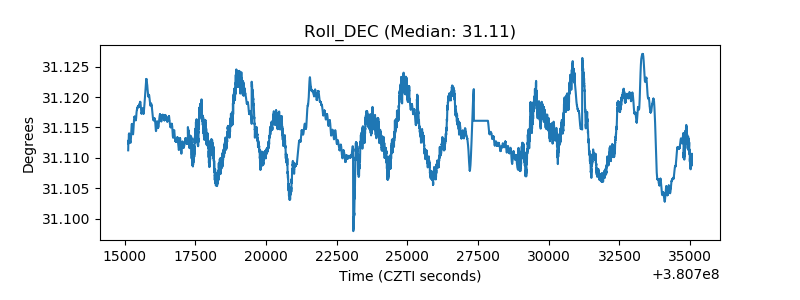 |
| _Roll_RA | 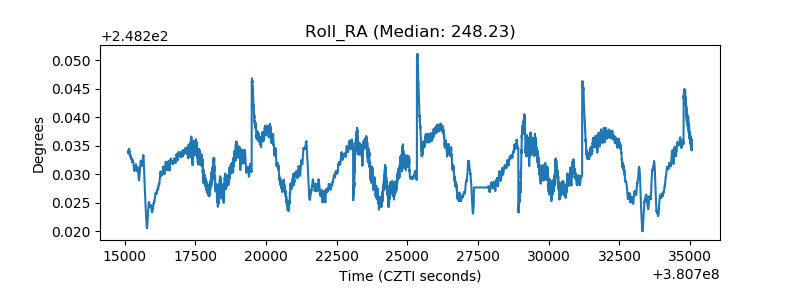 |
| Veto Counter | 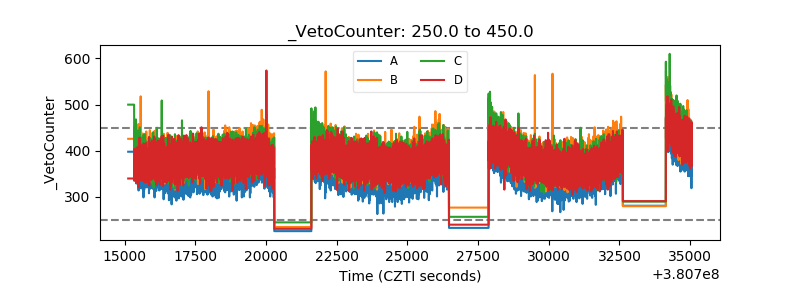 |