| Param | Original file | Final file |
|---|---|---|
| Filename | modeM0/AS1A11_047T15_9000004882_34192cztM0_level2.evt | modeM0/AS1A11_047T15_9000004882_34192cztM0_level2_quad_clean.evt |
| Size (bytes) | 529,473,600 | 88,418,880 |
| Size | 504.9 MB | 84.3 MB |
| Events in quadrant A | 2,508,785 | 601,703 |
| Events in quadrant B | 3,924,305 | 600,746 |
| Events in quadrant C | 5,695,931 | 548,809 |
| Events in quadrant D | 3,548,276 | 555,806 |
| Mode SS | |||
|---|---|---|---|
| Quadrant | BADHDUFLAG | Total packets | Discarded packets |
| A | 0 | 108 | 0 |
| B | 0 | 108 | 0 |
| C | 0 | 108 | 0 |
| D | 0 | 108 | 0 |
| Mode M9 | |||
|---|---|---|---|
| Quadrant | BADHDUFLAG | Total packets | Discarded packets |
| A | 0 | 35 | 0 |
| B | 0 | 35 | 0 |
| C | 0 | 35 | 0 |
| D | 0 | 36 | 0 |
| Mode M0 | |||
|---|---|---|---|
| Quadrant | BADHDUFLAG | Total packets | Discarded packets |
| A | 0 | 10852 | 3 |
| B | 0 | 15225 | 2 |
| C | 0 | 20448 | 2 |
| D | 0 | 14215 | 2 |
| Quadrant | Total seconds | Saturated seconds | Saturation percentage |
|---|---|---|---|
| A | 5286 | 13 | 0.245933% |
| B | 5286 | 238 | 4.502459% |
| C | 5286 | 818 | 15.474839% |
| D | 5286 | 100 | 1.891790% |
Noise dominated data is calculated using 1-second bins in cleaned event files. If a bin has >2000 counts, and if more than 50% of those come from <1% of pixels, then it is considered to be noise-dominated and hence unusable.
| Quadrant | # 1 sec bins | Bins with >0 counts | Bins with >2000 counts | High rate bins dominated by noise | Noise dominated (total time) | Noise dominated (detector-on time) | Marked lightcurve |
|---|---|---|---|---|---|---|---|
| A | 7408 | 5287 | 3 | 3 | 0.04% | 0.06% | 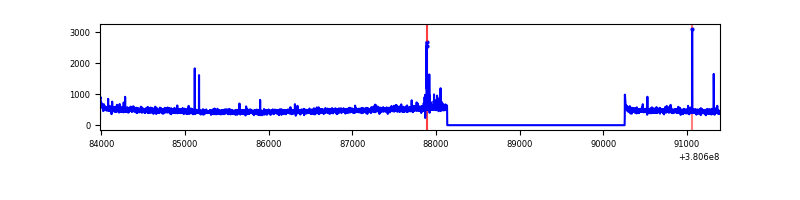 |
| B | 7408 | 5287 | 154 | 154 | 2.08% | 2.91% | 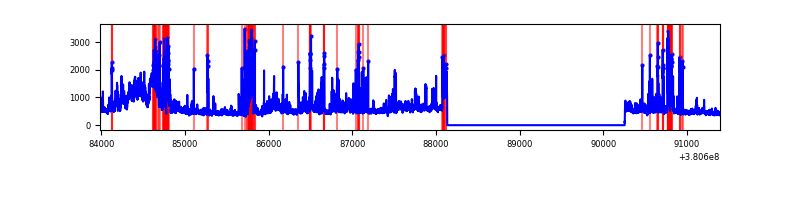 |
| C | 7408 | 5287 | 770 | 770 | 10.39% | 14.56% | 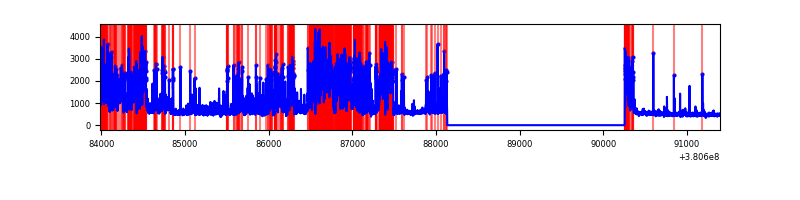 |
| D | 7408 | 5287 | 78 | 78 | 1.05% | 1.48% | 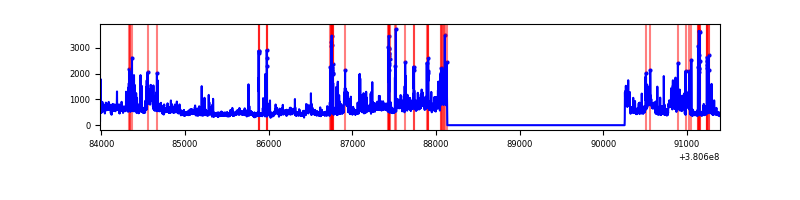 |
Top three noisy pixels from each quadrant. If the there are fewer than three noisy pixels in the level2.evt file, extra rows are filled as -1
| Pixel properties | Quadrant properties | ||||||
|---|---|---|---|---|---|---|---|
| Quadrant | DetID | PixID | Counts | Sigma | Mean | Median | Sigma |
| A | 9 | 143 | 25606 | 196.77 | 631 | 620 | 127.0 |
| A | 10 | 83 | 21430 | 163.89 | 631 | 620 | 127.0 |
| A | 13 | 6 | 13781 | 103.65 | 631 | 620 | 127.0 |
| B | 5 | 172 | 658139 | 5556.97 | 626 | 611 | 118.3 |
| B | 5 | 31 | 284430 | 2398.64 | 626 | 611 | 118.3 |
| B | 0 | 189 | 180335 | 1518.9 | 626 | 611 | 118.3 |
| C | 0 | 239 | 2714559 | 20191.28 | 580 | 585 | 134.4 |
| C | 0 | 10 | 263266 | 1954.28 | 580 | 585 | 134.4 |
| C | 15 | 214 | 232348 | 1724.26 | 580 | 585 | 134.4 |
| D | 8 | 195 | 521950 | 3533.18 | 601 | 584 | 147.6 |
| D | 2 | 249 | 173598 | 1172.47 | 601 | 584 | 147.6 |
| D | 13 | 249 | 123938 | 835.94 | 601 | 584 | 147.6 |
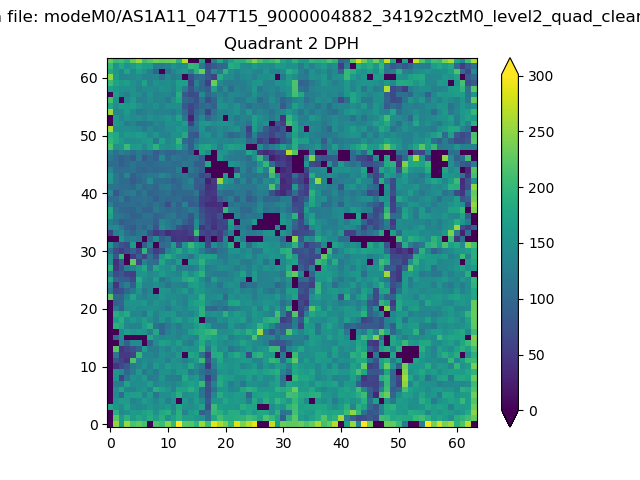
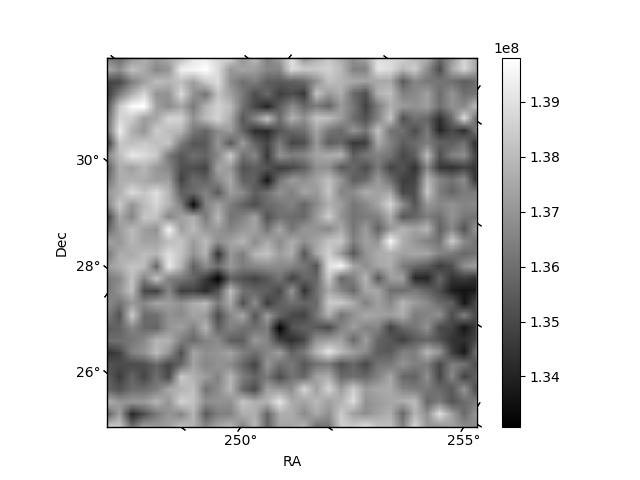
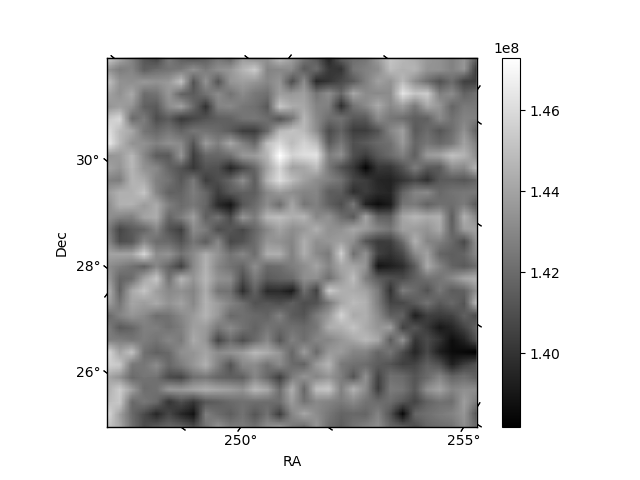
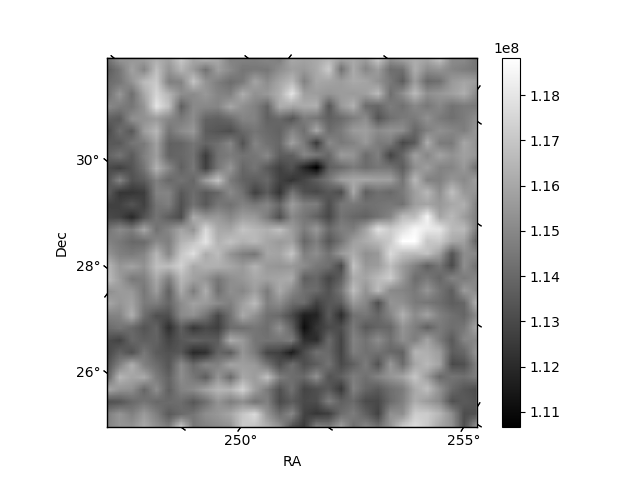
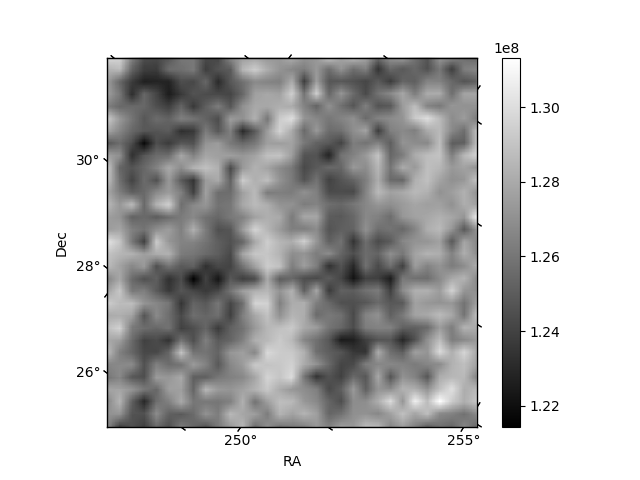
Histogram calculated using DETX and DETY for each event in the final _common_clean file
| Quadrant A | 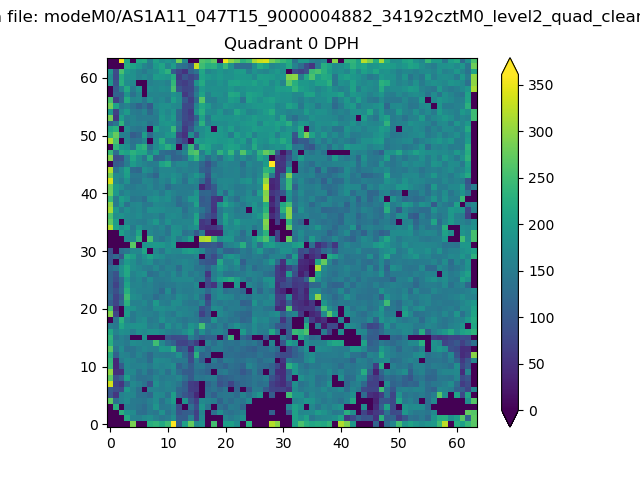 |
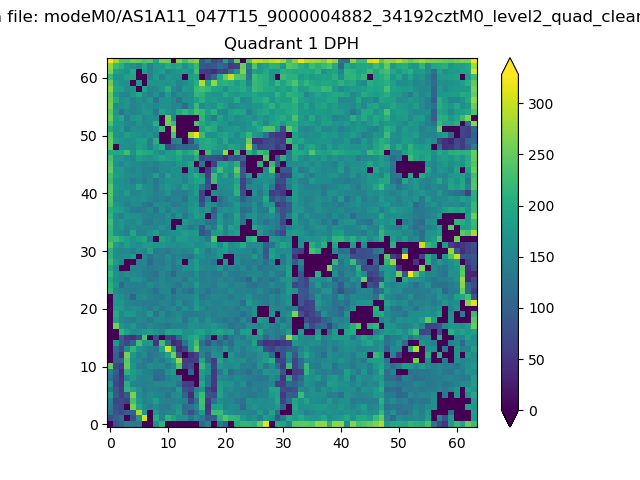 |
Quadrant B |
|---|---|---|---|
| Quadrant D | 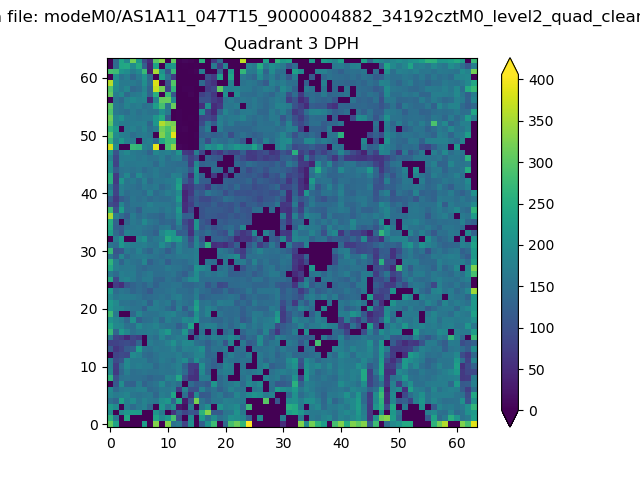 |
 |
Quadrant C |
| Plot type | Count rate plots | Images |
|---|---|---|
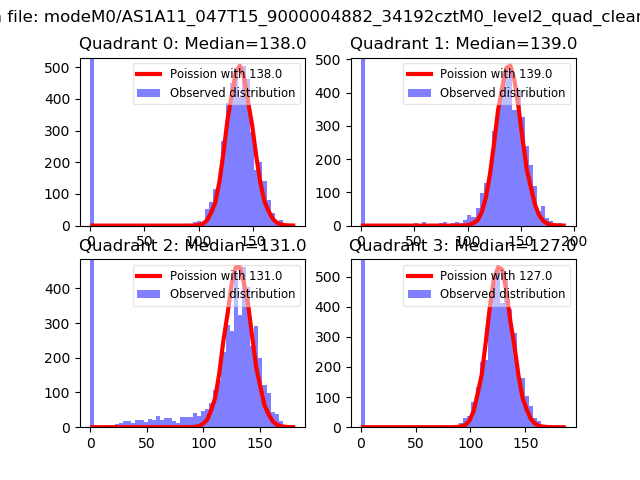
| Comparison with Poisson distribution Blue bars denote a histogram of data divided into 1 sec bins. Red curve is a Poisson curve with rate = median count rate of data. |
 |
 |
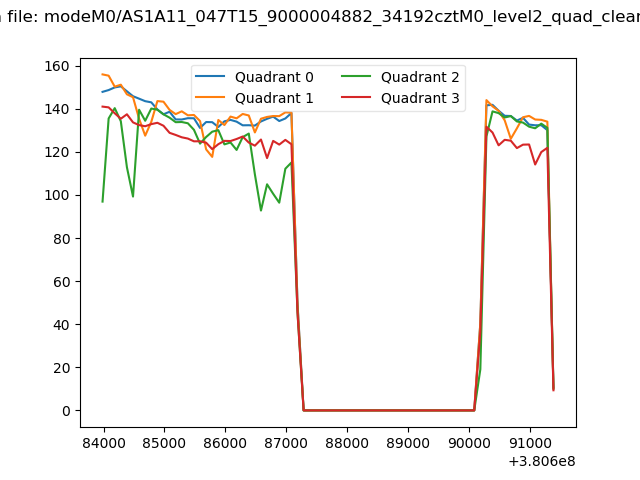
| Quadrant-wise count rates Data is divided into 100 sec bins |
 |
|
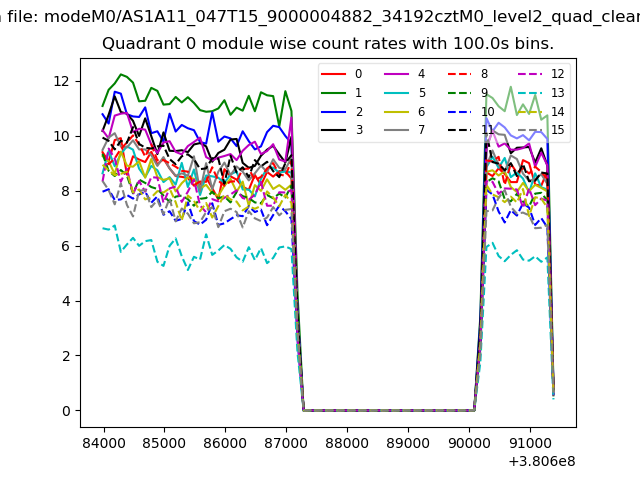
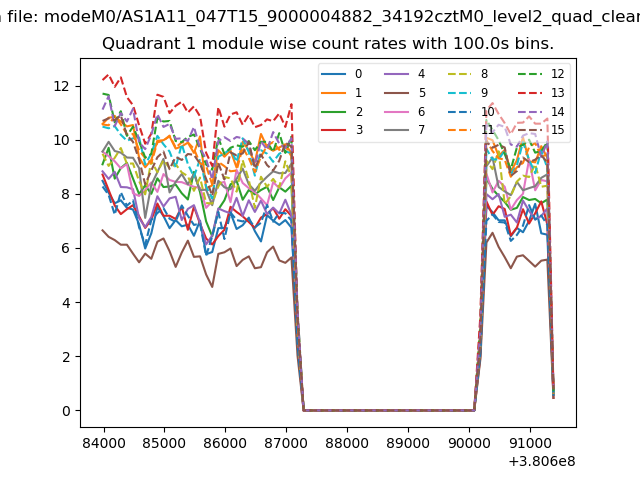
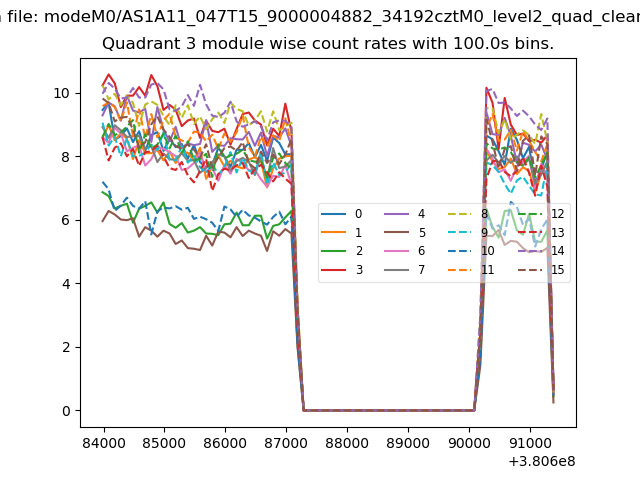
| Module-wise count rates for Quadrant A Data is divided into 100 sec bins |
 |
 |
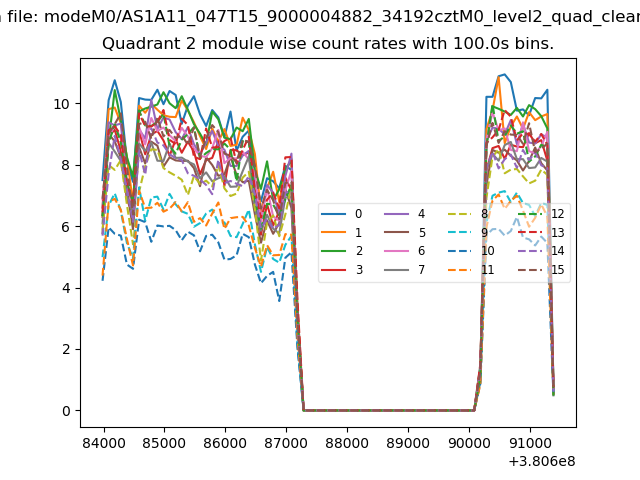
| Module-wise count rates for Quadrant B Data is divided into 100 sec bins |
 |
 |
| Module-wise count rates for Quadrant C Data is divided into 100 sec bins |
 |
 |
| Module-wise count rates for Quadrant D Data is divided into 100 sec bins |
 |
 |
| Parameter | Plot |
|---|---|
| CZT HV Monitor | 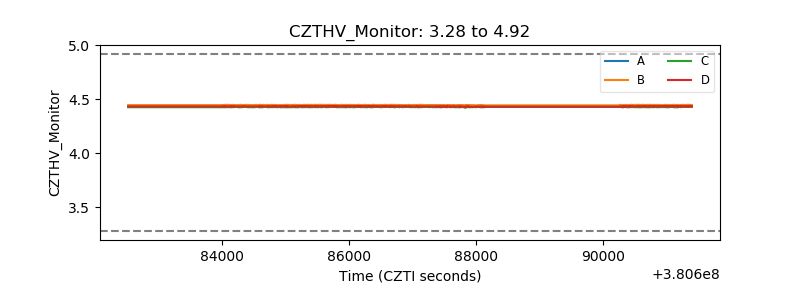 |
| D_VDD | 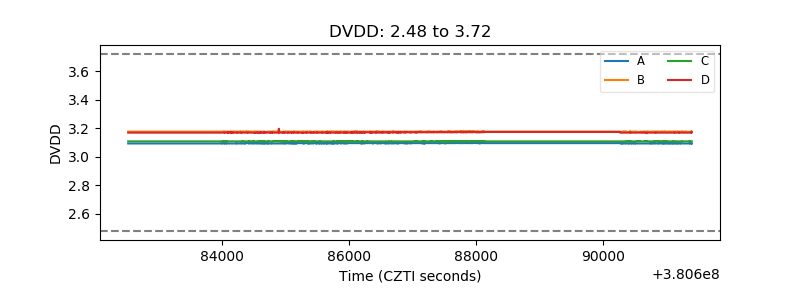 |
| Temperature 1 | 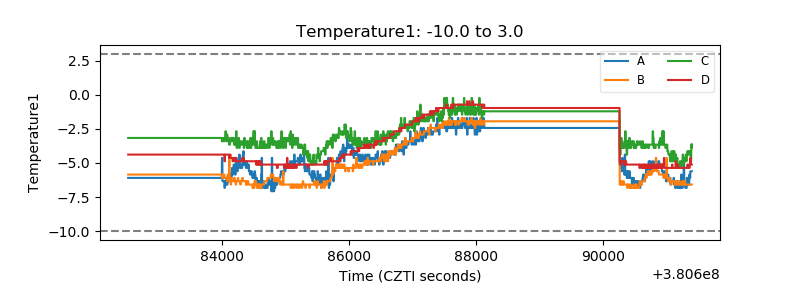 |
| Veto HV Monitor | 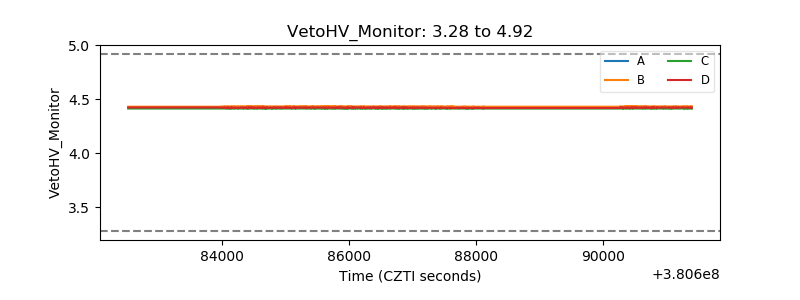 |
| Veto LLD | 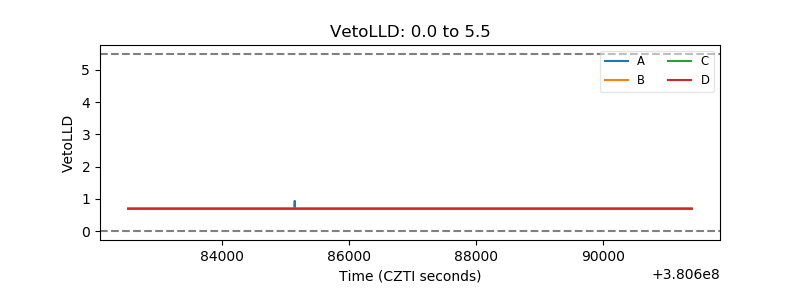 |
| Alpha Counter | 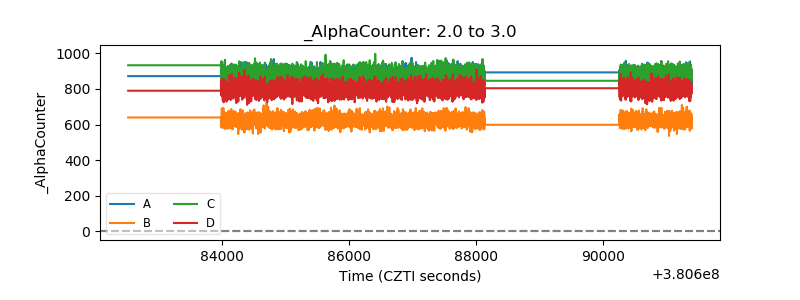 |
| _CPM_Rate | 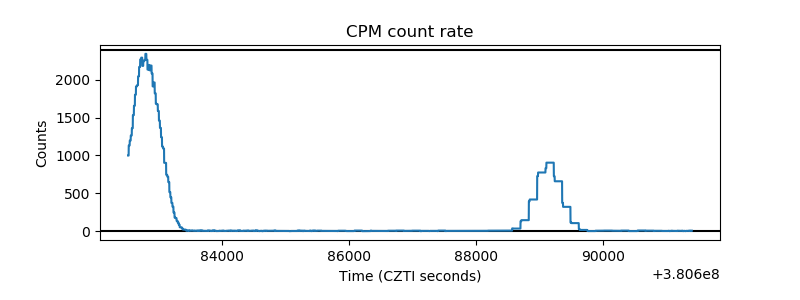 |
| CZT Counter | 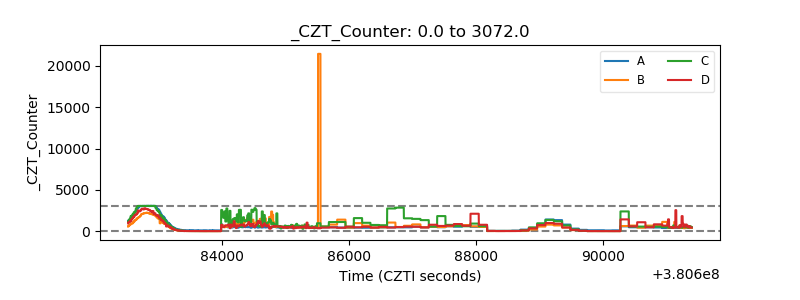 |
| +2.5 Volts monitor | 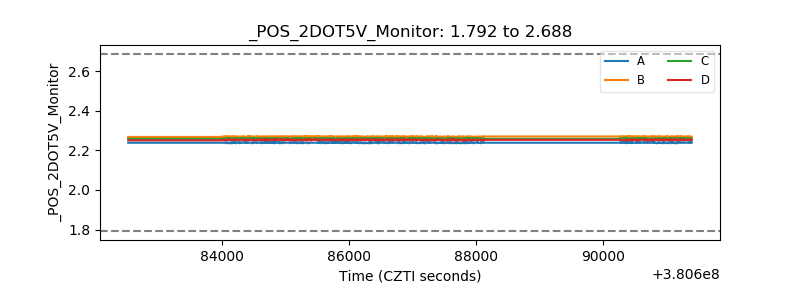 |
| +5 Volts monitor | 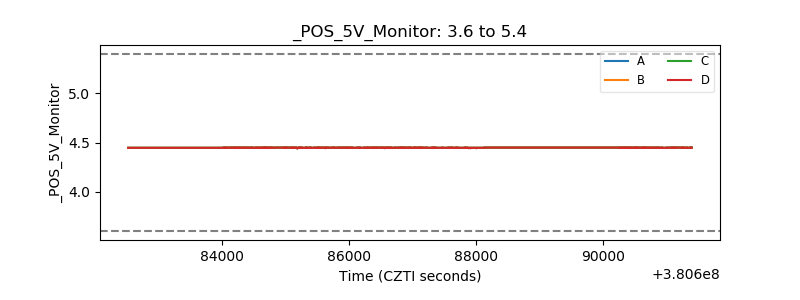 |
| _ROLL_ROT | 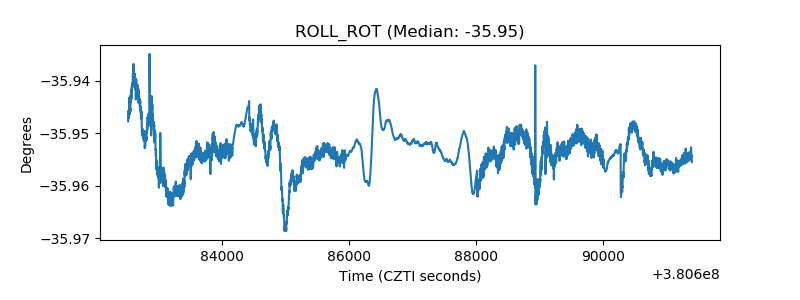 |
| _Roll_DEC | 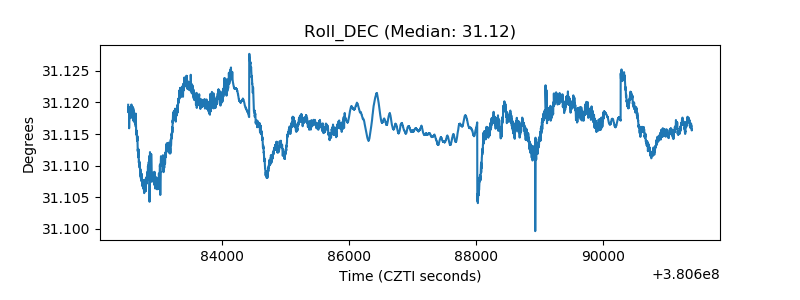 |
| _Roll_RA | 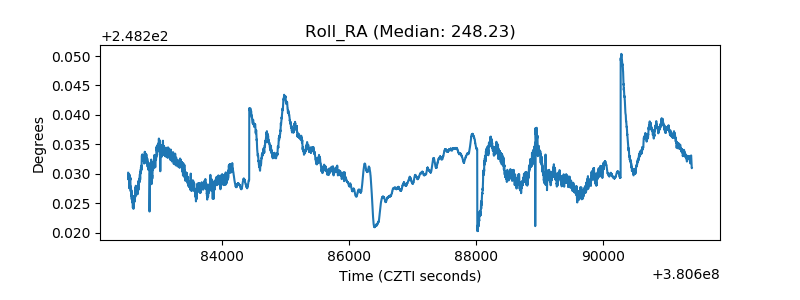 |
| Veto Counter | 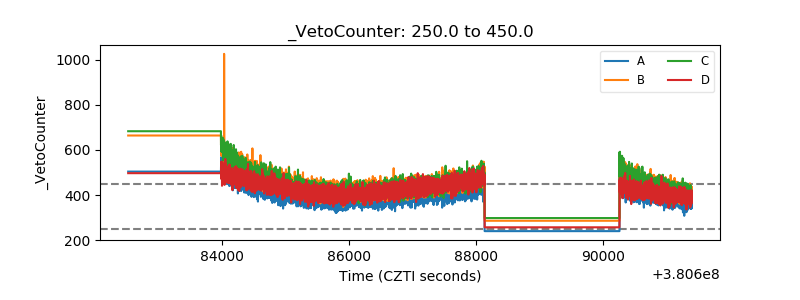 |