| Param | Original file | Final file |
|---|---|---|
| Filename | modeM0/AS1A11_065T07_9000004828cztM0_level2_bc.evt | modeM0/AS1A11_065T07_9000004828cztM0_level2_quad_clean.evt |
| Size (bytes) | 835,536,960 | 236,793,600 |
| Size | 796.8 MB | 225.8 MB |
| Events in quadrant A | 3,942,619 | 1,528,710 |
| Events in quadrant B | 4,511,110 | 1,576,697 |
| Events in quadrant C | 5,041,592 | 1,579,744 |
| Events in quadrant D | 10,820,703 | 1,488,146 |
| Mode M9 | |||
|---|---|---|---|
| Quadrant | BADHDUFLAG | Total packets | Discarded packets |
| A | 0 | 82 | 0 |
| B | 0 | 82 | 0 |
| C | 0 | 82 | 0 |
| D | 0 | 82 | 0 |
| Mode M0 | |||
|---|---|---|---|
| Quadrant | BADHDUFLAG | Total packets | Discarded packets |
| A | 0 | 34206 | 0 |
| B | 0 | 35261 | 0 |
| C | 0 | 35857 | 0 |
| D | 0 | 55283 | 0 |
| Mode SS | |||
|---|---|---|---|
| Quadrant | BADHDUFLAG | Total packets | Discarded packets |
| A | 0 | 296 | 0 |
| B | 0 | 296 | 0 |
| C | 0 | 296 | 0 |
| D | 0 | 296 | 0 |
| Quadrant | Total seconds | Saturated seconds | Saturation percentage |
|---|---|---|---|
| A | 14471 | 595 | 4.111672% |
| B | 14471 | 442 | 3.054385% |
| C | 14471 | 267 | 1.845069% |
| D | 14471 | 996 | 6.882731% |
Noise dominated data is calculated using 1-second bins in cleaned event files. If a bin has >2000 counts, and if more than 50% of those come from <1% of pixels, then it is considered to be noise-dominated and hence unusable.
| Quadrant | # 1 sec bins | Bins with >0 counts | Bins with >2000 counts | High rate bins dominated by noise | Noise dominated (total time) | Noise dominated (detector-on time) | Marked lightcurve |
|---|---|---|---|---|---|---|---|
| A | 22601 | 14471 | 26 | 26 | 0.12% | 0.18% |  |
| B | 22601 | 14472 | 16 | 16 | 0.07% | 0.11% |  |
| C | 22601 | 14471 | 24 | 24 | 0.11% | 0.17% |  |
| D | 22601 | 14471 | 139 | 139 | 0.62% | 0.96% |  |
Top three noisy pixels from each quadrant. If the there are fewer than three noisy pixels in the level2.evt file, extra rows are filled as -1
| Pixel properties | Quadrant properties | ||||||
|---|---|---|---|---|---|---|---|
| Quadrant | DetID | PixID | Counts | Sigma | Mean | Median | Sigma |
| A | 15 | 169 | 469307 | 2700.18 | 796 | 786 | 173.5 |
| A | 0 | 254 | 303891 | 1746.86 | 796 | 786 | 173.5 |
| A | 13 | 6 | 39600 | 223.69 | 796 | 786 | 173.5 |
| B | 5 | 172 | 1078095 | 6684.94 | 814 | 799 | 161.2 |
| B | 0 | 190 | 70606 | 433.17 | 814 | 799 | 161.2 |
| B | 5 | 200 | 41465 | 252.34 | 814 | 799 | 161.2 |
| C | 15 | 214 | 590443 | 3225.62 | 802 | 800 | 182.8 |
| C | 14 | 254 | 413284 | 2256.48 | 802 | 800 | 182.8 |
| C | 9 | 187 | 252348 | 1376.08 | 802 | 800 | 182.8 |
| D | 8 | 195 | 3162348 | 16702.38 | 798 | 778 | 189.3 |
| D | 12 | 235 | 2660892 | 14053.22 | 798 | 778 | 189.3 |
| D | 2 | 250 | 649150 | 3425.31 | 798 | 778 | 189.3 |
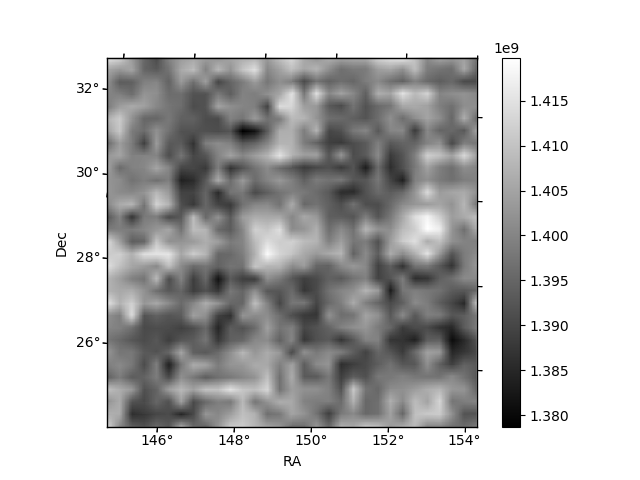
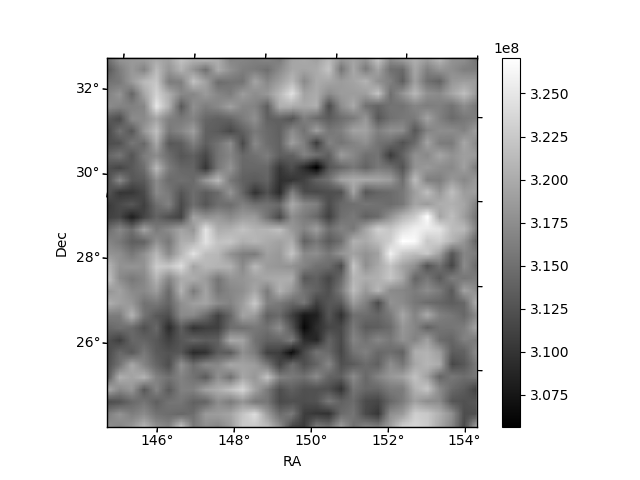
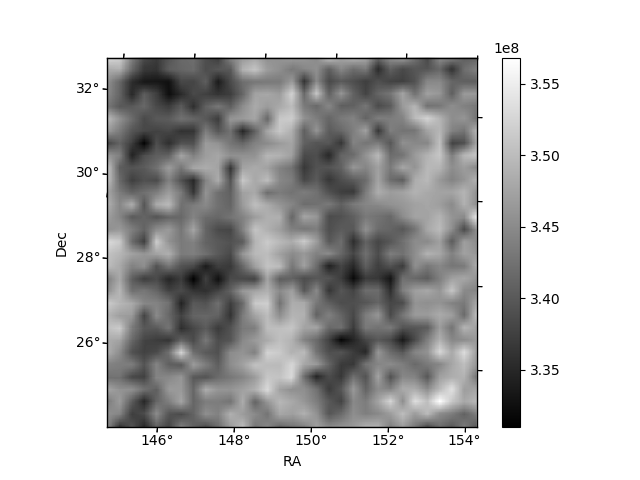
Histogram calculated using DETX and DETY for each event in the final _common_clean file
| Quadrant A |  |
 |
Quadrant B |
|---|---|---|---|
| Quadrant D |  |
 |
Quadrant C |
| Plot type | Count rate plots | Images |
|---|---|---|
| Comparison with Poisson distribution Blue bars denote a histogram of data divided into 1 sec bins. Red curve is a Poisson curve with rate = median count rate of data. |
 |
 |
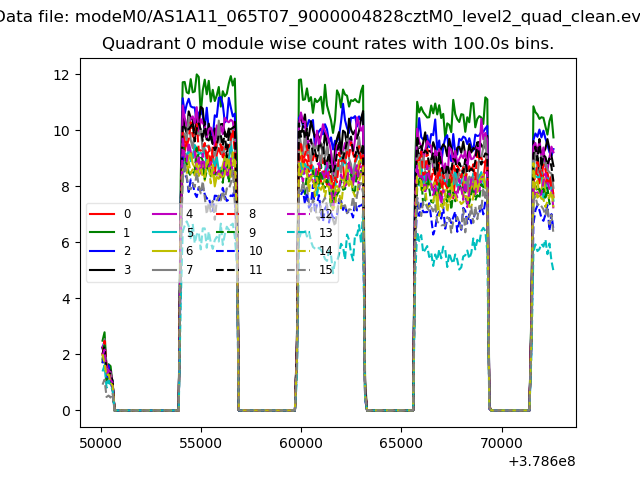
| Quadrant-wise count rates Data is divided into 100 sec bins |
 |
|
| Module-wise count rates for Quadrant A Data is divided into 100 sec bins |
 |
 |
| Module-wise count rates for Quadrant B Data is divided into 100 sec bins |
 |
 |
| Module-wise count rates for Quadrant C Data is divided into 100 sec bins |
 |
 |
| Module-wise count rates for Quadrant D Data is divided into 100 sec bins |
 |
 |
| Parameter | Plot |
|---|---|
| CZT HV Monitor |  |
| D_VDD |  |
| Temperature 1 |  |
| Veto HV Monitor |  |
| Veto LLD |  |
| Alpha Counter | 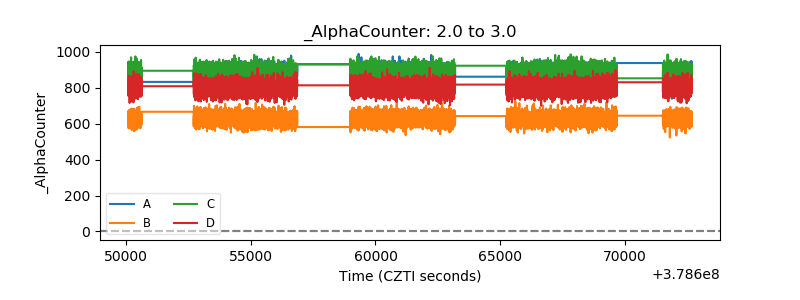 |
| _CPM_Rate |  |
| CZT Counter |  |
| +2.5 Volts monitor |  |
| +5 Volts monitor |  |
| _ROLL_ROT | 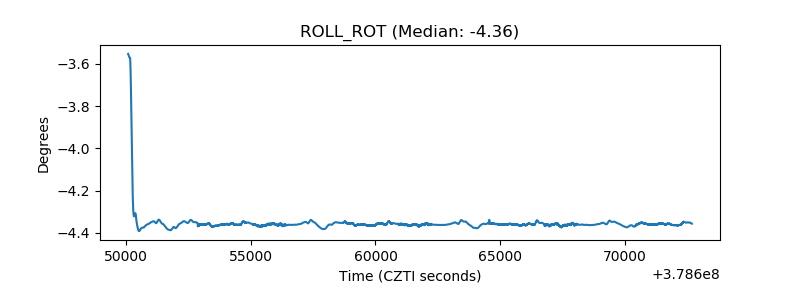 |
| _Roll_DEC |  |
| _Roll_RA |  |
| Veto Counter |  |