| Param | Original file | Final file |
|---|---|---|
| Filename | modeM0/AS1A11_106T03_9000004826cztM0_level2_bc.evt | modeM0/AS1A11_106T03_9000004826cztM0_level2_quad_clean.evt |
| Size (bytes) | 5,926,541,760 | 1,496,361,600 |
| Size | 5.5 GB | 1.4 GB |
| Events in quadrant A | 30,466,362 | 9,630,398 |
| Events in quadrant B | 35,828,066 | 9,536,835 |
| Events in quadrant C | 36,534,696 | 9,623,749 |
| Events in quadrant D | 69,190,740 | 8,990,511 |
| Mode M9 | |||
|---|---|---|---|
| Quadrant | BADHDUFLAG | Total packets | Discarded packets |
| A | 0 | 416 | 0 |
| B | 0 | 416 | 0 |
| C | 0 | 416 | 0 |
| D | 0 | 417 | 0 |
| Mode SS | |||
|---|---|---|---|
| Quadrant | BADHDUFLAG | Total packets | Discarded packets |
| A | 0 | 2246 | 0 |
| B | 0 | 2246 | 0 |
| C | 0 | 2246 | 0 |
| D | 0 | 2246 | 0 |
| Mode M0 | |||
|---|---|---|---|
| Quadrant | BADHDUFLAG | Total packets | Discarded packets |
| A | 0 | 255972 | 0 |
| B | 0 | 276104 | 0 |
| C | 0 | 263150 | 0 |
| D | 0 | 379895 | 0 |
| Quadrant | Total seconds | Saturated seconds | Saturation percentage |
|---|---|---|---|
| A | 110065 | 1775 | 1.612683% |
| B | 110065 | 4528 | 4.113933% |
| C | 110065 | 1359 | 1.234725% |
| D | 110065 | 6416 | 5.829283% |
Noise dominated data is calculated using 1-second bins in cleaned event files. If a bin has >2000 counts, and if more than 50% of those come from <1% of pixels, then it is considered to be noise-dominated and hence unusable.
| Quadrant | # 1 sec bins | Bins with >0 counts | Bins with >2000 counts | High rate bins dominated by noise | Noise dominated (total time) | Noise dominated (detector-on time) | Marked lightcurve |
|---|---|---|---|---|---|---|---|
| A | 162793 | 110076 | 56 | 56 | 0.03% | 0.05% |  |
| B | 162793 | 110065 | 206 | 206 | 0.13% | 0.19% |  |
| C | 162793 | 110066 | 151 | 151 | 0.09% | 0.14% |  |
| D | 162793 | 110067 | 846 | 846 | 0.52% | 0.77% |  |
Top three noisy pixels from each quadrant. If the there are fewer than three noisy pixels in the level2.evt file, extra rows are filled as -1
| Pixel properties | Quadrant properties | ||||||
|---|---|---|---|---|---|---|---|
| Quadrant | DetID | PixID | Counts | Sigma | Mean | Median | Sigma |
| A | 15 | 169 | 7236868 | 5667.16 | 5857 | 5773 | 1276.0 |
| A | 13 | 6 | 327648 | 252.26 | 5857 | 5773 | 1276.0 |
| A | 13 | 254 | 183902 | 139.6 | 5857 | 5773 | 1276.0 |
| B | 5 | 172 | 9405363 | 8225.89 | 5810 | 5697 | 1142.7 |
| B | 5 | 255 | 975945 | 849.09 | 5810 | 5697 | 1142.7 |
| B | 4 | 251 | 541287 | 468.71 | 5810 | 5697 | 1142.7 |
| C | 15 | 214 | 4485444 | 3470.6 | 5736 | 5707 | 1290.8 |
| C | 3 | 233 | 3115914 | 2409.58 | 5736 | 5707 | 1290.8 |
| C | 14 | 254 | 2798210 | 2163.44 | 5736 | 5707 | 1290.8 |
| D | 8 | 195 | 21661563 | 15536.67 | 5693 | 5540 | 1393.9 |
| D | 12 | 235 | 8898597 | 6380.14 | 5693 | 5540 | 1393.9 |
| D | 2 | 250 | 4987968 | 3574.54 | 5693 | 5540 | 1393.9 |
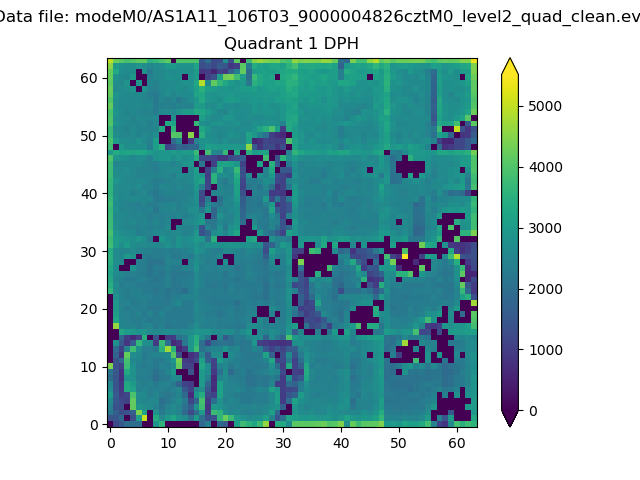
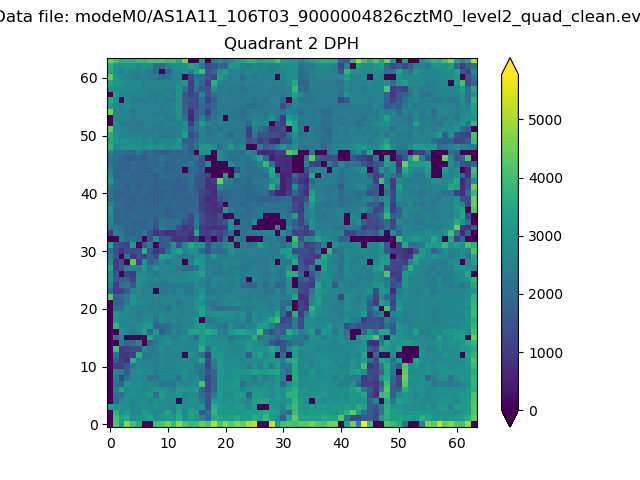
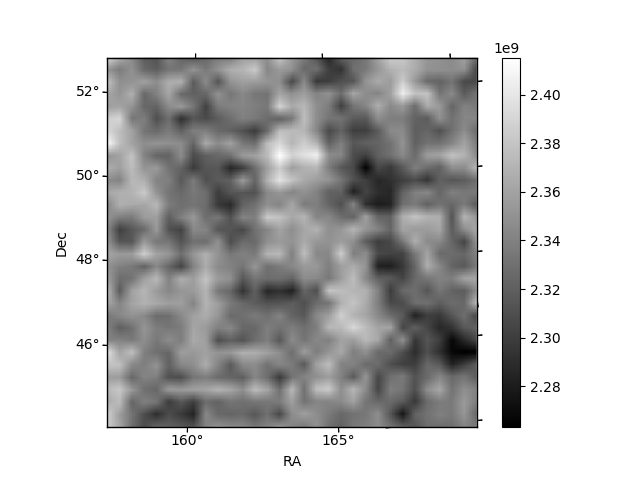
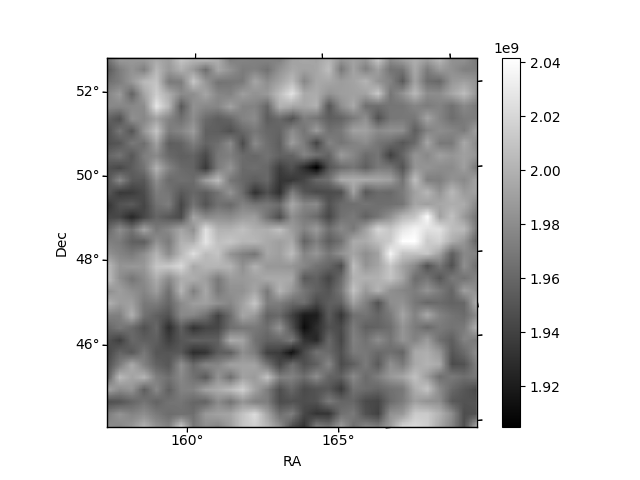
Histogram calculated using DETX and DETY for each event in the final _common_clean file
| Quadrant A |  |
 |
Quadrant B |
|---|---|---|---|
| Quadrant D | 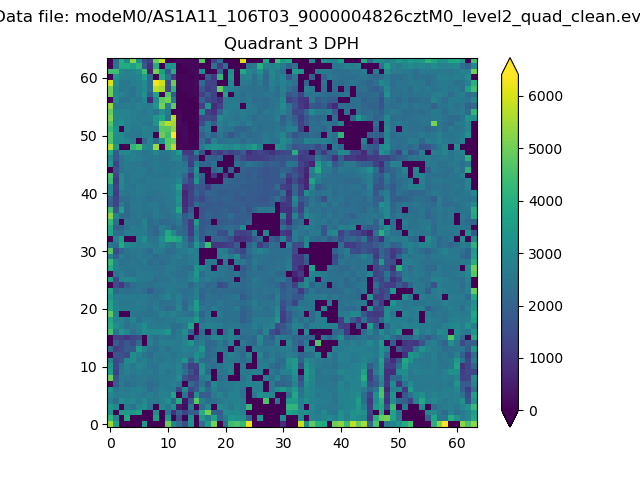 |
 |
Quadrant C |
| Plot type | Count rate plots | Images |
|---|---|---|
| Comparison with Poisson distribution Blue bars denote a histogram of data divided into 1 sec bins. Red curve is a Poisson curve with rate = median count rate of data. |
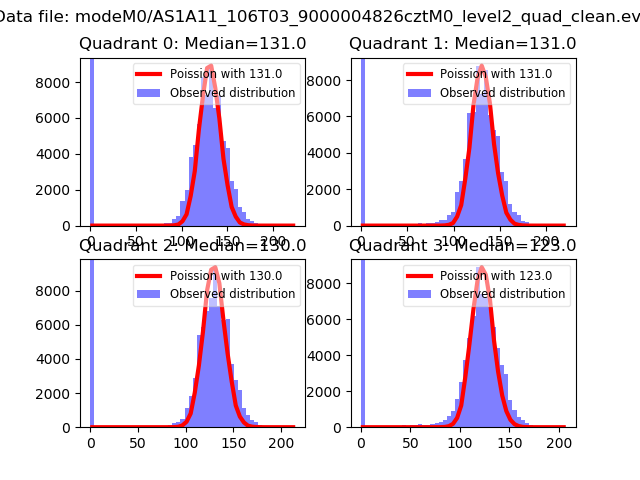 |
 |
| Quadrant-wise count rates Data is divided into 100 sec bins |
 |
|
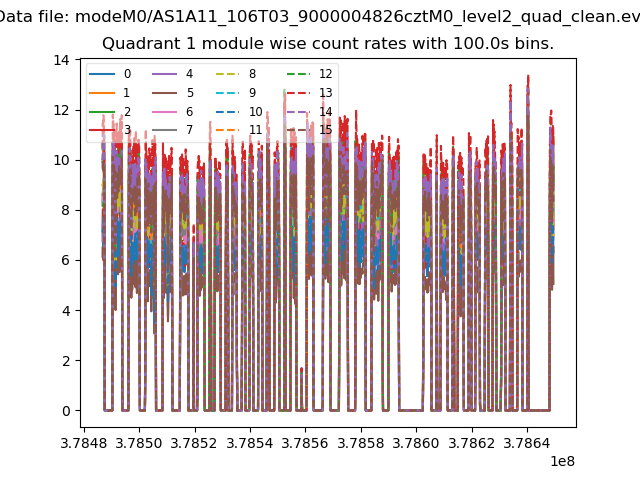
| Module-wise count rates for Quadrant A Data is divided into 100 sec bins |
 |
 |
| Module-wise count rates for Quadrant B Data is divided into 100 sec bins |
 |
 |
| Module-wise count rates for Quadrant C Data is divided into 100 sec bins |
 |
 |
| Module-wise count rates for Quadrant D Data is divided into 100 sec bins |
 |
 |
| Parameter | Plot |
|---|---|
| CZT HV Monitor |  |
| D_VDD |  |
| Temperature 1 |  |
| Veto HV Monitor |  |
| Veto LLD | 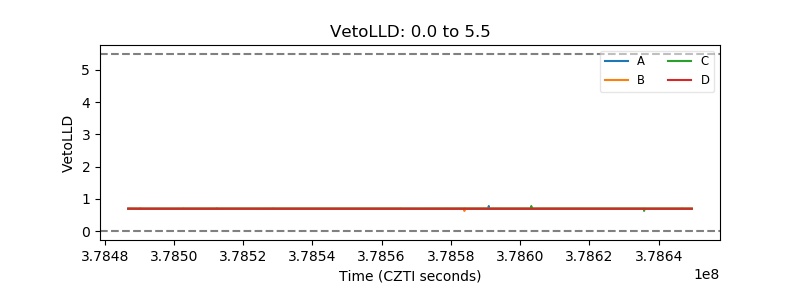 |
| Alpha Counter |  |
| _CPM_Rate |  |
| CZT Counter |  |
| +2.5 Volts monitor | 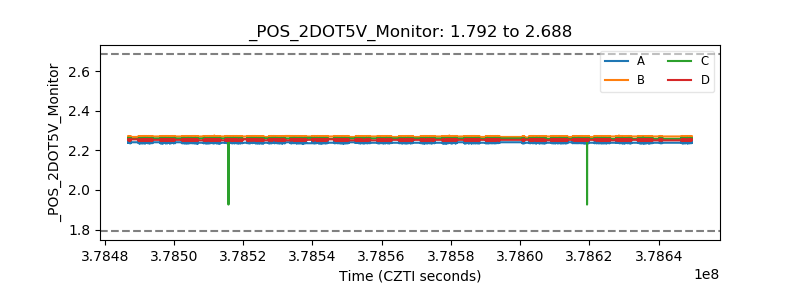 |
| +5 Volts monitor |  |
| _ROLL_ROT | 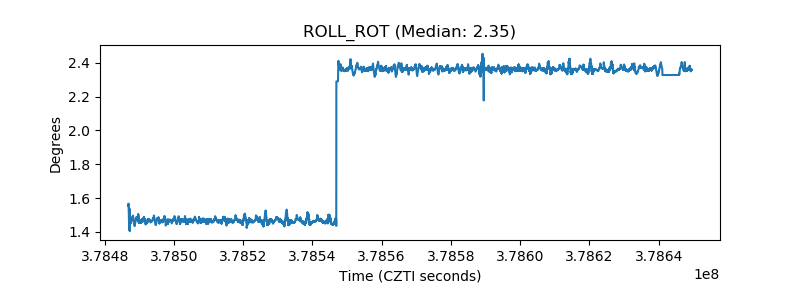 |
| _Roll_DEC |  |
| _Roll_RA |  |
| Veto Counter |  |