| Param | Original file | Final file |
|---|---|---|
| Filename | modeM0/AS1T04_091T01_9000004822cztM0_level2_bc.evt | modeM0/AS1T04_091T01_9000004822cztM0_level2_quad_clean.evt |
| Size (bytes) | 1,914,572,160 | 396,457,920 |
| Size | 1.8 GB | 378.1 MB |
| Events in quadrant A | 12,504,558 | 2,451,734 |
| Events in quadrant B | 9,861,633 | 2,574,810 |
| Events in quadrant C | 10,057,502 | 2,590,916 |
| Events in quadrant D | 23,576,359 | 2,384,241 |
| Mode SS | |||
|---|---|---|---|
| Quadrant | BADHDUFLAG | Total packets | Discarded packets |
| A | 0 | 596 | 0 |
| B | 0 | 590 | 0 |
| C | 0 | 596 | 0 |
| D | 0 | 590 | 0 |
| Mode M0 | |||
|---|---|---|---|
| Quadrant | BADHDUFLAG | Total packets | Discarded packets |
| A | 0 | 92454 | 0 |
| B | 0 | 74000 | 0 |
| C | 0 | 71728 | 0 |
| D | 0 | 116776 | 0 |
| Mode M9 | |||
|---|---|---|---|
| Quadrant | BADHDUFLAG | Total packets | Discarded packets |
| A | 0 | 141 | 0 |
| B | 0 | 144 | 0 |
| C | 0 | 140 | 0 |
| D | 0 | 139 | 0 |
| Quadrant | Total seconds | Saturated seconds | Saturation percentage |
|---|---|---|---|
| A | 29178 | 3882 | 13.304545% |
| B | 29243 | 868 | 2.968232% |
| C | 29254 | 432 | 1.476721% |
| D | 29034 | 2444 | 8.417717% |
Noise dominated data is calculated using 1-second bins in cleaned event files. If a bin has >2000 counts, and if more than 50% of those come from <1% of pixels, then it is considered to be noise-dominated and hence unusable.
| Quadrant | # 1 sec bins | Bins with >0 counts | Bins with >2000 counts | High rate bins dominated by noise | Noise dominated (total time) | Noise dominated (detector-on time) | Marked lightcurve |
|---|---|---|---|---|---|---|---|
| A | 42487 | 29585 | 126 | 126 | 0.30% | 0.43% | 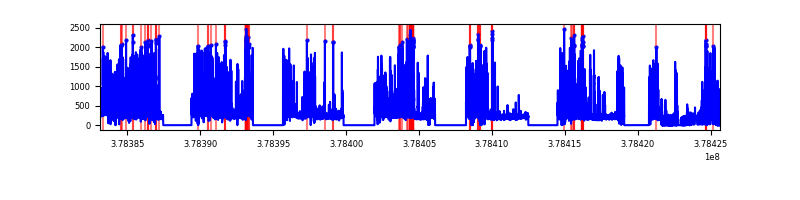 |
| B | 42487 | 29668 | 31 | 31 | 0.07% | 0.10% |  |
| C | 42487 | 29661 | 138 | 138 | 0.32% | 0.47% | 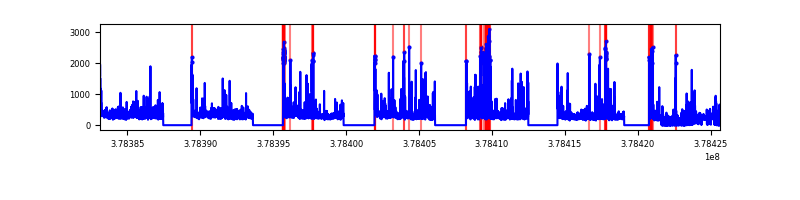 |
| D | 42474 | 29401 | 304 | 304 | 0.72% | 1.03% |  |
Top three noisy pixels from each quadrant. If the there are fewer than three noisy pixels in the level2.evt file, extra rows are filled as -1
| Pixel properties | Quadrant properties | ||||||
|---|---|---|---|---|---|---|---|
| Quadrant | DetID | PixID | Counts | Sigma | Mean | Median | Sigma |
| A | 15 | 237 | 6379747 | 19038.62 | 1541 | 1522 | 335.0 |
| A | 13 | 6 | 77414 | 226.53 | 1541 | 1522 | 335.0 |
| A | 13 | 254 | 45926 | 132.54 | 1541 | 1522 | 335.0 |
| B | 5 | 172 | 2168018 | 6834.79 | 1641 | 1612 | 317.0 |
| B | 4 | 251 | 189489 | 592.73 | 1641 | 1612 | 317.0 |
| B | 0 | 219 | 182910 | 571.98 | 1641 | 1612 | 317.0 |
| C | 15 | 214 | 1174615 | 3227.32 | 1626 | 1623 | 363.5 |
| C | 9 | 187 | 634571 | 1741.47 | 1626 | 1623 | 363.5 |
| C | 3 | 233 | 608997 | 1671.1 | 1626 | 1623 | 363.5 |
| D | 8 | 195 | 8389535 | 22145.81 | 1584 | 1540 | 378.8 |
| D | 12 | 235 | 4397044 | 11604.92 | 1584 | 1540 | 378.8 |
| D | 2 | 250 | 1803098 | 4756.44 | 1584 | 1540 | 378.8 |
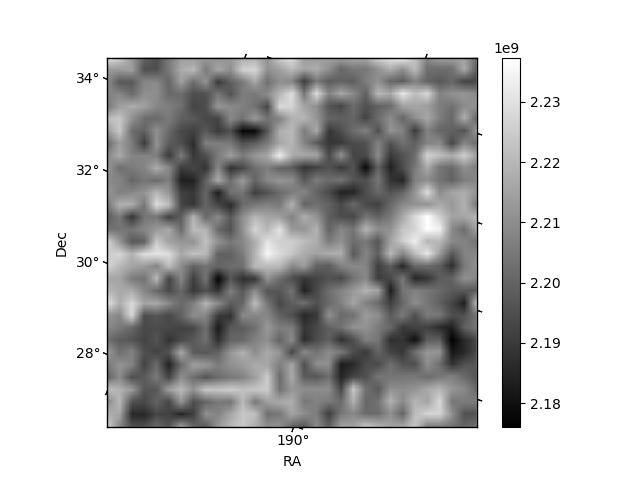
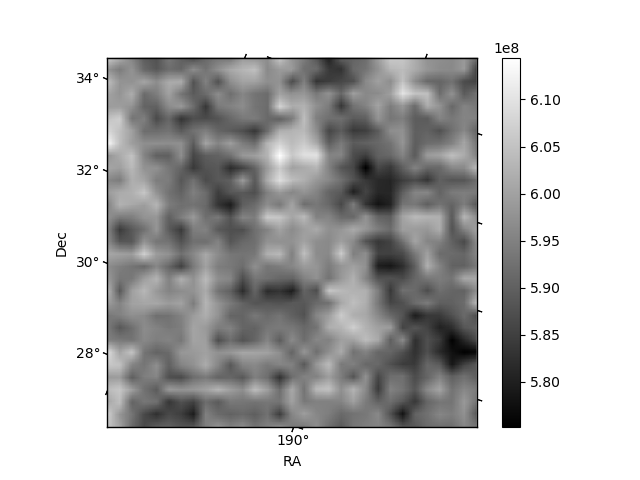
Histogram calculated using DETX and DETY for each event in the final _common_clean file
| Quadrant A |  |
 |
Quadrant B |
|---|---|---|---|
| Quadrant D |  |
 |
Quadrant C |
| Plot type | Count rate plots | Images |
|---|---|---|
| Comparison with Poisson distribution Blue bars denote a histogram of data divided into 1 sec bins. Red curve is a Poisson curve with rate = median count rate of data. |
 |
 |
| Quadrant-wise count rates Data is divided into 100 sec bins |
 |
|
| Module-wise count rates for Quadrant A Data is divided into 100 sec bins |
 |
 |
| Module-wise count rates for Quadrant B Data is divided into 100 sec bins |
 |
 |
| Module-wise count rates for Quadrant C Data is divided into 100 sec bins |
 |
 |
| Module-wise count rates for Quadrant D Data is divided into 100 sec bins |
 |
 |
| Parameter | Plot |
|---|---|
| CZT HV Monitor | 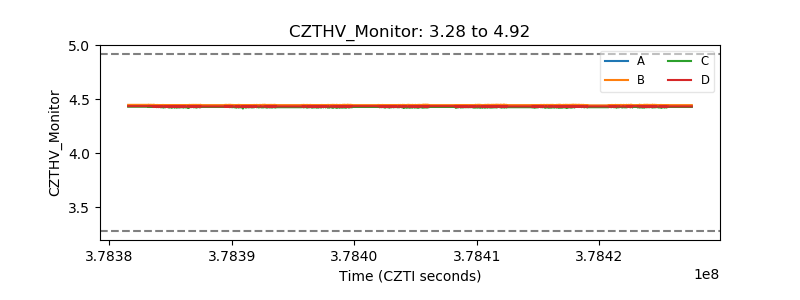 |
| D_VDD |  |
| Temperature 1 |  |
| Veto HV Monitor |  |
| Veto LLD |  |
| Alpha Counter |  |
| _CPM_Rate | 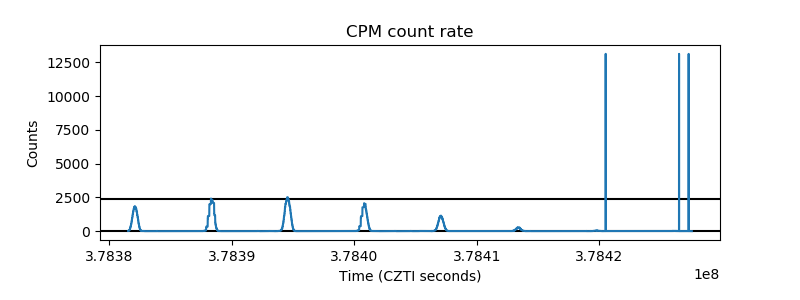 |
| CZT Counter |  |
| +2.5 Volts monitor |  |
| +5 Volts monitor | 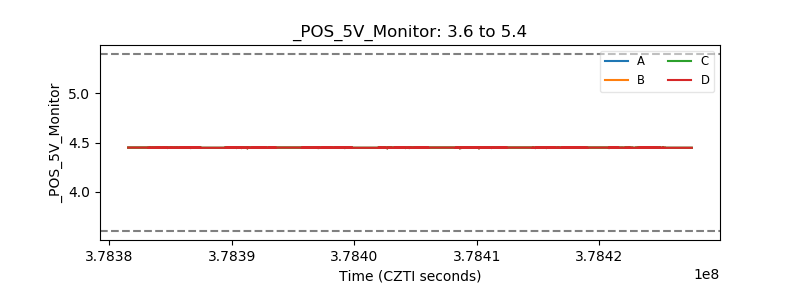 |
| _ROLL_ROT |  |
| _Roll_DEC |  |
| _Roll_RA |  |
| Veto Counter |  |