| Param | Original file | Final file |
|---|---|---|
| Filename | modeM0/AS1T04_077T01_9000004824cztM0_level2_bc.evt | modeM0/AS1T04_077T01_9000004824cztM0_level2_quad_clean.evt |
| Size (bytes) | 3,021,396,480 | 484,871,040 |
| Size | 2.8 GB | 462.4 MB |
| Events in quadrant A | 12,402,358 | 2,934,206 |
| Events in quadrant B | 14,011,494 | 3,090,845 |
| Events in quadrant C | 12,909,594 | 3,108,558 |
| Events in quadrant D | 49,263,050 | 2,601,814 |
| Mode M9 | |||
|---|---|---|---|
| Quadrant | BADHDUFLAG | Total packets | Discarded packets |
| A | 0 | 148 | 0 |
| B | 0 | 148 | 0 |
| C | 0 | 148 | 0 |
| D | 0 | 148 | 0 |
| Mode M0 | |||
|---|---|---|---|
| Quadrant | BADHDUFLAG | Total packets | Discarded packets |
| A | 0 | 111075 | 0 |
| B | 0 | 107001 | 0 |
| C | 0 | 98742 | 0 |
| D | 0 | 233556 | 0 |
| Mode SS | |||
|---|---|---|---|
| Quadrant | BADHDUFLAG | Total packets | Discarded packets |
| A | 0 | 878 | 0 |
| B | 0 | 878 | 0 |
| C | 0 | 878 | 0 |
| D | 0 | 878 | 0 |
| Quadrant | Total seconds | Saturated seconds | Saturation percentage |
|---|---|---|---|
| A | 42915 | 3580 | 8.342072% |
| B | 42915 | 1382 | 3.220319% |
| C | 42916 | 369 | 0.859819% |
| D | 42915 | 14388 | 33.526739% |
Noise dominated data is calculated using 1-second bins in cleaned event files. If a bin has >2000 counts, and if more than 50% of those come from <1% of pixels, then it is considered to be noise-dominated and hence unusable.
| Quadrant | # 1 sec bins | Bins with >0 counts | Bins with >2000 counts | High rate bins dominated by noise | Noise dominated (total time) | Noise dominated (detector-on time) | Marked lightcurve |
|---|---|---|---|---|---|---|---|
| A | 58177 | 42917 | 5 | 5 | 0.01% | 0.01% |  |
| B | 58177 | 42917 | 73 | 73 | 0.13% | 0.17% |  |
| C | 58177 | 42918 | 44 | 44 | 0.08% | 0.10% |  |
| D | 58177 | 42917 | 3031 | 3031 | 5.21% | 7.06% |  |
Top three noisy pixels from each quadrant. If the there are fewer than three noisy pixels in the level2.evt file, extra rows are filled as -1
| Pixel properties | Quadrant properties | ||||||
|---|---|---|---|---|---|---|---|
| Quadrant | DetID | PixID | Counts | Sigma | Mean | Median | Sigma |
| A | 15 | 169 | 3310736 | 6935.69 | 2210 | 2179 | 477.0 |
| A | 15 | 237 | 356539 | 742.84 | 2210 | 2179 | 477.0 |
| A | 13 | 6 | 149150 | 308.09 | 2210 | 2179 | 477.0 |
| B | 5 | 172 | 2768864 | 6150.0 | 2312 | 2263 | 449.9 |
| B | 5 | 255 | 530532 | 1174.31 | 2312 | 2263 | 449.9 |
| B | 4 | 251 | 274515 | 605.2 | 2312 | 2263 | 449.9 |
| C | 15 | 214 | 1296295 | 2556.13 | 2277 | 2263 | 506.2 |
| C | 3 | 233 | 620729 | 1221.67 | 2277 | 2263 | 506.2 |
| C | 0 | 10 | 569757 | 1120.98 | 2277 | 2263 | 506.2 |
| D | 12 | 235 | 25143768 | 53840.07 | 1979 | 1927 | 467.0 |
| D | 8 | 195 | 9724917 | 20821.32 | 1979 | 1927 | 467.0 |
| D | 2 | 250 | 2543351 | 5442.34 | 1979 | 1927 | 467.0 |
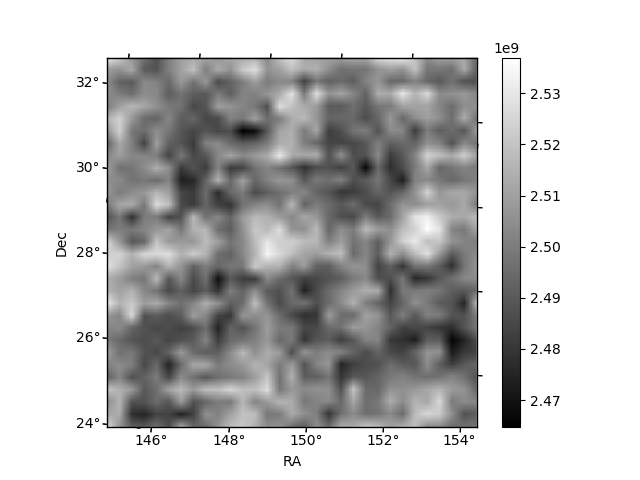
Histogram calculated using DETX and DETY for each event in the final _common_clean file
| Quadrant A |  |
 |
Quadrant B |
|---|---|---|---|
| Quadrant D |  |
 |
Quadrant C |
| Plot type | Count rate plots | Images |
|---|---|---|
| Comparison with Poisson distribution Blue bars denote a histogram of data divided into 1 sec bins. Red curve is a Poisson curve with rate = median count rate of data. |
 |
 |
| Quadrant-wise count rates Data is divided into 100 sec bins |
 |
|
| Module-wise count rates for Quadrant A Data is divided into 100 sec bins |
 |
 |
| Module-wise count rates for Quadrant B Data is divided into 100 sec bins |
 |
 |
| Module-wise count rates for Quadrant C Data is divided into 100 sec bins |
 |
 |
| Module-wise count rates for Quadrant D Data is divided into 100 sec bins |
 |
 |
| Parameter | Plot |
|---|---|
| CZT HV Monitor |  |
| D_VDD |  |
| Temperature 1 |  |
| Veto HV Monitor |  |
| Veto LLD |  |
| Alpha Counter |  |
| _CPM_Rate |  |
| CZT Counter |  |
| +2.5 Volts monitor |  |
| +5 Volts monitor |  |
| _ROLL_ROT |  |
| _Roll_DEC | 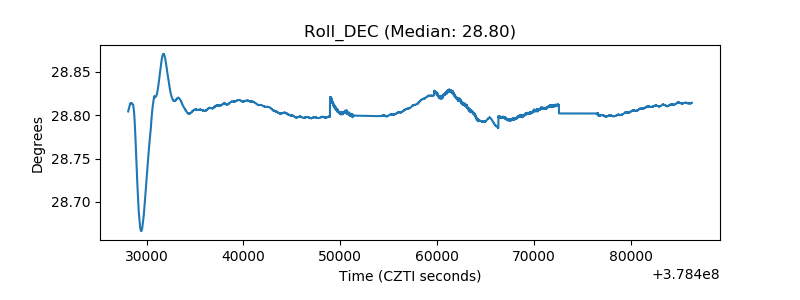 |
| _Roll_RA |  |
| Veto Counter |  |