| Param | Original file | Final file |
|---|---|---|
| Filename | modeM0/AS1A11_086T01_9000004820cztM0_level2_bc.evt | modeM0/AS1A11_086T01_9000004820cztM0_level2_quad_clean.evt |
| Size (bytes) | 13,752,400,320 | 2,518,594,560 |
| Size | 12.8 GB | 2.3 GB |
| Events in quadrant A | 102,983,431 | 15,603,432 |
| Events in quadrant B | 68,447,928 | 16,363,092 |
| Events in quadrant C | 64,091,571 | 16,549,101 |
| Events in quadrant D | 167,735,032 | 14,374,964 |
| Mode M9 | |||
|---|---|---|---|
| Quadrant | BADHDUFLAG | Total packets | Discarded packets |
| A | 0 | 734 | 0 |
| B | 0 | 734 | 0 |
| C | 0 | 734 | 0 |
| D | 0 | 734 | 0 |
| Mode SS | |||
|---|---|---|---|
| Quadrant | BADHDUFLAG | Total packets | Discarded packets |
| A | 0 | 3982 | 0 |
| B | 0 | 3980 | 0 |
| C | 0 | 3980 | 0 |
| D | 0 | 3982 | 0 |
| Mode M0 | |||
|---|---|---|---|
| Quadrant | BADHDUFLAG | Total packets | Discarded packets |
| A | 0 | 676243 | 0 |
| B | 0 | 506468 | 0 |
| C | 0 | 466618 | 0 |
| D | 0 | 837540 | 0 |
| Quadrant | Total seconds | Saturated seconds | Saturation percentage |
|---|---|---|---|
| A | 195411 | 27033 | 13.833919% |
| B | 195397 | 8855 | 4.531799% |
| C | 195404 | 3201 | 1.638145% |
| D | 195403 | 37373 | 19.126114% |
Noise dominated data is calculated using 1-second bins in cleaned event files. If a bin has >2000 counts, and if more than 50% of those come from <1% of pixels, then it is considered to be noise-dominated and hence unusable.
| Quadrant | # 1 sec bins | Bins with >0 counts | Bins with >2000 counts | High rate bins dominated by noise | Noise dominated (total time) | Noise dominated (detector-on time) | Marked lightcurve |
|---|---|---|---|---|---|---|---|
| A | 267456 | 195396 | 697 | 697 | 0.26% | 0.36% | 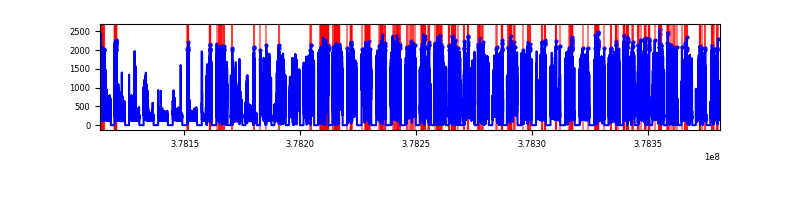 |
| B | 267455 | 195452 | 594 | 594 | 0.22% | 0.30% | 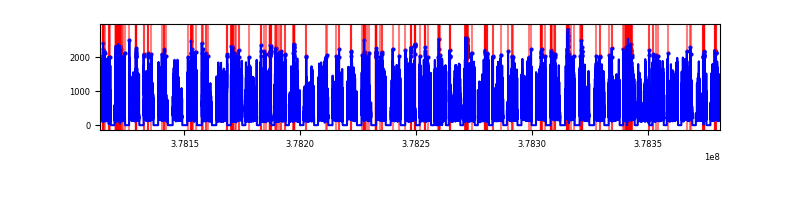 |
| C | 267455 | 195454 | 512 | 512 | 0.19% | 0.26% |  |
| D | 267456 | 195455 | 11190 | 11190 | 4.18% | 5.73% | 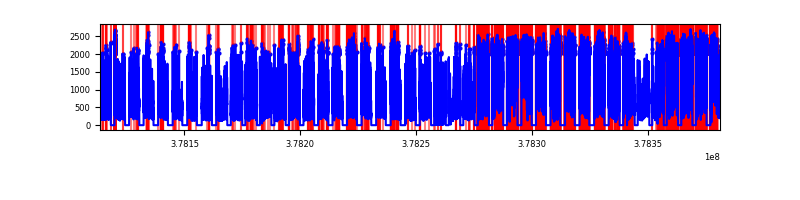 |
Top three noisy pixels from each quadrant. If the there are fewer than three noisy pixels in the level2.evt file, extra rows are filled as -1
| Pixel properties | Quadrant properties | ||||||
|---|---|---|---|---|---|---|---|
| Quadrant | DetID | PixID | Counts | Sigma | Mean | Median | Sigma |
| A | 15 | 169 | 36652976 | 17022.96 | 9876 | 9742 | 2152.6 |
| A | 15 | 237 | 26001184 | 12074.57 | 9876 | 9742 | 2152.6 |
| A | 14 | 4 | 1175387 | 541.51 | 9876 | 9742 | 2152.6 |
| B | 5 | 172 | 15318217 | 7555.83 | 10418 | 10210 | 2026.0 |
| B | 5 | 255 | 2509854 | 1233.79 | 10418 | 10210 | 2026.0 |
| B | 0 | 197 | 1876275 | 921.07 | 10418 | 10210 | 2026.0 |
| C | 15 | 214 | 8056748 | 3456.41 | 10336 | 10291 | 2328.0 |
| C | 9 | 187 | 4664097 | 1999.07 | 10336 | 10291 | 2328.0 |
| C | 3 | 233 | 4369686 | 1872.61 | 10336 | 10291 | 2328.0 |
| D | 12 | 235 | 60060910 | 26409.37 | 9544 | 9282 | 2273.9 |
| D | 8 | 195 | 38242136 | 16813.96 | 9544 | 9282 | 2273.9 |
| D | 2 | 250 | 7517309 | 3301.86 | 9544 | 9282 | 2273.9 |
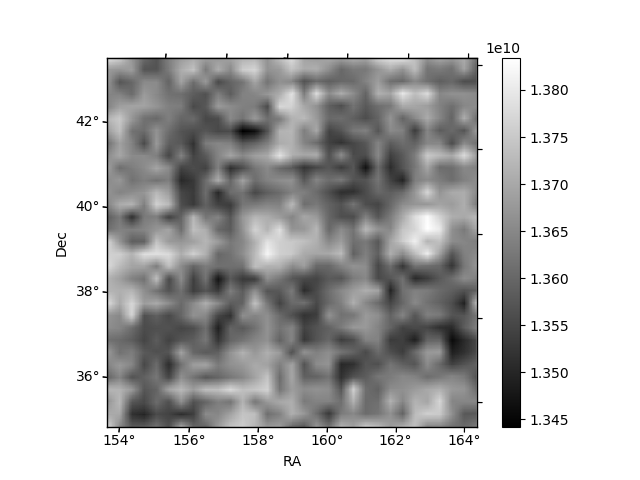
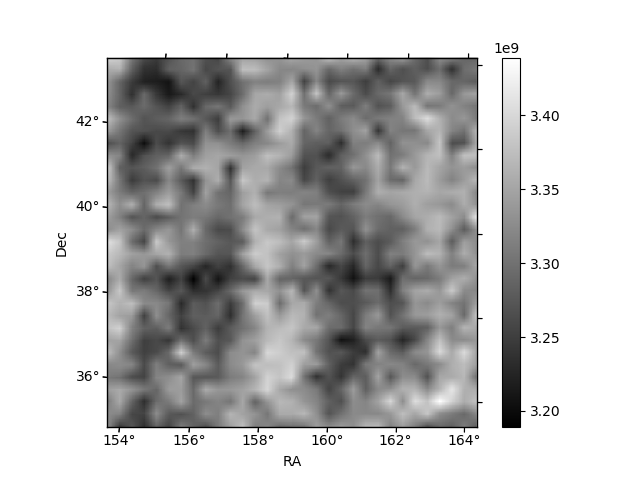
Histogram calculated using DETX and DETY for each event in the final _common_clean file
| Quadrant A |  |
 |
Quadrant B |
|---|---|---|---|
| Quadrant D |  |
 |
Quadrant C |
| Plot type | Count rate plots | Images |
|---|---|---|
| Comparison with Poisson distribution Blue bars denote a histogram of data divided into 1 sec bins. Red curve is a Poisson curve with rate = median count rate of data. |
 |
 |
| Quadrant-wise count rates Data is divided into 100 sec bins |
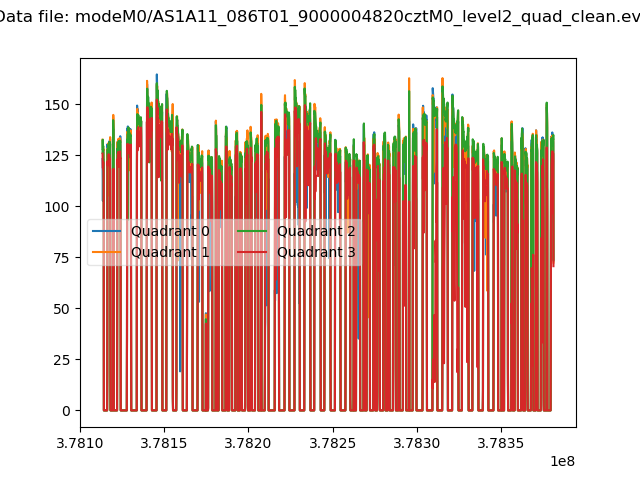 |
|
| Module-wise count rates for Quadrant A Data is divided into 100 sec bins |
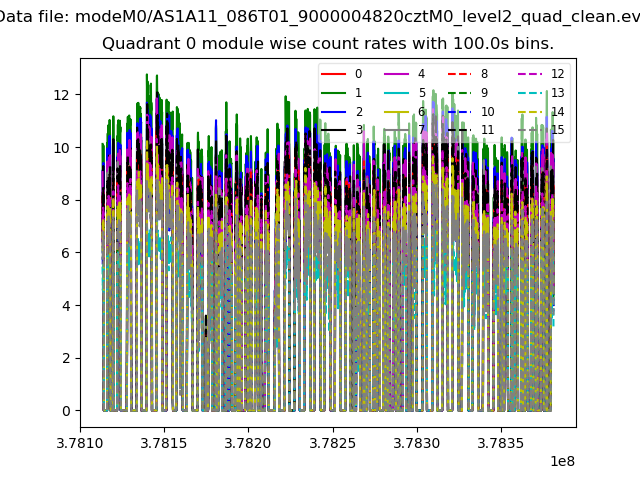 |
 |
| Module-wise count rates for Quadrant B Data is divided into 100 sec bins |
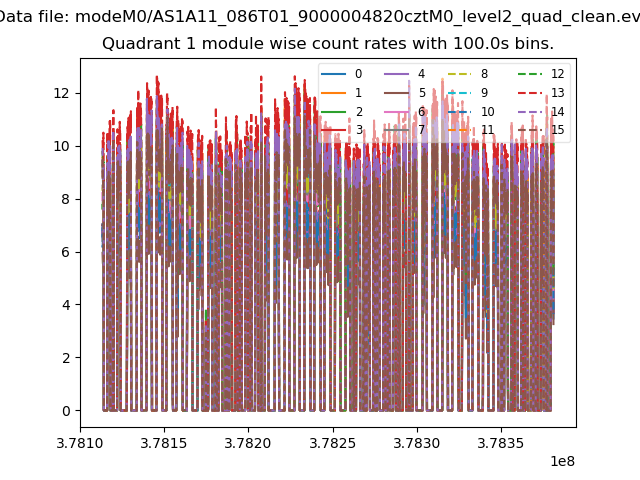 |
 |
| Module-wise count rates for Quadrant C Data is divided into 100 sec bins |
 |
 |
| Module-wise count rates for Quadrant D Data is divided into 100 sec bins |
 |
 |
| Parameter | Plot |
|---|---|
| CZT HV Monitor | 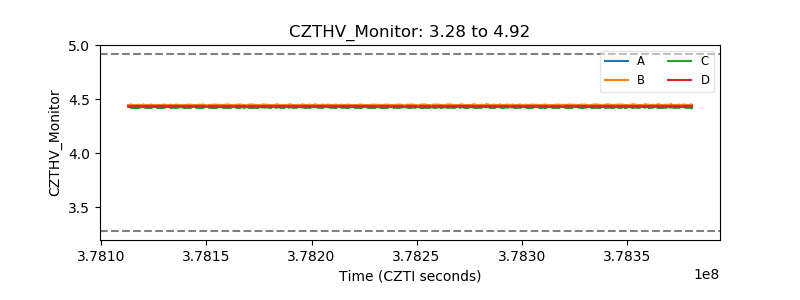 |
| D_VDD |  |
| Temperature 1 |  |
| Veto HV Monitor | 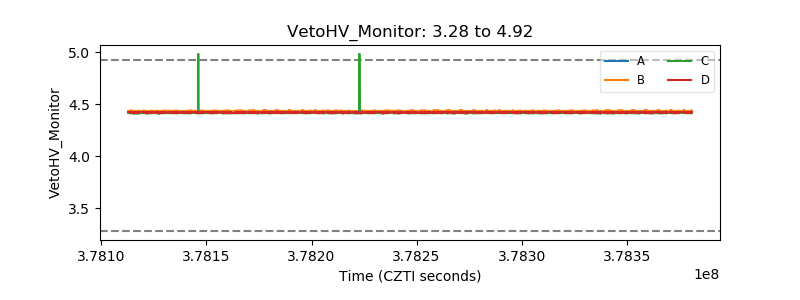 |
| Veto LLD |  |
| Alpha Counter | 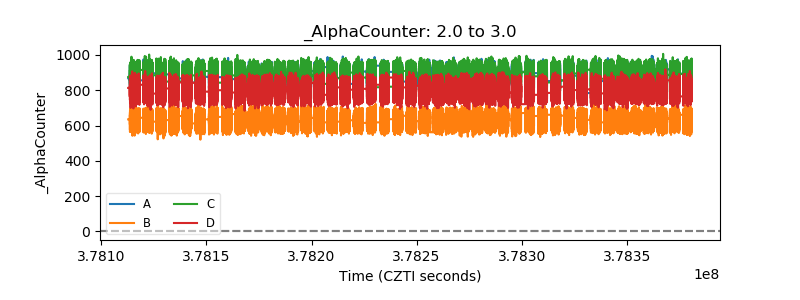 |
| _CPM_Rate |  |
| CZT Counter |  |
| +2.5 Volts monitor |  |
| +5 Volts monitor | 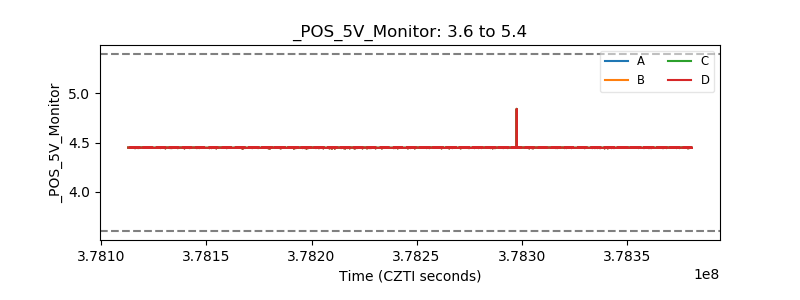 |
| _ROLL_ROT |  |
| _Roll_DEC | 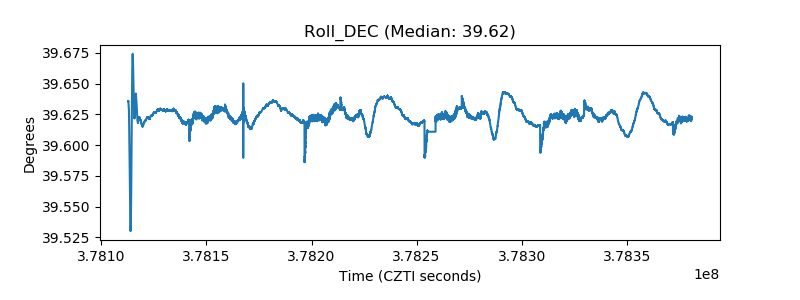 |
| _Roll_RA |  |
| Veto Counter | 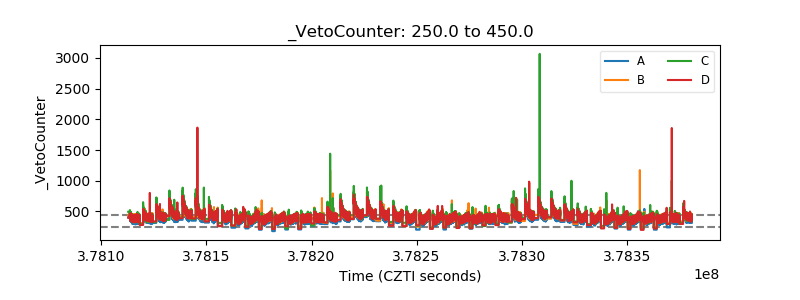 |