| Param | Original file | Final file |
|---|---|---|
| Filename | modeM0/AS1A11_037T01_9000004818cztM0_level2_bc.evt | modeM0/AS1A11_037T01_9000004818cztM0_level2_quad_clean.evt |
| Size (bytes) | 1,422,682,560 | 355,282,560 |
| Size | 1.3 GB | 338.8 MB |
| Events in quadrant A | 8,704,916 | 2,299,787 |
| Events in quadrant B | 10,024,590 | 2,295,987 |
| Events in quadrant C | 7,524,570 | 2,319,853 |
| Events in quadrant D | 15,169,430 | 2,164,800 |
| Mode M9 | |||
|---|---|---|---|
| Quadrant | BADHDUFLAG | Total packets | Discarded packets |
| A | 0 | 71 | 0 |
| B | 0 | 71 | 0 |
| C | 0 | 71 | 0 |
| D | 0 | 71 | 0 |
| Mode M0 | |||
|---|---|---|---|
| Quadrant | BADHDUFLAG | Total packets | Discarded packets |
| A | 0 | 61204 | 0 |
| B | 0 | 69834 | 0 |
| C | 0 | 55245 | 0 |
| D | 0 | 83645 | 0 |
| Mode SS | |||
|---|---|---|---|
| Quadrant | BADHDUFLAG | Total packets | Discarded packets |
| A | 0 | 500 | 0 |
| B | 0 | 500 | 0 |
| C | 0 | 500 | 0 |
| D | 0 | 500 | 0 |
| Quadrant | Total seconds | Saturated seconds | Saturation percentage |
|---|---|---|---|
| A | 24415 | 729 | 2.985869% |
| B | 24415 | 1788 | 7.323367% |
| C | 24415 | 310 | 1.269711% |
| D | 24415 | 1402 | 5.742371% |
Noise dominated data is calculated using 1-second bins in cleaned event files. If a bin has >2000 counts, and if more than 50% of those come from <1% of pixels, then it is considered to be noise-dominated and hence unusable.
| Quadrant | # 1 sec bins | Bins with >0 counts | Bins with >2000 counts | High rate bins dominated by noise | Noise dominated (total time) | Noise dominated (detector-on time) | Marked lightcurve |
|---|---|---|---|---|---|---|---|
| A | 31579 | 24420 | 248 | 248 | 0.79% | 1.02% |  |
| B | 31579 | 24413 | 43 | 43 | 0.14% | 0.18% |  |
| C | 31579 | 24416 | 48 | 48 | 0.15% | 0.20% |  |
| D | 31579 | 24415 | 112 | 112 | 0.35% | 0.46% | 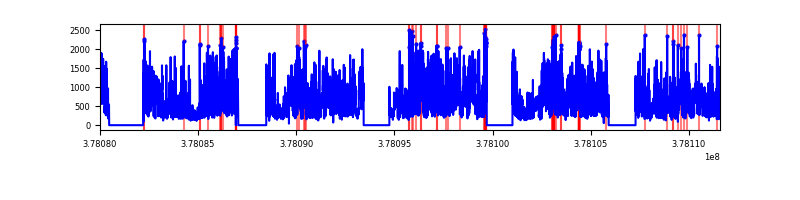 |
Top three noisy pixels from each quadrant. If the there are fewer than three noisy pixels in the level2.evt file, extra rows are filled as -1
| Pixel properties | Quadrant properties | ||||||
|---|---|---|---|---|---|---|---|
| Quadrant | DetID | PixID | Counts | Sigma | Mean | Median | Sigma |
| A | 14 | 4 | 2464599 | 9173.57 | 1210 | 1191 | 268.5 |
| A | 15 | 169 | 1162194 | 4323.5 | 1210 | 1191 | 268.5 |
| A | 15 | 237 | 284203 | 1053.92 | 1210 | 1191 | 268.5 |
| B | 5 | 172 | 3268841 | 13696.41 | 1199 | 1175 | 238.6 |
| B | 15 | 222 | 507446 | 2122.03 | 1199 | 1175 | 238.6 |
| B | 0 | 189 | 396313 | 1656.22 | 1199 | 1175 | 238.6 |
| C | 15 | 214 | 1007978 | 3644.47 | 1204 | 1195 | 276.2 |
| C | 9 | 187 | 691045 | 2497.2 | 1204 | 1195 | 276.2 |
| C | 3 | 233 | 514435 | 1857.88 | 1204 | 1195 | 276.2 |
| D | 8 | 195 | 6135807 | 19663.43 | 1177 | 1151 | 312.0 |
| D | 2 | 250 | 1122327 | 3593.71 | 1177 | 1151 | 312.0 |
| D | 12 | 233 | 1034744 | 3312.98 | 1177 | 1151 | 312.0 |
Histogram calculated using DETX and DETY for each event in the final _common_clean file
| Quadrant A | 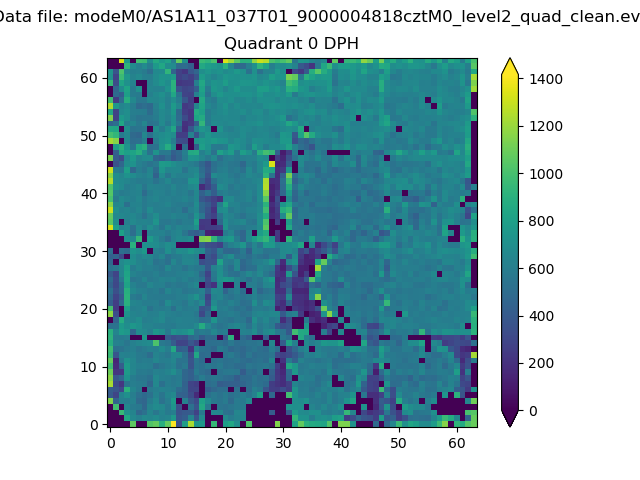 |
 |
Quadrant B |
|---|---|---|---|
| Quadrant D |  |
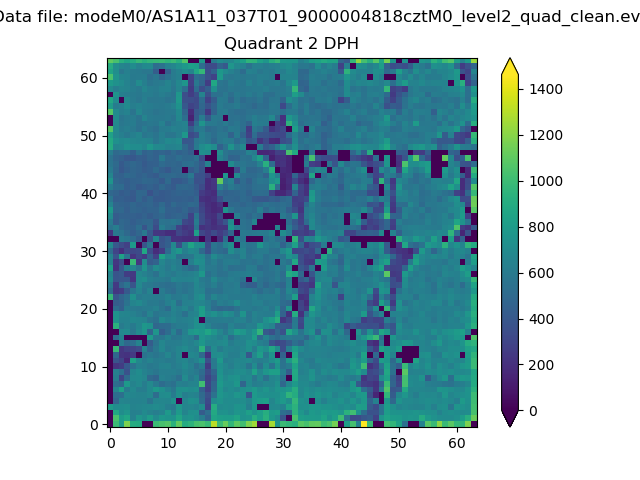 |
Quadrant C |
| Plot type | Count rate plots | Images |
|---|---|---|
| Comparison with Poisson distribution Blue bars denote a histogram of data divided into 1 sec bins. Red curve is a Poisson curve with rate = median count rate of data. |
 |
 |
| Quadrant-wise count rates Data is divided into 100 sec bins |
 |
|
| Module-wise count rates for Quadrant A Data is divided into 100 sec bins |
 |
 |
| Module-wise count rates for Quadrant B Data is divided into 100 sec bins |
 |
 |
| Module-wise count rates for Quadrant C Data is divided into 100 sec bins |
 |
 |
| Module-wise count rates for Quadrant D Data is divided into 100 sec bins |
 |
 |
| Parameter | Plot |
|---|---|
| CZT HV Monitor |  |
| D_VDD |  |
| Temperature 1 |  |
| Veto HV Monitor |  |
| Veto LLD |  |
| Alpha Counter |  |
| _CPM_Rate |  |
| CZT Counter |  |
| +2.5 Volts monitor |  |
| +5 Volts monitor |  |
| _ROLL_ROT |  |
| _Roll_DEC |  |
| _Roll_RA |  |
| Veto Counter |  |