| Param | Original file | Final file |
|---|---|---|
| Filename | modeM0/AS1T04_088T01_9000004814cztM0_level2_bc.evt | modeM0/AS1T04_088T01_9000004814cztM0_level2_quad_clean.evt |
| Size (bytes) | 1,534,446,720 | 407,367,360 |
| Size | 1.4 GB | 388.5 MB |
| Events in quadrant A | 7,503,754 | 2,640,692 |
| Events in quadrant B | 10,993,793 | 2,622,863 |
| Events in quadrant C | 8,909,619 | 2,695,873 |
| Events in quadrant D | 17,216,734 | 2,512,891 |
| Mode SS | |||
|---|---|---|---|
| Quadrant | BADHDUFLAG | Total packets | Discarded packets |
| A | 0 | 552 | 0 |
| B | 0 | 552 | 0 |
| C | 0 | 552 | 0 |
| D | 0 | 552 | 0 |
| Mode M0 | |||
|---|---|---|---|
| Quadrant | BADHDUFLAG | Total packets | Discarded packets |
| A | 0 | 62530 | 0 |
| B | 0 | 77985 | 0 |
| C | 0 | 63898 | 0 |
| D | 0 | 94069 | 0 |
| Mode M9 | |||
|---|---|---|---|
| Quadrant | BADHDUFLAG | Total packets | Discarded packets |
| A | 0 | 131 | 0 |
| B | 0 | 131 | 0 |
| C | 0 | 131 | 0 |
| D | 0 | 131 | 0 |
| Quadrant | Total seconds | Saturated seconds | Saturation percentage |
|---|---|---|---|
| A | 27148 | 654 | 2.409017% |
| B | 27148 | 2120 | 7.809047% |
| C | 27148 | 405 | 1.491823% |
| D | 27148 | 1172 | 4.317077% |
Noise dominated data is calculated using 1-second bins in cleaned event files. If a bin has >2000 counts, and if more than 50% of those come from <1% of pixels, then it is considered to be noise-dominated and hence unusable.
| Quadrant | # 1 sec bins | Bins with >0 counts | Bins with >2000 counts | High rate bins dominated by noise | Noise dominated (total time) | Noise dominated (detector-on time) | Marked lightcurve |
|---|---|---|---|---|---|---|---|
| A | 38895 | 27144 | 36 | 36 | 0.09% | 0.13% |  |
| B | 38895 | 27145 | 34 | 34 | 0.09% | 0.13% |  |
| C | 38895 | 27147 | 48 | 48 | 0.12% | 0.18% |  |
| D | 38895 | 27149 | 197 | 197 | 0.51% | 0.73% |  |
Top three noisy pixels from each quadrant. If the there are fewer than three noisy pixels in the level2.evt file, extra rows are filled as -1
| Pixel properties | Quadrant properties | ||||||
|---|---|---|---|---|---|---|---|
| Quadrant | DetID | PixID | Counts | Sigma | Mean | Median | Sigma |
| A | 15 | 237 | 1311670 | 3947.54 | 1531 | 1515 | 331.9 |
| A | 15 | 169 | 99620 | 295.59 | 1531 | 1515 | 331.9 |
| A | 13 | 6 | 79476 | 234.9 | 1531 | 1515 | 331.9 |
| B | 5 | 172 | 3768737 | 12951.23 | 1509 | 1484 | 290.9 |
| B | 8 | 128 | 232474 | 794.11 | 1509 | 1484 | 290.9 |
| B | 4 | 170 | 184745 | 630.02 | 1509 | 1484 | 290.9 |
| C | 15 | 214 | 1189712 | 3456.51 | 1525 | 1522 | 343.8 |
| C | 0 | 10 | 536466 | 1556.18 | 1525 | 1522 | 343.8 |
| C | 14 | 254 | 373423 | 1081.88 | 1525 | 1522 | 343.8 |
| D | 1 | 52 | 4701285 | 12139.73 | 1497 | 1470 | 387.1 |
| D | 8 | 195 | 3121385 | 8058.81 | 1497 | 1470 | 387.1 |
| D | 13 | 249 | 697212 | 1797.12 | 1497 | 1470 | 387.1 |
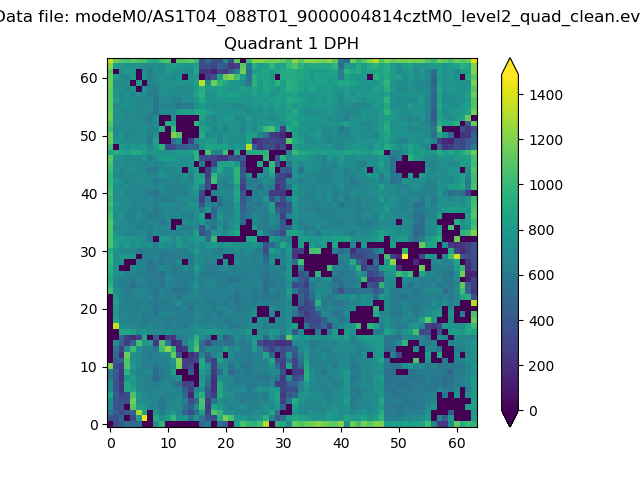
Histogram calculated using DETX and DETY for each event in the final _common_clean file
| Quadrant A |  |
 |
Quadrant B |
|---|---|---|---|
| Quadrant D |  |
 |
Quadrant C |
| Plot type | Count rate plots | Images |
|---|---|---|
| Comparison with Poisson distribution Blue bars denote a histogram of data divided into 1 sec bins. Red curve is a Poisson curve with rate = median count rate of data. |
 |
 |
| Quadrant-wise count rates Data is divided into 100 sec bins |
 |
|
| Module-wise count rates for Quadrant A Data is divided into 100 sec bins |
 |
 |
| Module-wise count rates for Quadrant B Data is divided into 100 sec bins |
 |
 |
| Module-wise count rates for Quadrant C Data is divided into 100 sec bins |
 |
 |
| Module-wise count rates for Quadrant D Data is divided into 100 sec bins |
 |
 |
| Parameter | Plot |
|---|---|
| CZT HV Monitor |  |
| D_VDD |  |
| Temperature 1 |  |
| Veto HV Monitor |  |
| Veto LLD |  |
| Alpha Counter |  |
| _CPM_Rate |  |
| CZT Counter |  |
| +2.5 Volts monitor |  |
| +5 Volts monitor |  |
| _ROLL_ROT |  |
| _Roll_DEC | 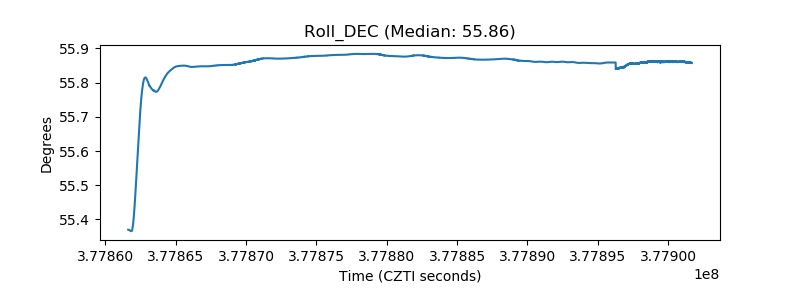 |
| _Roll_RA |  |
| Veto Counter |  |