| Param | Original file | Final file |
|---|---|---|
| Filename | modeM0/AS1T04_090T01_9000004812cztM0_level2_bc.evt | modeM0/AS1T04_090T01_9000004812cztM0_level2_quad_clean.evt |
| Size (bytes) | 7,728,972,480 | 1,370,908,800 |
| Size | 7.2 GB | 1.3 GB |
| Events in quadrant A | 95,726,280 | 7,192,097 |
| Events in quadrant B | 40,685,670 | 9,003,440 |
| Events in quadrant C | 33,031,215 | 9,344,543 |
| Events in quadrant D | 57,394,492 | 8,663,952 |
| Mode M9 | |||
|---|---|---|---|
| Quadrant | BADHDUFLAG | Total packets | Discarded packets |
| A | 0 | 392 | 0 |
| B | 0 | 394 | 0 |
| C | 0 | 393 | 0 |
| D | 0 | 393 | 0 |
| Mode M0 | |||
|---|---|---|---|
| Quadrant | BADHDUFLAG | Total packets | Discarded packets |
| A | 0 | 545254 | 0 |
| B | 0 | 293571 | 0 |
| C | 0 | 245505 | 0 |
| D | 0 | 335661 | 0 |
| Mode SS | |||
|---|---|---|---|
| Quadrant | BADHDUFLAG | Total packets | Discarded packets |
| A | 0 | 2202 | 0 |
| B | 0 | 2188 | 0 |
| C | 0 | 2188 | 0 |
| D | 0 | 2186 | 0 |
| Quadrant | Total seconds | Saturated seconds | Saturation percentage |
|---|---|---|---|
| A | 106552 | 42784 | 40.153165% |
| B | 106485 | 7372 | 6.923041% |
| C | 106676 | 1161 | 1.088342% |
| D | 106444 | 5187 | 4.872985% |
Noise dominated data is calculated using 1-second bins in cleaned event files. If a bin has >2000 counts, and if more than 50% of those come from <1% of pixels, then it is considered to be noise-dominated and hence unusable.
| Quadrant | # 1 sec bins | Bins with >0 counts | Bins with >2000 counts | High rate bins dominated by noise | Noise dominated (total time) | Noise dominated (detector-on time) | Marked lightcurve |
|---|---|---|---|---|---|---|---|
| A | 148774 | 106822 | 4273 | 4273 | 2.87% | 4.00% |  |
| B | 148774 | 106720 | 264 | 264 | 0.18% | 0.25% |  |
| C | 148774 | 107018 | 35 | 35 | 0.02% | 0.03% |  |
| D | 148774 | 106822 | 1351 | 1351 | 0.91% | 1.26% |  |
Top three noisy pixels from each quadrant. If the there are fewer than three noisy pixels in the level2.evt file, extra rows are filled as -1
| Pixel properties | Quadrant properties | ||||||
|---|---|---|---|---|---|---|---|
| Quadrant | DetID | PixID | Counts | Sigma | Mean | Median | Sigma |
| A | 15 | 169 | 70710292 | 73472.08 | 4404 | 4357 | 962.4 |
| A | 15 | 237 | 7083845 | 7356.45 | 4404 | 4357 | 962.4 |
| A | 14 | 4 | 662521 | 683.91 | 4404 | 4357 | 962.4 |
| B | 5 | 172 | 13926373 | 12669.65 | 5639 | 5529 | 1098.8 |
| B | 5 | 255 | 1541618 | 1398.03 | 5639 | 5529 | 1098.8 |
| B | 15 | 85 | 651703 | 588.1 | 5639 | 5529 | 1098.8 |
| C | 15 | 214 | 4437310 | 3475.46 | 5666 | 5644 | 1275.1 |
| C | 3 | 233 | 3281528 | 2569.05 | 5666 | 5644 | 1275.1 |
| C | 0 | 10 | 1985071 | 1552.33 | 5666 | 5644 | 1275.1 |
| D | 8 | 195 | 16150210 | 11400.09 | 5545 | 5418 | 1416.2 |
| D | 7 | 80 | 3220002 | 2269.87 | 5545 | 5418 | 1416.2 |
| D | 8 | 230 | 2966840 | 2091.11 | 5545 | 5418 | 1416.2 |
Histogram calculated using DETX and DETY for each event in the final _common_clean file
| Quadrant A | 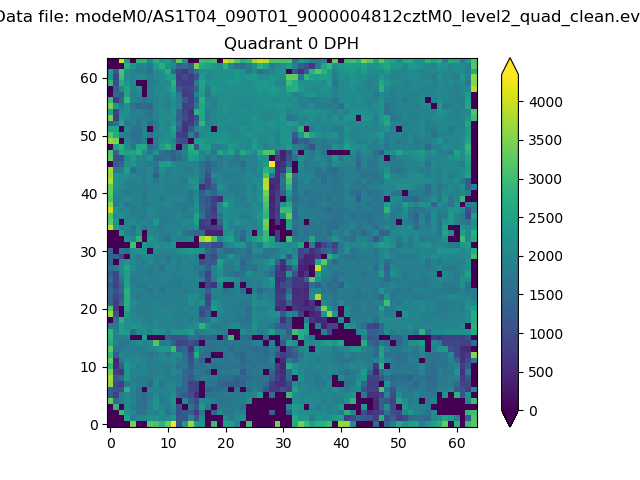 |
 |
Quadrant B |
|---|---|---|---|
| Quadrant D |  |
 |
Quadrant C |
| Plot type | Count rate plots | Images |
|---|---|---|
| Comparison with Poisson distribution Blue bars denote a histogram of data divided into 1 sec bins. Red curve is a Poisson curve with rate = median count rate of data. |
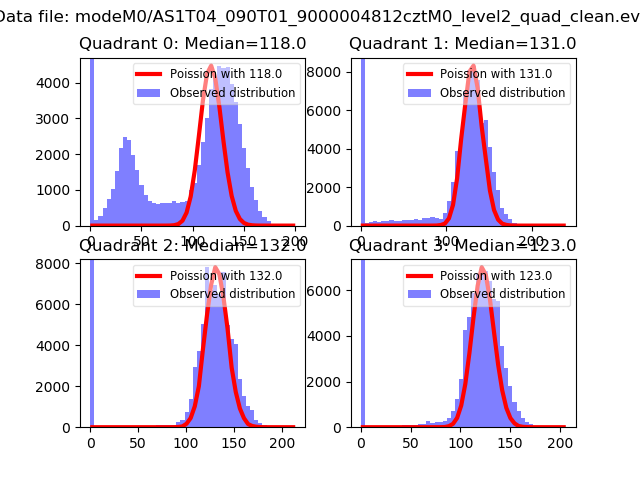 |
 |
| Quadrant-wise count rates Data is divided into 100 sec bins |
 |
|
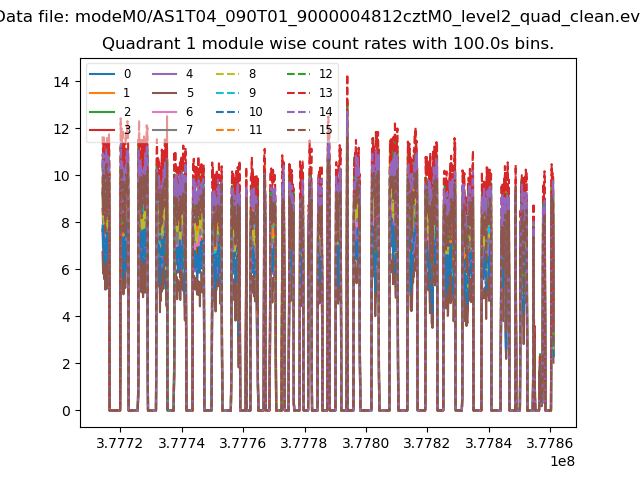
| Module-wise count rates for Quadrant A Data is divided into 100 sec bins |
 |
 |
| Module-wise count rates for Quadrant B Data is divided into 100 sec bins |
 |
 |
| Module-wise count rates for Quadrant C Data is divided into 100 sec bins |
 |
 |
| Module-wise count rates for Quadrant D Data is divided into 100 sec bins |
 |
 |
| Parameter | Plot |
|---|---|
| CZT HV Monitor |  |
| D_VDD |  |
| Temperature 1 | 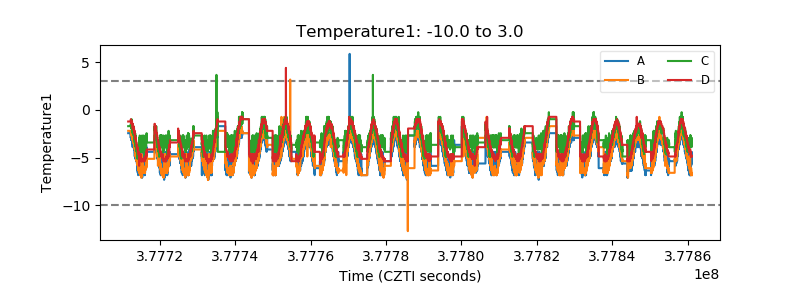 |
| Veto HV Monitor |  |
| Veto LLD |  |
| Alpha Counter | 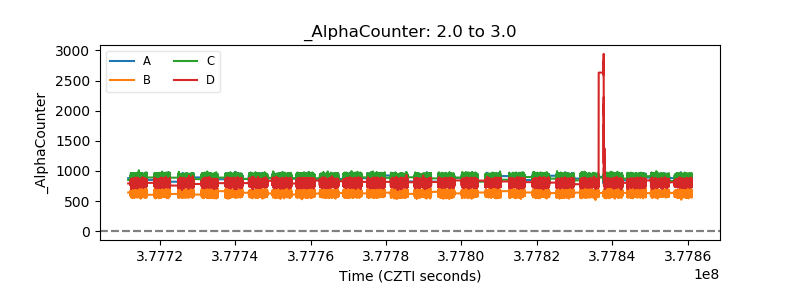 |
| _CPM_Rate | 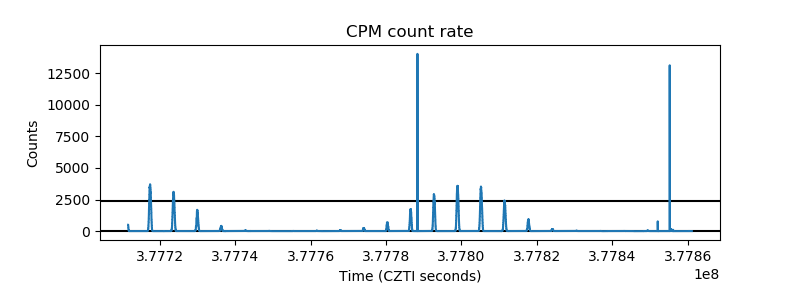 |
| CZT Counter | 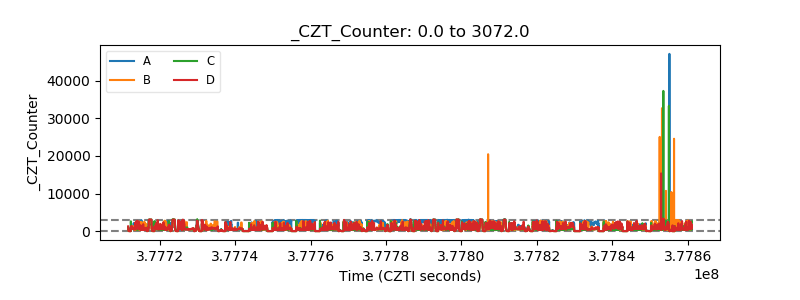 |
| +2.5 Volts monitor |  |
| +5 Volts monitor |  |
| _ROLL_ROT |  |
| _Roll_DEC |  |
| _Roll_RA |  |
| Veto Counter |  |