| Param | Original file | Final file |
|---|---|---|
| Filename | modeM0/AS1T04_076T01_9000004810cztM0_level2_bc.evt | modeM0/AS1T04_076T01_9000004810cztM0_level2_quad_clean.evt |
| Size (bytes) | 12,510,305,280 | 2,770,099,200 |
| Size | 11.7 GB | 2.6 GB |
| Events in quadrant A | 78,570,925 | 14,658,815 |
| Events in quadrant B | 89,476,050 | 17,948,915 |
| Events in quadrant C | 84,284,016 | 18,348,096 |
| Events in quadrant D | 110,968,229 | 17,246,286 |
| Mode SS | |||
|---|---|---|---|
| Quadrant | BADHDUFLAG | Total packets | Discarded packets |
| A | 0 | 4668 | 0 |
| B | 0 | 4668 | 0 |
| C | 0 | 4668 | 0 |
| D | 0 | 4668 | 0 |
| Mode M9 | |||
|---|---|---|---|
| Quadrant | BADHDUFLAG | Total packets | Discarded packets |
| A | 0 | 851 | 0 |
| B | 0 | 851 | 0 |
| C | 0 | 851 | 0 |
| D | 0 | 851 | 0 |
| Mode M0 | |||
|---|---|---|---|
| Quadrant | BADHDUFLAG | Total packets | Discarded packets |
| A | 0 | 817809 | 0 |
| B | 0 | 645945 | 0 |
| C | 0 | 589057 | 0 |
| D | 0 | 689624 | 0 |
| Quadrant | Total seconds | Saturated seconds | Saturation percentage |
|---|---|---|---|
| A | 229017 | 60871 | 26.579250% |
| B | 229017 | 17785 | 7.765799% |
| C | 229017 | 3849 | 1.680661% |
| D | 229017 | 7521 | 3.284036% |
Noise dominated data is calculated using 1-second bins in cleaned event files. If a bin has >2000 counts, and if more than 50% of those come from <1% of pixels, then it is considered to be noise-dominated and hence unusable.
| Quadrant | # 1 sec bins | Bins with >0 counts | Bins with >2000 counts | High rate bins dominated by noise | Noise dominated (total time) | Noise dominated (detector-on time) | Marked lightcurve |
|---|---|---|---|---|---|---|---|
| A | 313491 | 222075 | 804 | 804 | 0.26% | 0.36% |  |
| B | 313492 | 229013 | 799 | 799 | 0.25% | 0.35% |  |
| C | 313492 | 229016 | 239 | 239 | 0.08% | 0.10% |  |
| D | 313492 | 229016 | 988 | 988 | 0.32% | 0.43% |  |
Top three noisy pixels from each quadrant. If the there are fewer than three noisy pixels in the level2.evt file, extra rows are filled as -1
| Pixel properties | Quadrant properties | ||||||
|---|---|---|---|---|---|---|---|
| Quadrant | DetID | PixID | Counts | Sigma | Mean | Median | Sigma |
| A | 15 | 169 | 33180563 | 15630.48 | 9719 | 9579 | 2122.2 |
| A | 15 | 237 | 6640742 | 3124.67 | 9719 | 9579 | 2122.2 |
| A | 13 | 6 | 370271 | 169.96 | 9719 | 9579 | 2122.2 |
| B | 5 | 172 | 31967454 | 13667.38 | 12018 | 11766 | 2338.1 |
| B | 4 | 170 | 1535723 | 651.79 | 12018 | 11766 | 2338.1 |
| B | 15 | 222 | 1403254 | 595.14 | 12018 | 11766 | 2338.1 |
| C | 3 | 233 | 18751920 | 6907.74 | 12094 | 12046 | 2712.9 |
| C | 15 | 214 | 9894563 | 3642.81 | 12094 | 12046 | 2712.9 |
| C | 0 | 10 | 5341667 | 1964.56 | 12094 | 12046 | 2712.9 |
| D | 8 | 195 | 30719605 | 9722.24 | 11935 | 11668 | 3158.5 |
| D | 2 | 250 | 6202507 | 1960.04 | 11935 | 11668 | 3158.5 |
| D | 13 | 249 | 5315175 | 1679.11 | 11935 | 11668 | 3158.5 |
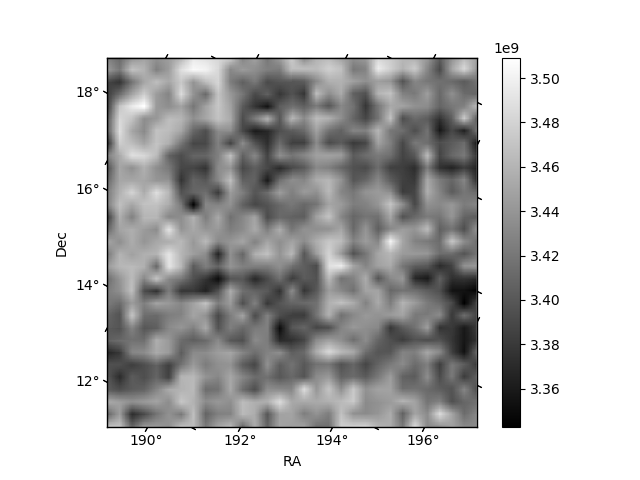
Histogram calculated using DETX and DETY for each event in the final _common_clean file
| Quadrant A |  |
 |
Quadrant B |
|---|---|---|---|
| Quadrant D |  |
 |
Quadrant C |
| Plot type | Count rate plots | Images |
|---|---|---|
| Comparison with Poisson distribution Blue bars denote a histogram of data divided into 1 sec bins. Red curve is a Poisson curve with rate = median count rate of data. |
 |
 |
| Quadrant-wise count rates Data is divided into 100 sec bins |
 |
|
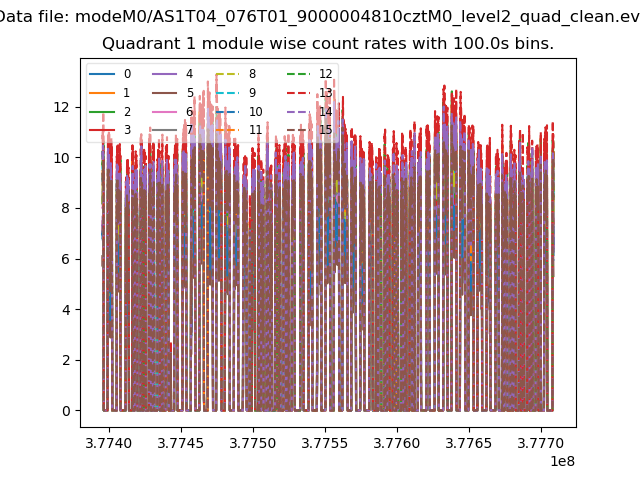
| Module-wise count rates for Quadrant A Data is divided into 100 sec bins |
 |
 |
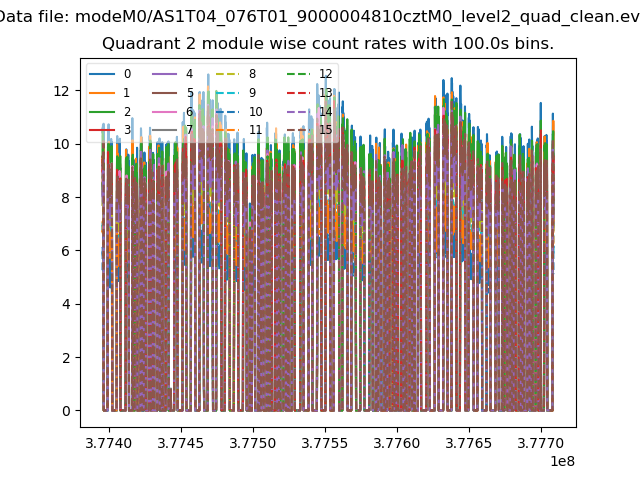
| Module-wise count rates for Quadrant B Data is divided into 100 sec bins |
 |
 |
| Module-wise count rates for Quadrant C Data is divided into 100 sec bins |
 |
 |
| Module-wise count rates for Quadrant D Data is divided into 100 sec bins |
 |
 |
| Parameter | Plot |
|---|---|
| CZT HV Monitor |  |
| D_VDD |  |
| Temperature 1 |  |
| Veto HV Monitor |  |
| Veto LLD |  |
| Alpha Counter |  |
| _CPM_Rate |  |
| CZT Counter |  |
| +2.5 Volts monitor |  |
| +5 Volts monitor | 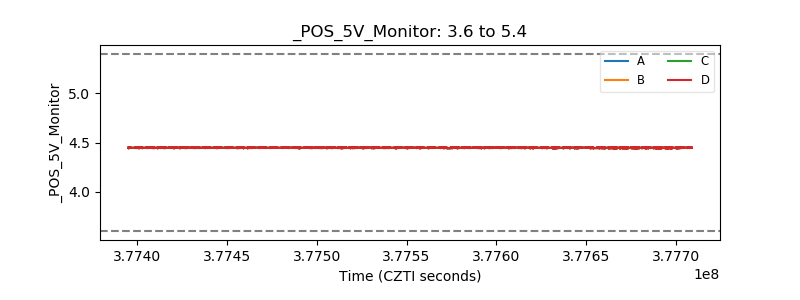 |
| _ROLL_ROT |  |
| _Roll_DEC |  |
| _Roll_RA |  |
| Veto Counter |  |