| Param | Original file | Final file |
|---|---|---|
| Filename | modeM0/AS1A11_060T01_9000004808cztM0_level2_bc.evt | modeM0/AS1A11_060T01_9000004808cztM0_level2_quad_clean.evt |
| Size (bytes) | 17,400,430,080 | 3,853,039,680 |
| Size | 16.2 GB | 3.6 GB |
| Events in quadrant A | 93,673,538 | 24,426,184 |
| Events in quadrant B | 119,632,708 | 24,091,033 |
| Events in quadrant C | 127,850,444 | 24,097,192 |
| Events in quadrant D | 164,865,355 | 22,918,977 |
| Mode M0 | |||
|---|---|---|---|
| Quadrant | BADHDUFLAG | Total packets | Discarded packets |
| A | 0 | 750542 | 0 |
| B | 0 | 857826 | 0 |
| C | 0 | 843658 | 0 |
| D | 0 | 977576 | 0 |
| Mode M9 | |||
|---|---|---|---|
| Quadrant | BADHDUFLAG | Total packets | Discarded packets |
| A | 0 | 1171 | 0 |
| B | 0 | 1171 | 0 |
| C | 0 | 1171 | 0 |
| D | 0 | 1171 | 0 |
| Mode SS | |||
|---|---|---|---|
| Quadrant | BADHDUFLAG | Total packets | Discarded packets |
| A | 0 | 6310 | 0 |
| B | 0 | 6310 | 0 |
| C | 0 | 6310 | 0 |
| D | 0 | 6310 | 0 |
| Quadrant | Total seconds | Saturated seconds | Saturation percentage |
|---|---|---|---|
| A | 309059 | 10098 | 3.267337% |
| B | 309059 | 22527 | 7.288900% |
| C | 309059 | 9134 | 2.955423% |
| D | 309059 | 15343 | 4.964424% |
Noise dominated data is calculated using 1-second bins in cleaned event files. If a bin has >2000 counts, and if more than 50% of those come from <1% of pixels, then it is considered to be noise-dominated and hence unusable.
| Quadrant | # 1 sec bins | Bins with >0 counts | Bins with >2000 counts | High rate bins dominated by noise | Noise dominated (total time) | Noise dominated (detector-on time) | Marked lightcurve |
|---|---|---|---|---|---|---|---|
| A | 425756 | 309070 | 466 | 466 | 0.11% | 0.15% |  |
| B | 425756 | 309048 | 945 | 945 | 0.22% | 0.31% |  |
| C | 425756 | 309060 | 1256 | 1256 | 0.30% | 0.41% |  |
| D | 425756 | 309059 | 2114 | 2114 | 0.50% | 0.68% |  |
Top three noisy pixels from each quadrant. If the there are fewer than three noisy pixels in the level2.evt file, extra rows are filled as -1
| Pixel properties | Quadrant properties | ||||||
|---|---|---|---|---|---|---|---|
| Quadrant | DetID | PixID | Counts | Sigma | Mean | Median | Sigma |
| A | 15 | 169 | 30644965 | 8746.49 | 16053 | 15811 | 3501.9 |
| A | 13 | 254 | 488114 | 134.87 | 16053 | 15811 | 3501.9 |
| A | 12 | 16 | 477024 | 131.7 | 16053 | 15811 | 3501.9 |
| B | 5 | 172 | 39084613 | 12408.81 | 15995 | 15631 | 3148.5 |
| B | 15 | 222 | 5251328 | 1662.92 | 15995 | 15631 | 3148.5 |
| B | 5 | 255 | 4471106 | 1415.12 | 15995 | 15631 | 3148.5 |
| C | 3 | 233 | 34781264 | 9624.88 | 15814 | 15690 | 3612.1 |
| C | 15 | 214 | 12408573 | 3430.98 | 15814 | 15690 | 3612.1 |
| C | 0 | 10 | 7575124 | 2092.84 | 15814 | 15690 | 3612.1 |
| D | 8 | 195 | 54025764 | 14449.58 | 15700 | 15229 | 3737.9 |
| D | 2 | 250 | 11936053 | 3189.21 | 15700 | 15229 | 3737.9 |
| D | 13 | 249 | 6893885 | 1840.27 | 15700 | 15229 | 3737.9 |
Histogram calculated using DETX and DETY for each event in the final _common_clean file
| Quadrant A | 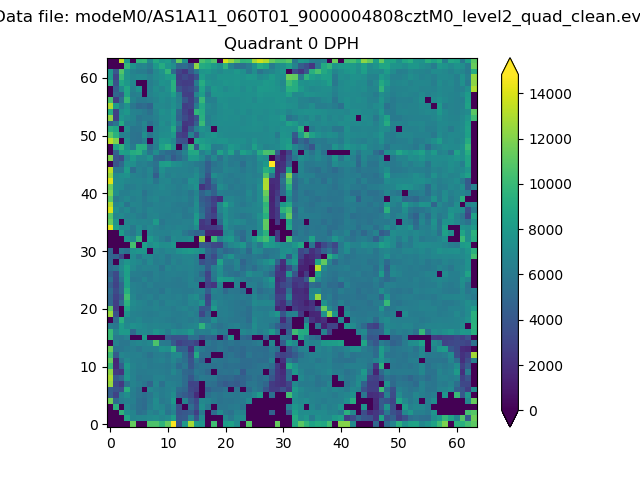 |
 |
Quadrant B |
|---|---|---|---|
| Quadrant D |  |
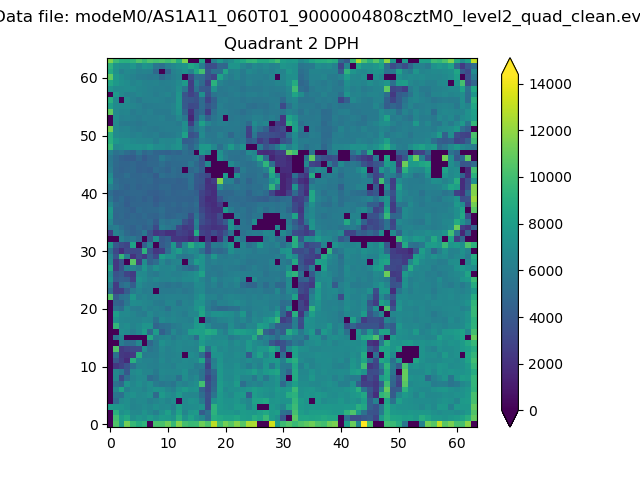 |
Quadrant C |
| Plot type | Count rate plots | Images |
|---|---|---|
| Comparison with Poisson distribution Blue bars denote a histogram of data divided into 1 sec bins. Red curve is a Poisson curve with rate = median count rate of data. |
 |
 |
| Quadrant-wise count rates Data is divided into 100 sec bins |
 |
|
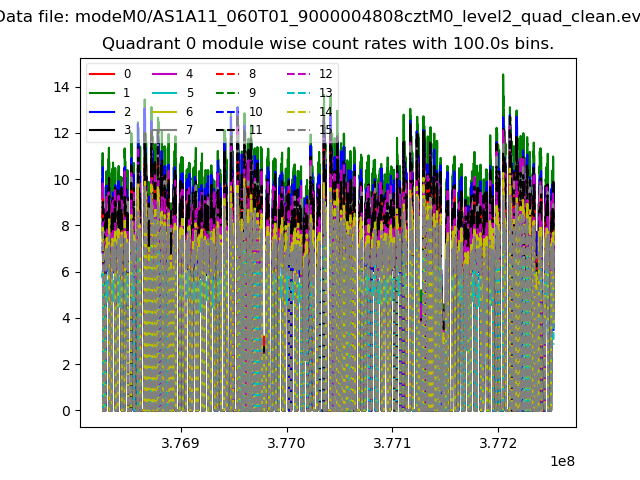
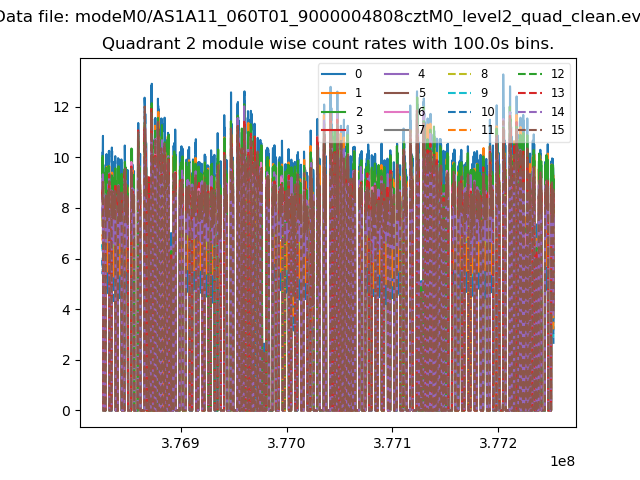
| Module-wise count rates for Quadrant A Data is divided into 100 sec bins |
 |
 |
| Module-wise count rates for Quadrant B Data is divided into 100 sec bins |
 |
 |
| Module-wise count rates for Quadrant C Data is divided into 100 sec bins |
 |
 |
| Module-wise count rates for Quadrant D Data is divided into 100 sec bins |
 |
 |
| Parameter | Plot |
|---|---|
| CZT HV Monitor | 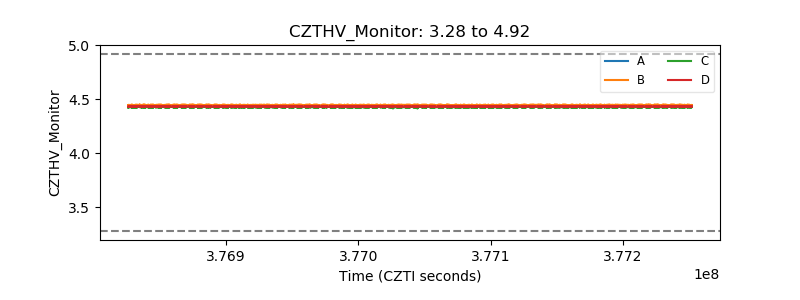 |
| D_VDD |  |
| Temperature 1 |  |
| Veto HV Monitor |  |
| Veto LLD |  |
| Alpha Counter |  |
| _CPM_Rate | 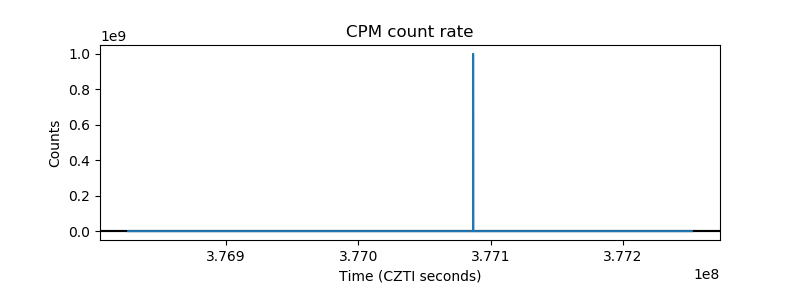 |
| CZT Counter |  |
| +2.5 Volts monitor |  |
| +5 Volts monitor |  |
| _ROLL_ROT |  |
| _Roll_DEC |  |
| _Roll_RA | 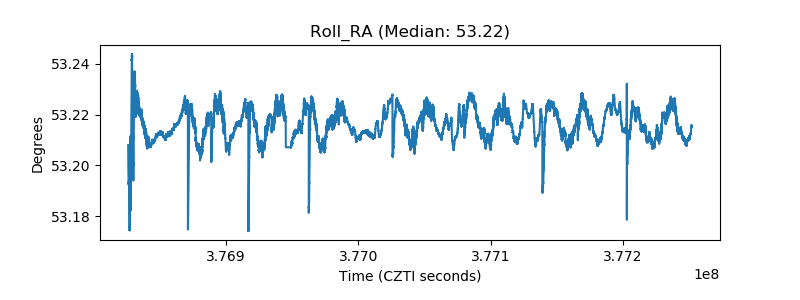 |
| Veto Counter |  |