| Param | Original file | Final file |
|---|---|---|
| Filename | modeM0/AS1A11_037T01_9000004806cztM0_level2_bc.evt | modeM0/AS1A11_037T01_9000004806cztM0_level2_quad_clean.evt |
| Size (bytes) | 1,048,757,760 | 308,888,640 |
| Size | 1000.2 MB | 294.6 MB |
| Events in quadrant A | 3,756,303 | 2,072,386 |
| Events in quadrant B | 7,082,834 | 2,089,298 |
| Events in quadrant C | 6,539,014 | 2,066,980 |
| Events in quadrant D | 13,140,316 | 1,871,094 |
| Mode M9 | |||
|---|---|---|---|
| Quadrant | BADHDUFLAG | Total packets | Discarded packets |
| A | 0 | 76 | 0 |
| B | 0 | 76 | 0 |
| C | 0 | 76 | 0 |
| D | 0 | 78 | 0 |
| Mode M0 | |||
|---|---|---|---|
| Quadrant | BADHDUFLAG | Total packets | Discarded packets |
| A | 0 | 36708 | 0 |
| B | 0 | 49641 | 0 |
| C | 0 | 44845 | 0 |
| D | 0 | 71695 | 0 |
| Mode SS | |||
|---|---|---|---|
| Quadrant | BADHDUFLAG | Total packets | Discarded packets |
| A | 0 | 372 | 0 |
| B | 0 | 372 | 0 |
| C | 0 | 372 | 0 |
| D | 0 | 372 | 0 |
| Quadrant | Total seconds | Saturated seconds | Saturation percentage |
|---|---|---|---|
| A | 18214 | 19 | 0.104315% |
| B | 18214 | 851 | 4.672230% |
| C | 18214 | 407 | 2.234545% |
| D | 18214 | 2425 | 13.313934% |
Noise dominated data is calculated using 1-second bins in cleaned event files. If a bin has >2000 counts, and if more than 50% of those come from <1% of pixels, then it is considered to be noise-dominated and hence unusable.
| Quadrant | # 1 sec bins | Bins with >0 counts | Bins with >2000 counts | High rate bins dominated by noise | Noise dominated (total time) | Noise dominated (detector-on time) | Marked lightcurve |
|---|---|---|---|---|---|---|---|
| A | 34826 | 18216 | 1 | 1 | 0.00% | 0.01% | 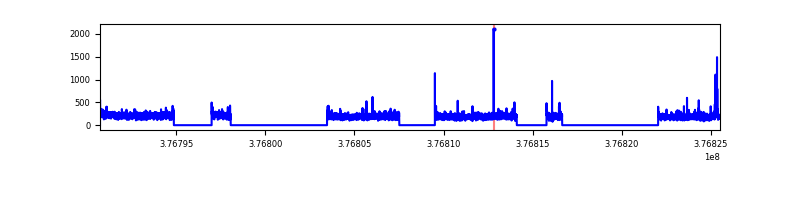 |
| B | 34825 | 18214 | 17 | 17 | 0.05% | 0.09% |  |
| C | 34825 | 18213 | 46 | 46 | 0.13% | 0.25% |  |
| D | 34825 | 18214 | 122 | 122 | 0.35% | 0.67% |  |
Top three noisy pixels from each quadrant. If the there are fewer than three noisy pixels in the level2.evt file, extra rows are filled as -1
| Pixel properties | Quadrant properties | ||||||
|---|---|---|---|---|---|---|---|
| Quadrant | DetID | PixID | Counts | Sigma | Mean | Median | Sigma |
| A | 13 | 254 | 34116 | 158.49 | 949 | 934 | 209.4 |
| A | 12 | 227 | 28283 | 130.63 | 949 | 934 | 209.4 |
| A | 13 | 6 | 17965 | 81.35 | 949 | 934 | 209.4 |
| B | 5 | 172 | 1381314 | 7304.43 | 955 | 937 | 189.0 |
| B | 5 | 255 | 750950 | 3968.78 | 955 | 937 | 189.0 |
| B | 4 | 170 | 343053 | 1810.35 | 955 | 937 | 189.0 |
| C | 15 | 214 | 814923 | 3776.85 | 942 | 937 | 215.5 |
| C | 1 | 23 | 612542 | 2837.81 | 942 | 937 | 215.5 |
| C | 0 | 10 | 518486 | 2401.4 | 942 | 937 | 215.5 |
| D | 8 | 195 | 4745923 | 20876.13 | 887 | 869 | 227.3 |
| D | 2 | 250 | 1485877 | 6533.37 | 887 | 869 | 227.3 |
| D | 2 | 120 | 1436878 | 6317.8 | 887 | 869 | 227.3 |
Histogram calculated using DETX and DETY for each event in the final _common_clean file
| Quadrant A |  |
 |
Quadrant B |
|---|---|---|---|
| Quadrant D | 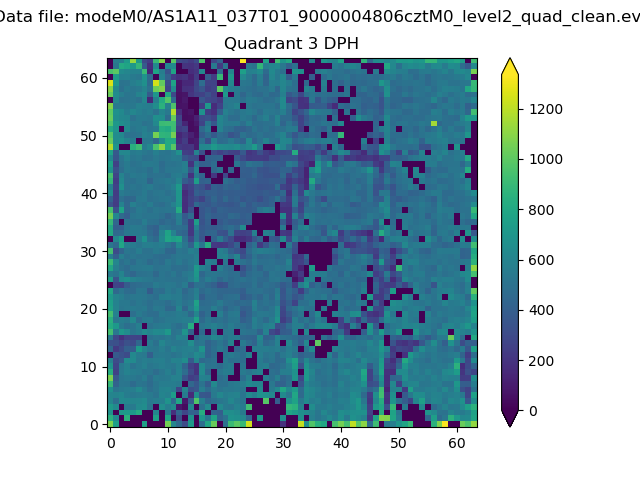 |
 |
Quadrant C |
| Plot type | Count rate plots | Images |
|---|---|---|
| Comparison with Poisson distribution Blue bars denote a histogram of data divided into 1 sec bins. Red curve is a Poisson curve with rate = median count rate of data. |
 |
 |
| Quadrant-wise count rates Data is divided into 100 sec bins |
 |
|
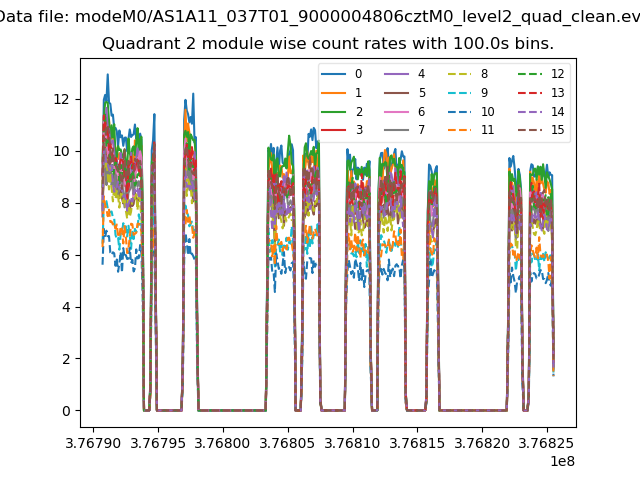
| Module-wise count rates for Quadrant A Data is divided into 100 sec bins |
 |
 |
| Module-wise count rates for Quadrant B Data is divided into 100 sec bins |
 |
 |
| Module-wise count rates for Quadrant C Data is divided into 100 sec bins |
 |
 |
| Module-wise count rates for Quadrant D Data is divided into 100 sec bins |
 |
 |
| Parameter | Plot |
|---|---|
| CZT HV Monitor |  |
| D_VDD | 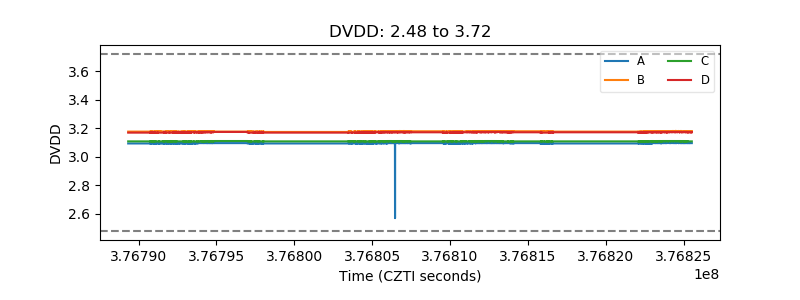 |
| Temperature 1 |  |
| Veto HV Monitor | 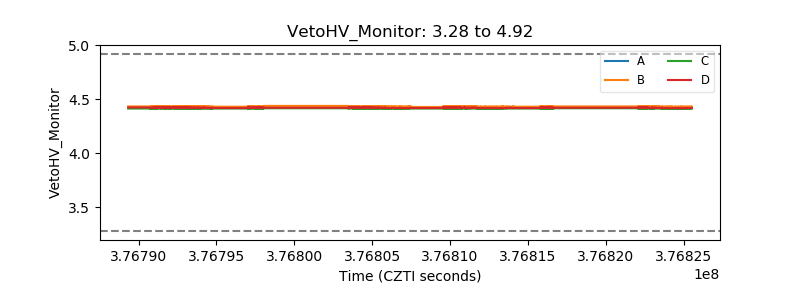 |
| Veto LLD | 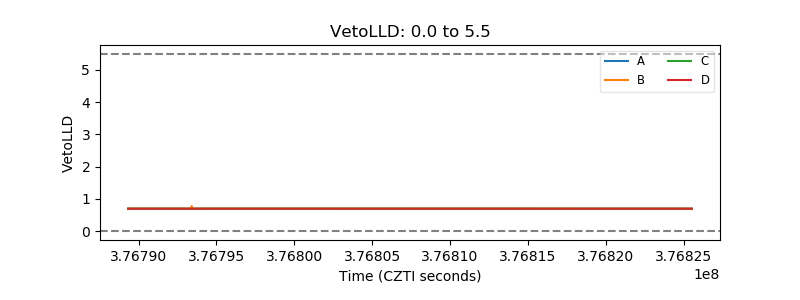 |
| Alpha Counter |  |
| _CPM_Rate | 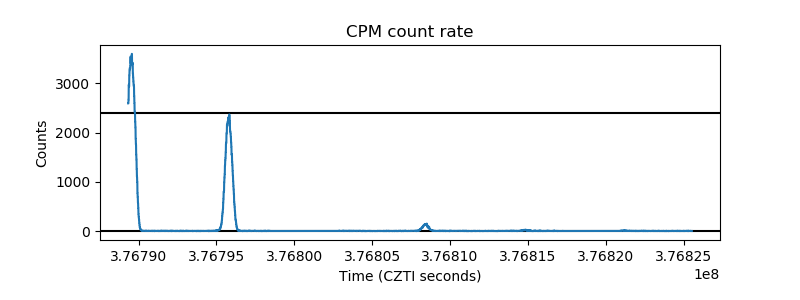 |
| CZT Counter |  |
| +2.5 Volts monitor |  |
| +5 Volts monitor |  |
| _ROLL_ROT |  |
| _Roll_DEC |  |
| _Roll_RA | 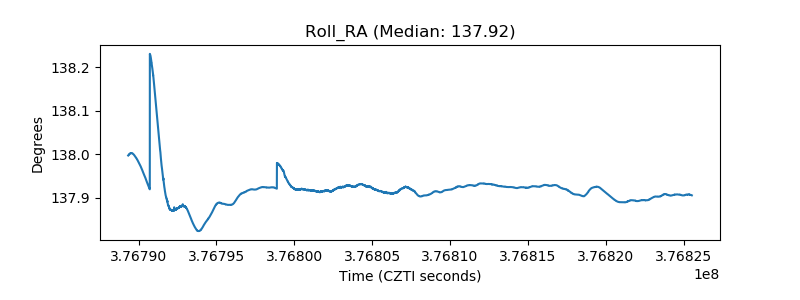 |
| Veto Counter |  |