| Param | Original file | Final file |
|---|---|---|
| Filename | modeM0/AS1A11_060T01_9000004804cztM0_level2_bc.evt | modeM0/AS1A11_060T01_9000004804cztM0_level2_quad_clean.evt |
| Size (bytes) | 9,727,323,840 | 2,331,518,400 |
| Size | 9.1 GB | 2.2 GB |
| Events in quadrant A | 39,076,584 | 14,921,408 |
| Events in quadrant B | 74,229,897 | 14,398,530 |
| Events in quadrant C | 69,272,387 | 14,508,994 |
| Events in quadrant D | 99,090,458 | 13,743,599 |
| Mode M9 | |||
|---|---|---|---|
| Quadrant | BADHDUFLAG | Total packets | Discarded packets |
| A | 0 | 727 | 0 |
| B | 0 | 727 | 0 |
| C | 0 | 727 | 0 |
| D | 0 | 728 | 0 |
| Mode M0 | |||
|---|---|---|---|
| Quadrant | BADHDUFLAG | Total packets | Discarded packets |
| A | 0 | 383656 | 0 |
| B | 0 | 530836 | 0 |
| C | 0 | 479270 | 0 |
| D | 0 | 595415 | 0 |
| Mode SS | |||
|---|---|---|---|
| Quadrant | BADHDUFLAG | Total packets | Discarded packets |
| A | 0 | 3892 | 0 |
| B | 0 | 3892 | 0 |
| C | 0 | 3892 | 0 |
| D | 0 | 3892 | 0 |
| Quadrant | Total seconds | Saturated seconds | Saturation percentage |
|---|---|---|---|
| A | 190437 | 233 | 0.122350% |
| B | 190437 | 13596 | 7.139369% |
| C | 190437 | 3170 | 1.664592% |
| D | 190437 | 8761 | 4.600472% |
Noise dominated data is calculated using 1-second bins in cleaned event files. If a bin has >2000 counts, and if more than 50% of those come from <1% of pixels, then it is considered to be noise-dominated and hence unusable.
| Quadrant | # 1 sec bins | Bins with >0 counts | Bins with >2000 counts | High rate bins dominated by noise | Noise dominated (total time) | Noise dominated (detector-on time) | Marked lightcurve |
|---|---|---|---|---|---|---|---|
| A | 267916 | 190441 | 1 | 1 | 0.00% | 0.00% |  |
| B | 267916 | 190429 | 419 | 419 | 0.16% | 0.22% |  |
| C | 267916 | 190440 | 603 | 603 | 0.23% | 0.32% | 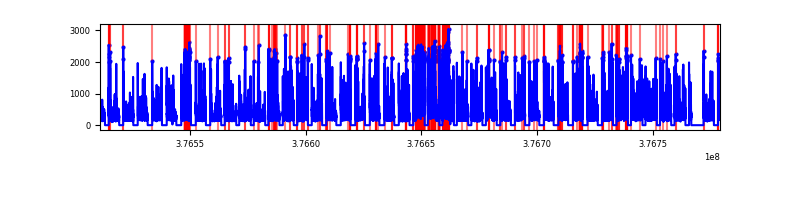 |
| D | 267916 | 190435 | 836 | 836 | 0.31% | 0.44% |  |
Top three noisy pixels from each quadrant. If the there are fewer than three noisy pixels in the level2.evt file, extra rows are filled as -1
| Pixel properties | Quadrant properties | ||||||
|---|---|---|---|---|---|---|---|
| Quadrant | DetID | PixID | Counts | Sigma | Mean | Median | Sigma |
| A | 13 | 254 | 295872 | 130.59 | 10040 | 9863 | 2190.1 |
| A | 13 | 6 | 188986 | 81.79 | 10040 | 9863 | 2190.1 |
| A | 10 | 83 | 114893 | 47.96 | 10040 | 9863 | 2190.1 |
| B | 5 | 172 | 17670789 | 9128.07 | 9882 | 9657 | 1934.8 |
| B | 5 | 255 | 14972047 | 7733.24 | 9882 | 9657 | 1934.8 |
| B | 0 | 213 | 1661702 | 853.85 | 9882 | 9657 | 1934.8 |
| C | 15 | 214 | 7850847 | 3567.7 | 9847 | 9787 | 2197.8 |
| C | 4 | 254 | 5791336 | 2630.62 | 9847 | 9787 | 2197.8 |
| C | 3 | 233 | 4159060 | 1887.93 | 9847 | 9787 | 2197.8 |
| D | 8 | 195 | 34174561 | 15102.87 | 9713 | 9447 | 2262.2 |
| D | 2 | 250 | 9584254 | 4232.6 | 9713 | 9447 | 2262.2 |
| D | 13 | 249 | 5079567 | 2241.27 | 9713 | 9447 | 2262.2 |
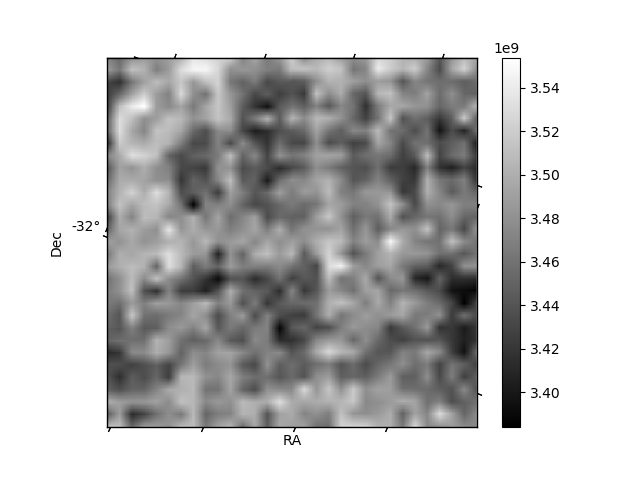
Histogram calculated using DETX and DETY for each event in the final _common_clean file
| Quadrant A | 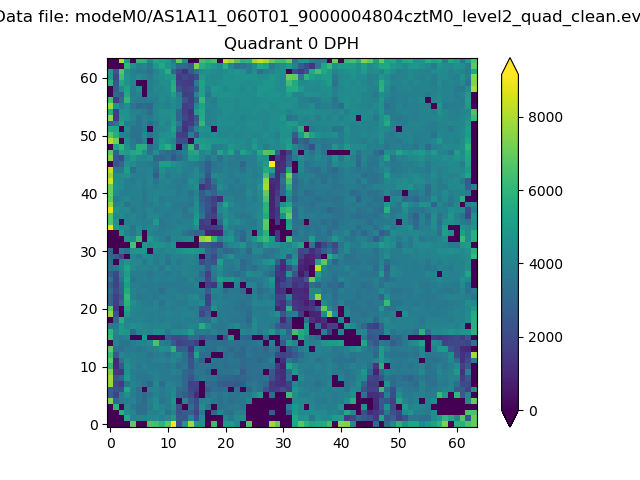 |
 |
Quadrant B |
|---|---|---|---|
| Quadrant D |  |
 |
Quadrant C |
| Plot type | Count rate plots | Images |
|---|---|---|
| Comparison with Poisson distribution Blue bars denote a histogram of data divided into 1 sec bins. Red curve is a Poisson curve with rate = median count rate of data. |
 |
 |
| Quadrant-wise count rates Data is divided into 100 sec bins |
 |
|
| Module-wise count rates for Quadrant A Data is divided into 100 sec bins |
 |
 |
| Module-wise count rates for Quadrant B Data is divided into 100 sec bins |
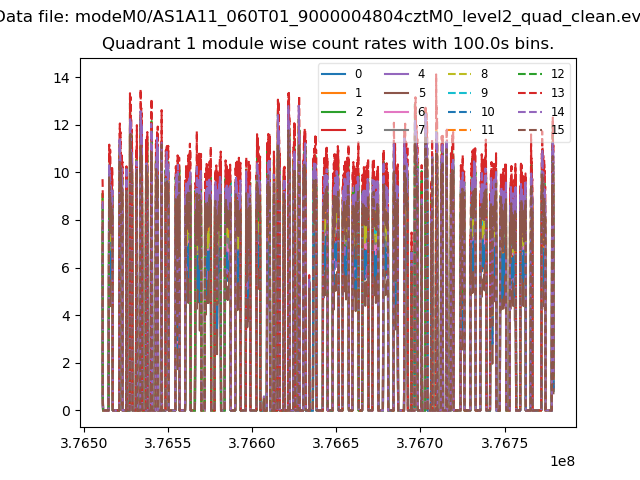 |
 |
| Module-wise count rates for Quadrant C Data is divided into 100 sec bins |
 |
 |
| Module-wise count rates for Quadrant D Data is divided into 100 sec bins |
 |
 |
| Parameter | Plot |
|---|---|
| CZT HV Monitor |  |
| D_VDD | 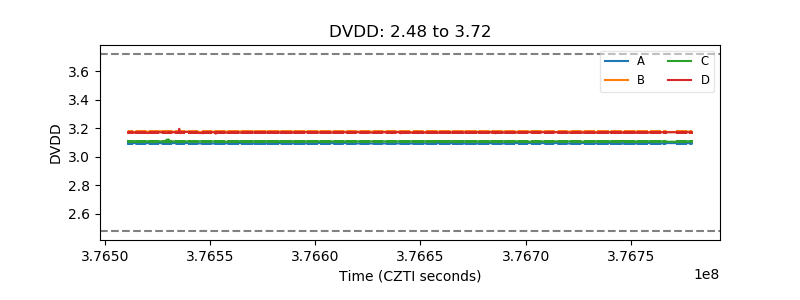 |
| Temperature 1 |  |
| Veto HV Monitor | 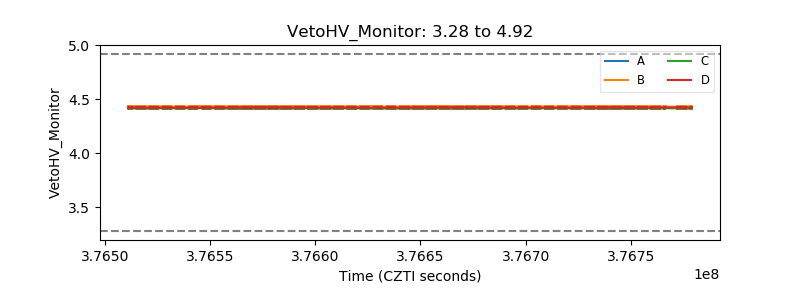 |
| Veto LLD |  |
| Alpha Counter | 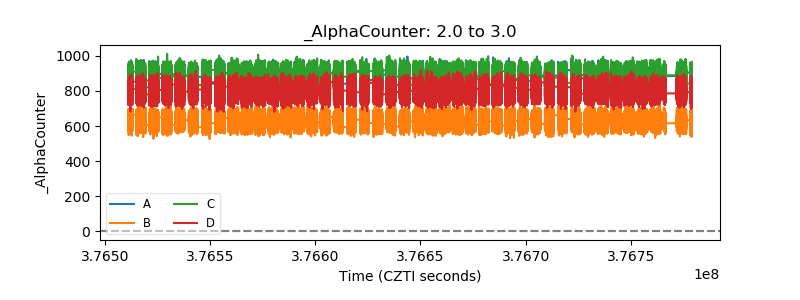 |
| _CPM_Rate |  |
| CZT Counter |  |
| +2.5 Volts monitor |  |
| +5 Volts monitor |  |
| _ROLL_ROT |  |
| _Roll_DEC | 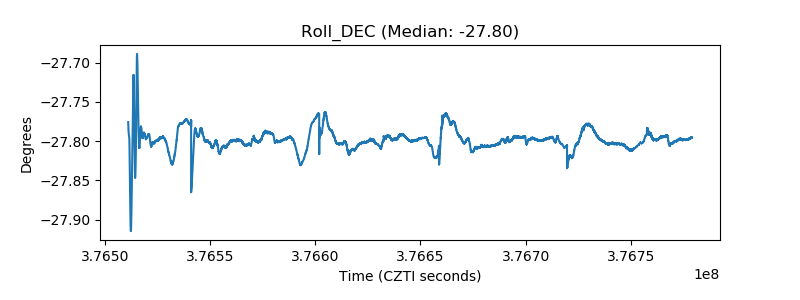 |
| _Roll_RA |  |
| Veto Counter |  |