| Param | Original file | Final file |
|---|---|---|
| Filename | modeM0/AS1A11_065T10_9000004800cztM0_level2_bc.evt | modeM0/AS1A11_065T10_9000004800cztM0_level2_quad_clean.evt |
| Size (bytes) | 97,623,360 | 29,361,600 |
| Size | 93.1 MB | 28.0 MB |
| Events in quadrant A | 392,727 | 191,624 |
| Events in quadrant B | 622,374 | 188,569 |
| Events in quadrant C | 552,148 | 187,024 |
| Events in quadrant D | 1,247,972 | 178,924 |
| Mode M9 | |||
|---|---|---|---|
| Quadrant | BADHDUFLAG | Total packets | Discarded packets |
| A | 0 | 14 | 0 |
| B | 0 | 14 | 0 |
| C | 0 | 14 | 0 |
| D | 0 | 14 | 0 |
| Mode M0 | |||
|---|---|---|---|
| Quadrant | BADHDUFLAG | Total packets | Discarded packets |
| A | 0 | 3966 | 0 |
| B | 0 | 4733 | 0 |
| C | 0 | 4439 | 0 |
| D | 0 | 6734 | 0 |
| Mode SS | |||
|---|---|---|---|
| Quadrant | BADHDUFLAG | Total packets | Discarded packets |
| A | 0 | 42 | 0 |
| B | 0 | 42 | 0 |
| C | 0 | 42 | 0 |
| D | 0 | 42 | 0 |
| Quadrant | Total seconds | Saturated seconds | Saturation percentage |
|---|---|---|---|
| A | 1956 | 2 | 0.102249% |
| B | 1956 | 36 | 1.840491% |
| C | 1956 | 40 | 2.044990% |
| D | 1956 | 92 | 4.703476% |
Noise dominated data is calculated using 1-second bins in cleaned event files. If a bin has >2000 counts, and if more than 50% of those come from <1% of pixels, then it is considered to be noise-dominated and hence unusable.
| Quadrant | # 1 sec bins | Bins with >0 counts | Bins with >2000 counts | High rate bins dominated by noise | Noise dominated (total time) | Noise dominated (detector-on time) | Marked lightcurve |
|---|---|---|---|---|---|---|---|
| A | 3388 | 1956 | 0 | 0 | 0.00% | 0.00% |  |
| B | 3388 | 1956 | 3 | 3 | 0.09% | 0.15% |  |
| C | 3388 | 1956 | 1 | 1 | 0.03% | 0.05% | 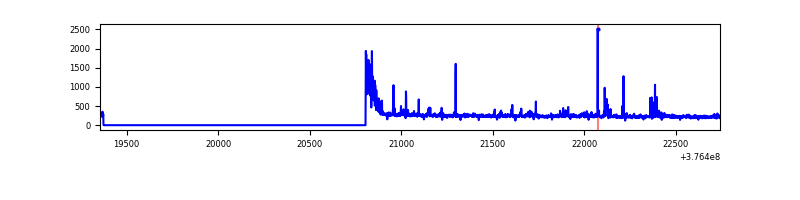 |
| D | 3388 | 1956 | 7 | 7 | 0.21% | 0.36% | 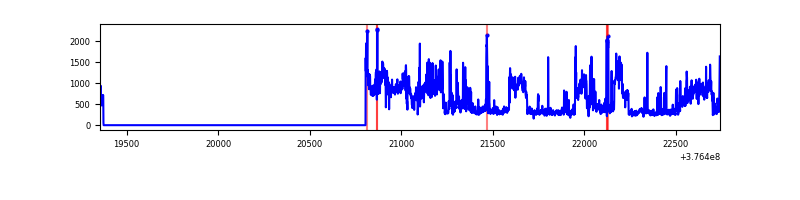 |
Top three noisy pixels from each quadrant. If the there are fewer than three noisy pixels in the level2.evt file, extra rows are filled as -1
| Pixel properties | Quadrant properties | ||||||
|---|---|---|---|---|---|---|---|
| Quadrant | DetID | PixID | Counts | Sigma | Mean | Median | Sigma |
| A | 7 | 192 | 4057 | 166.12 | 97 | 95 | 23.8 |
| A | 13 | 6 | 3996 | 163.57 | 97 | 95 | 23.8 |
| A | 13 | 254 | 3951 | 161.68 | 97 | 95 | 23.8 |
| B | 5 | 172 | 105003 | 4804.69 | 96 | 94 | 21.8 |
| B | 5 | 255 | 33389 | 1524.87 | 96 | 94 | 21.8 |
| B | 0 | 190 | 21057 | 960.08 | 96 | 94 | 21.8 |
| C | 15 | 214 | 82307 | 3465.52 | 93 | 91 | 23.7 |
| C | 0 | 10 | 57641 | 2425.82 | 93 | 91 | 23.7 |
| C | 1 | 23 | 24839 | 1043.16 | 93 | 91 | 23.7 |
| D | 8 | 195 | 633584 | 24561.51 | 93 | 90 | 25.8 |
| D | 12 | 233 | 66901 | 2590.36 | 93 | 90 | 25.8 |
| D | 10 | 118 | 30728 | 1187.88 | 93 | 90 | 25.8 |
Histogram calculated using DETX and DETY for each event in the final _common_clean file
| Quadrant A |  |
 |
Quadrant B |
|---|---|---|---|
| Quadrant D | 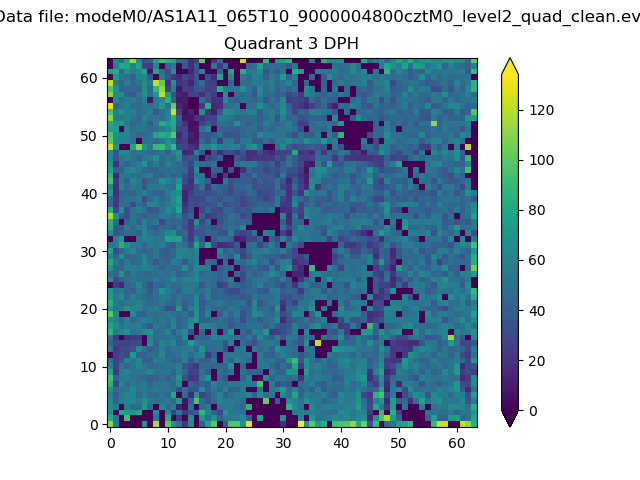 |
 |
Quadrant C |
| Plot type | Count rate plots | Images |
|---|---|---|
| Comparison with Poisson distribution Blue bars denote a histogram of data divided into 1 sec bins. Red curve is a Poisson curve with rate = median count rate of data. |
 |
 |
| Quadrant-wise count rates Data is divided into 100 sec bins |
 |
|
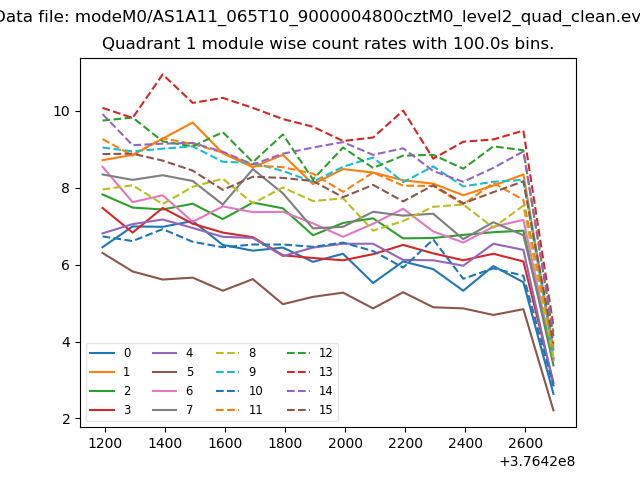
| Module-wise count rates for Quadrant A Data is divided into 100 sec bins |
 |
 |
| Module-wise count rates for Quadrant B Data is divided into 100 sec bins |
 |
 |
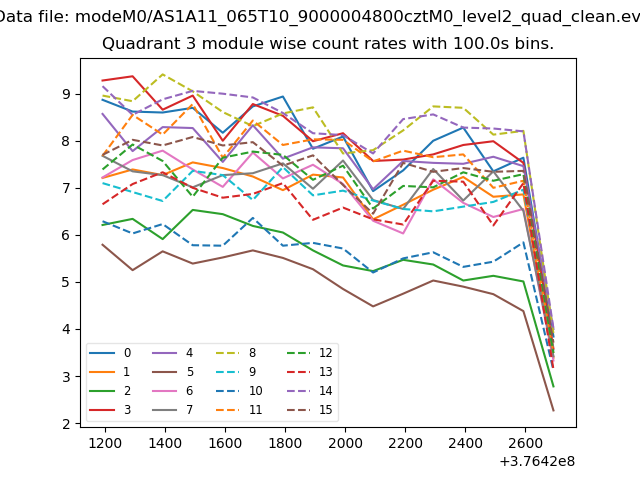
| Module-wise count rates for Quadrant C Data is divided into 100 sec bins |
 |
 |
| Module-wise count rates for Quadrant D Data is divided into 100 sec bins |
 |
 |
| Parameter | Plot |
|---|---|
| CZT HV Monitor |  |
| D_VDD | 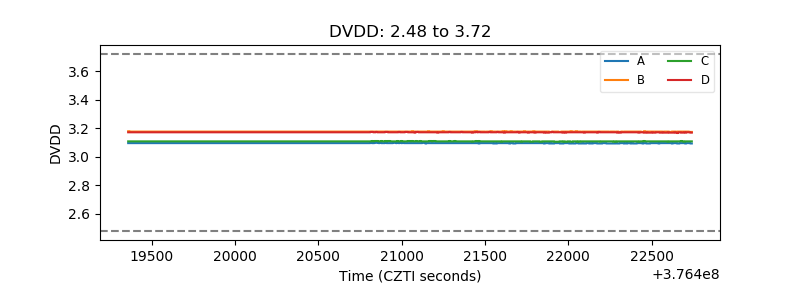 |
| Temperature 1 |  |
| Veto HV Monitor | 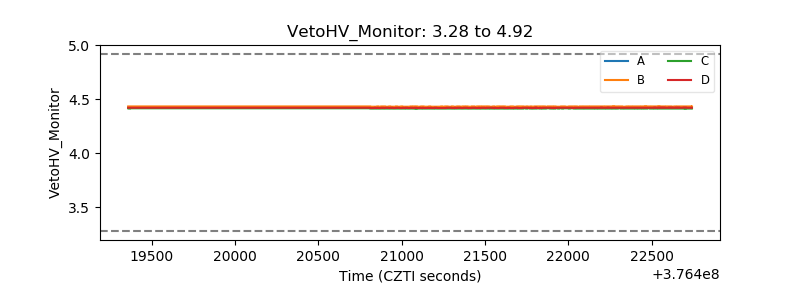 |
| Veto LLD |  |
| Alpha Counter | 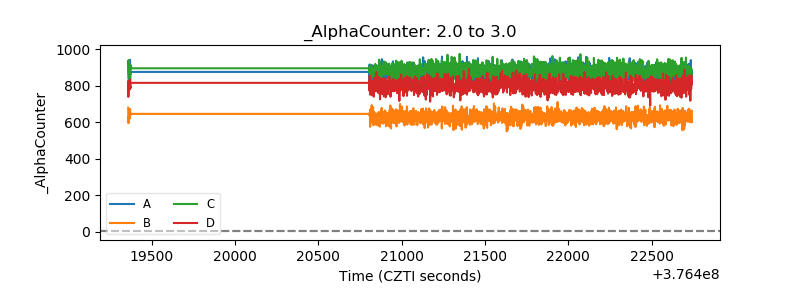 |
| _CPM_Rate |  |
| CZT Counter | 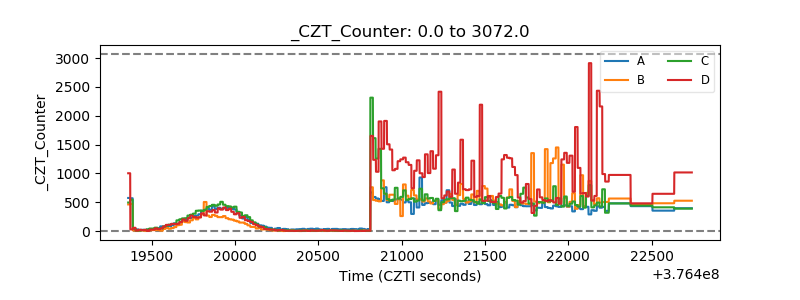 |
| +2.5 Volts monitor |  |
| +5 Volts monitor |  |
| _ROLL_ROT | 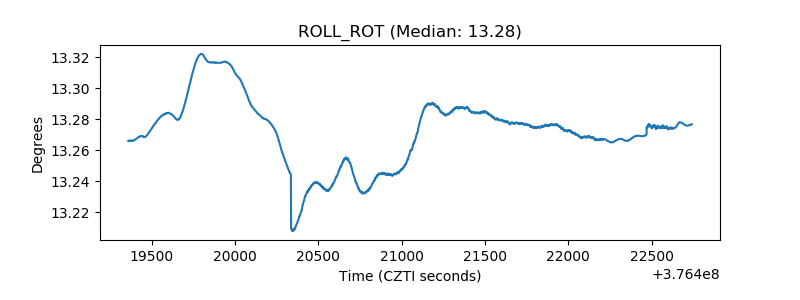 |
| _Roll_DEC |  |
| _Roll_RA | 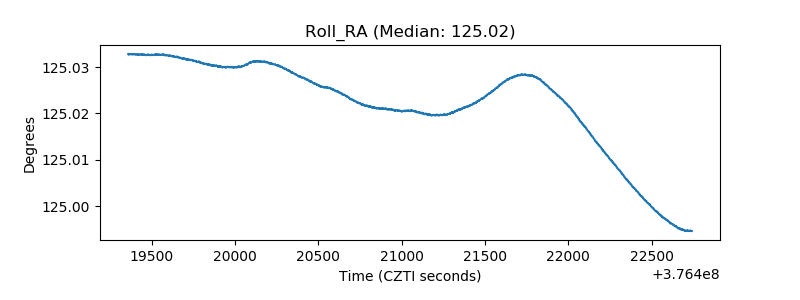 |
| Veto Counter |  |