| Param | Original file | Final file |
|---|---|---|
| Filename | modeM0/AS1A11_047T10_9000004802cztM0_level2_bc.evt | modeM0/AS1A11_047T10_9000004802cztM0_level2_quad_clean.evt |
| Size (bytes) | 2,905,767,360 | 801,155,520 |
| Size | 2.7 GB | 764.0 MB |
| Events in quadrant A | 12,292,111 | 5,191,285 |
| Events in quadrant B | 22,527,364 | 5,109,269 |
| Events in quadrant C | 16,006,725 | 5,088,265 |
| Events in quadrant D | 33,154,394 | 4,819,400 |
| Mode SS | |||
|---|---|---|---|
| Quadrant | BADHDUFLAG | Total packets | Discarded packets |
| A | 0 | 1208 | 0 |
| B | 0 | 1208 | 0 |
| C | 0 | 1208 | 0 |
| D | 0 | 1208 | 0 |
| Mode M9 | |||
|---|---|---|---|
| Quadrant | BADHDUFLAG | Total packets | Discarded packets |
| A | 0 | 230 | 0 |
| B | 0 | 230 | 0 |
| C | 0 | 230 | 0 |
| D | 0 | 231 | 0 |
| Mode M0 | |||
|---|---|---|---|
| Quadrant | BADHDUFLAG | Total packets | Discarded packets |
| A | 0 | 119685 | 0 |
| B | 0 | 159217 | 0 |
| C | 0 | 126807 | 0 |
| D | 0 | 188397 | 0 |
| Quadrant | Total seconds | Saturated seconds | Saturation percentage |
|---|---|---|---|
| A | 59176 | 59 | 0.099703% |
| B | 59176 | 2708 | 4.576180% |
| C | 59176 | 472 | 0.797621% |
| D | 59176 | 1876 | 3.170204% |
Noise dominated data is calculated using 1-second bins in cleaned event files. If a bin has >2000 counts, and if more than 50% of those come from <1% of pixels, then it is considered to be noise-dominated and hence unusable.
| Quadrant | # 1 sec bins | Bins with >0 counts | Bins with >2000 counts | High rate bins dominated by noise | Noise dominated (total time) | Noise dominated (detector-on time) | Marked lightcurve |
|---|---|---|---|---|---|---|---|
| A | 86541 | 59178 | 0 | 0 | 0.00% | 0.00% | 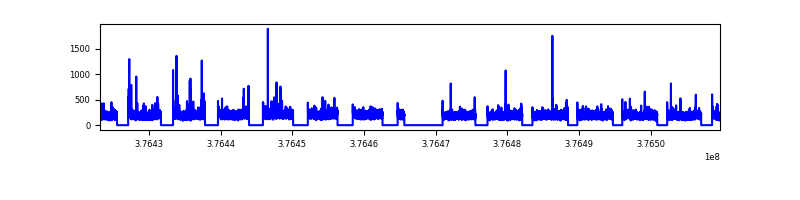 |
| B | 86541 | 59175 | 112 | 112 | 0.13% | 0.19% | 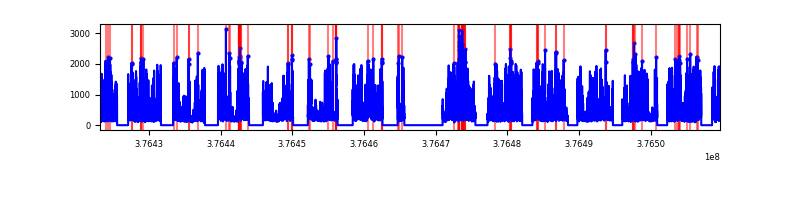 |
| C | 86541 | 59177 | 112 | 112 | 0.13% | 0.19% |  |
| D | 86541 | 59177 | 107 | 107 | 0.12% | 0.18% |  |
Top three noisy pixels from each quadrant. If the there are fewer than three noisy pixels in the level2.evt file, extra rows are filled as -1
| Pixel properties | Quadrant properties | ||||||
|---|---|---|---|---|---|---|---|
| Quadrant | DetID | PixID | Counts | Sigma | Mean | Median | Sigma |
| A | 15 | 169 | 139090 | 200.24 | 3083 | 3031 | 679.5 |
| A | 13 | 254 | 105171 | 150.32 | 3083 | 3031 | 679.5 |
| A | 13 | 6 | 91979 | 130.91 | 3083 | 3031 | 679.5 |
| B | 5 | 172 | 3845269 | 6432.36 | 3033 | 2969 | 597.3 |
| B | 5 | 255 | 2250466 | 3762.52 | 3033 | 2969 | 597.3 |
| B | 0 | 213 | 1320568 | 2205.78 | 3033 | 2969 | 597.3 |
| C | 15 | 214 | 2426055 | 3589.26 | 2975 | 2950 | 675.1 |
| C | 0 | 10 | 633030 | 933.31 | 2975 | 2950 | 675.1 |
| C | 14 | 254 | 526768 | 775.91 | 2975 | 2950 | 675.1 |
| D | 8 | 195 | 15322532 | 20139.74 | 2954 | 2873 | 760.7 |
| D | 2 | 250 | 2494831 | 3276.01 | 2954 | 2873 | 760.7 |
| D | 2 | 249 | 1093936 | 1434.35 | 2954 | 2873 | 760.7 |
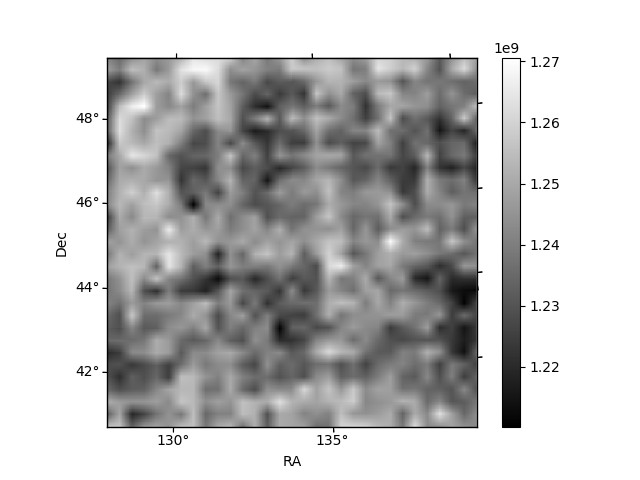
Histogram calculated using DETX and DETY for each event in the final _common_clean file
| Quadrant A |  |
 |
Quadrant B |
|---|---|---|---|
| Quadrant D |  |
 |
Quadrant C |
| Plot type | Count rate plots | Images |
|---|---|---|
| Comparison with Poisson distribution Blue bars denote a histogram of data divided into 1 sec bins. Red curve is a Poisson curve with rate = median count rate of data. |
 |
 |
| Quadrant-wise count rates Data is divided into 100 sec bins |
 |
|
| Module-wise count rates for Quadrant A Data is divided into 100 sec bins |
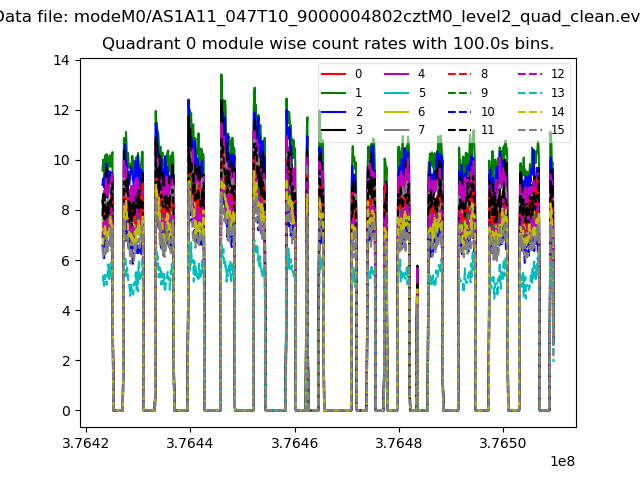 |
 |
| Module-wise count rates for Quadrant B Data is divided into 100 sec bins |
 |
 |
| Module-wise count rates for Quadrant C Data is divided into 100 sec bins |
 |
 |
| Module-wise count rates for Quadrant D Data is divided into 100 sec bins |
 |
 |
| Parameter | Plot |
|---|---|
| CZT HV Monitor | 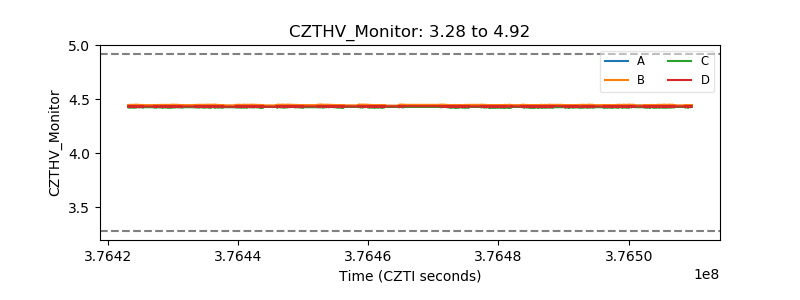 |
| D_VDD | 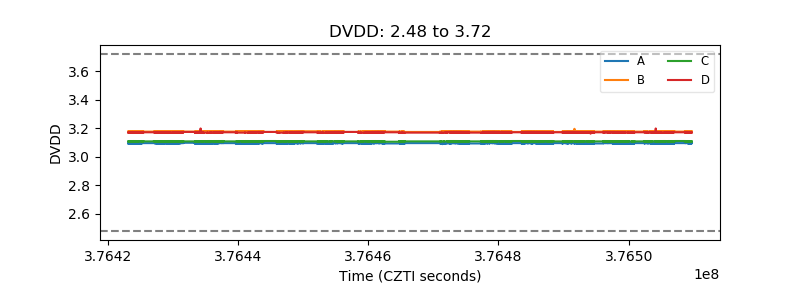 |
| Temperature 1 | 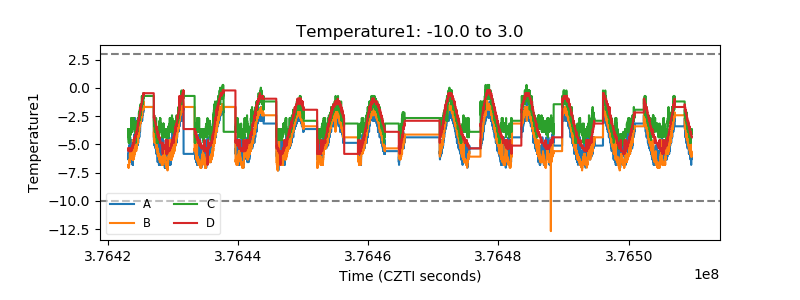 |
| Veto HV Monitor | 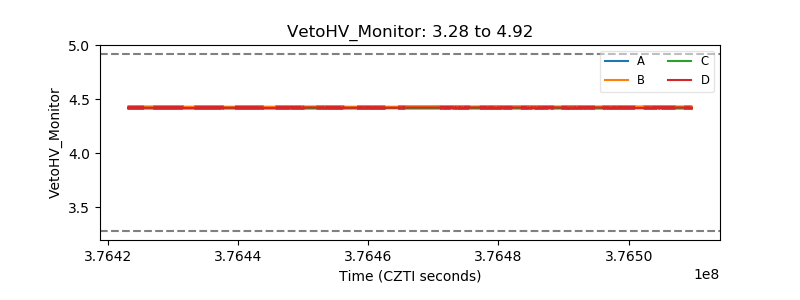 |
| Veto LLD |  |
| Alpha Counter |  |
| _CPM_Rate | 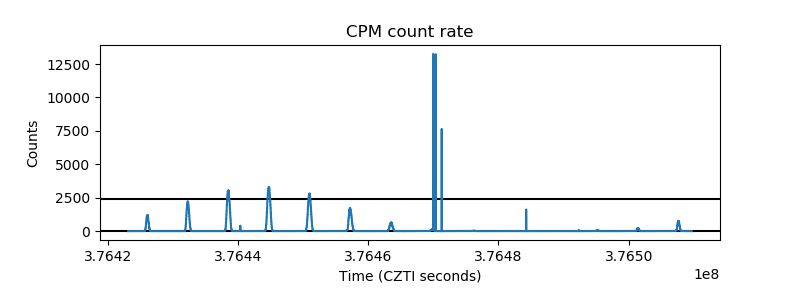 |
| CZT Counter |  |
| +2.5 Volts monitor | 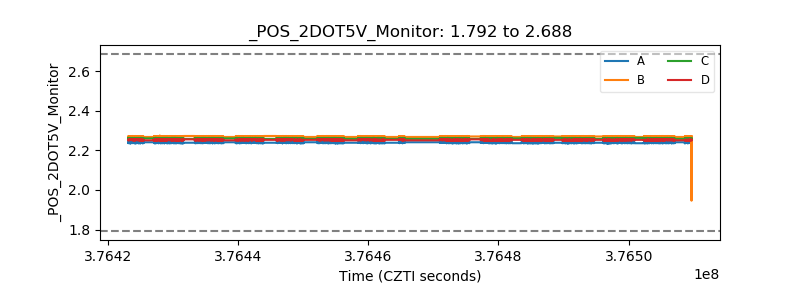 |
| +5 Volts monitor | 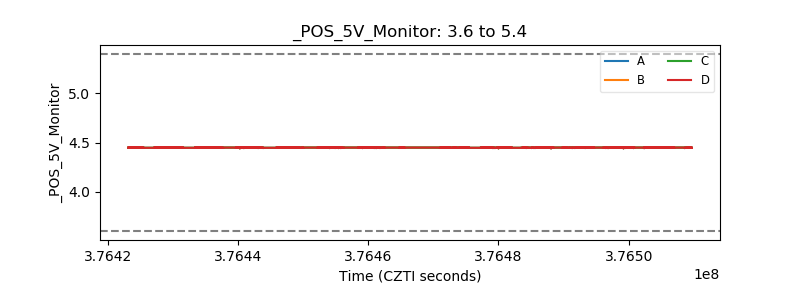 |
| _ROLL_ROT | 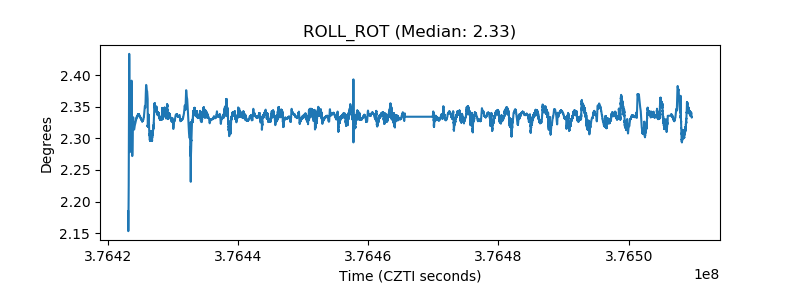 |
| _Roll_DEC |  |
| _Roll_RA |  |
| Veto Counter |  |