| Param | Original file | Final file |
|---|---|---|
| Filename | modeM0/AS1A11_065T07_9000004798cztM0_level2_bc.evt | modeM0/AS1A11_065T07_9000004798cztM0_level2_quad_clean.evt |
| Size (bytes) | 274,668,480 | 59,829,120 |
| Size | 261.9 MB | 57.1 MB |
| Events in quadrant A | 1,143,393 | 366,959 |
| Events in quadrant B | 2,130,538 | 354,634 |
| Events in quadrant C | 1,492,898 | 358,267 |
| Events in quadrant D | 3,163,161 | 339,679 |
| Mode M9 | |||
|---|---|---|---|
| Quadrant | BADHDUFLAG | Total packets | Discarded packets |
| A | 0 | 17 | 0 |
| B | 0 | 17 | 0 |
| C | 0 | 17 | 0 |
| D | 0 | 18 | 0 |
| Mode SS | |||
|---|---|---|---|
| Quadrant | BADHDUFLAG | Total packets | Discarded packets |
| A | 0 | 112 | 0 |
| B | 0 | 112 | 0 |
| C | 0 | 112 | 0 |
| D | 0 | 112 | 0 |
| Mode M0 | |||
|---|---|---|---|
| Quadrant | BADHDUFLAG | Total packets | Discarded packets |
| A | 0 | 11283 | 0 |
| B | 0 | 15717 | 0 |
| C | 0 | 11959 | 0 |
| D | 0 | 17743 | 0 |
| Quadrant | Total seconds | Saturated seconds | Saturation percentage |
|---|---|---|---|
| A | 5607 | 4 | 0.071339% |
| B | 5607 | 428 | 7.633315% |
| C | 5607 | 59 | 1.052256% |
| D | 5607 | 82 | 1.462458% |
Noise dominated data is calculated using 1-second bins in cleaned event files. If a bin has >2000 counts, and if more than 50% of those come from <1% of pixels, then it is considered to be noise-dominated and hence unusable.
| Quadrant | # 1 sec bins | Bins with >0 counts | Bins with >2000 counts | High rate bins dominated by noise | Noise dominated (total time) | Noise dominated (detector-on time) | Marked lightcurve |
|---|---|---|---|---|---|---|---|
| A | 7159 | 5607 | 0 | 0 | 0.00% | 0.00% | 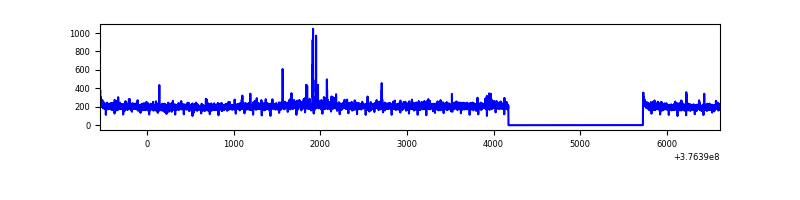 |
| B | 7159 | 5607 | 15 | 15 | 0.21% | 0.27% |  |
| C | 7159 | 5606 | 3 | 3 | 0.04% | 0.05% |  |
| D | 7159 | 5606 | 10 | 10 | 0.14% | 0.18% |  |
Top three noisy pixels from each quadrant. If the there are fewer than three noisy pixels in the level2.evt file, extra rows are filled as -1
| Pixel properties | Quadrant properties | ||||||
|---|---|---|---|---|---|---|---|
| Quadrant | DetID | PixID | Counts | Sigma | Mean | Median | Sigma |
| A | 13 | 6 | 11987 | 179.76 | 285 | 278 | 65.1 |
| A | 15 | 47 | 11551 | 173.06 | 285 | 278 | 65.1 |
| A | 13 | 254 | 9861 | 147.12 | 285 | 278 | 65.1 |
| B | 5 | 172 | 492928 | 8582.26 | 276 | 270 | 57.4 |
| B | 5 | 255 | 373461 | 6501.11 | 276 | 270 | 57.4 |
| B | 4 | 251 | 71451 | 1240.0 | 276 | 270 | 57.4 |
| C | 15 | 214 | 233588 | 3647.67 | 274 | 272 | 64.0 |
| C | 0 | 10 | 117790 | 1837.28 | 274 | 272 | 64.0 |
| C | 14 | 254 | 35791 | 555.3 | 274 | 272 | 64.0 |
| D | 8 | 195 | 1545947 | 23203.89 | 275 | 266 | 66.6 |
| D | 2 | 250 | 121781 | 1824.19 | 275 | 266 | 66.6 |
| D | 12 | 6 | 76843 | 1149.58 | 275 | 266 | 66.6 |
Histogram calculated using DETX and DETY for each event in the final _common_clean file
| Quadrant A |  |
 |
Quadrant B |
|---|---|---|---|
| Quadrant D | 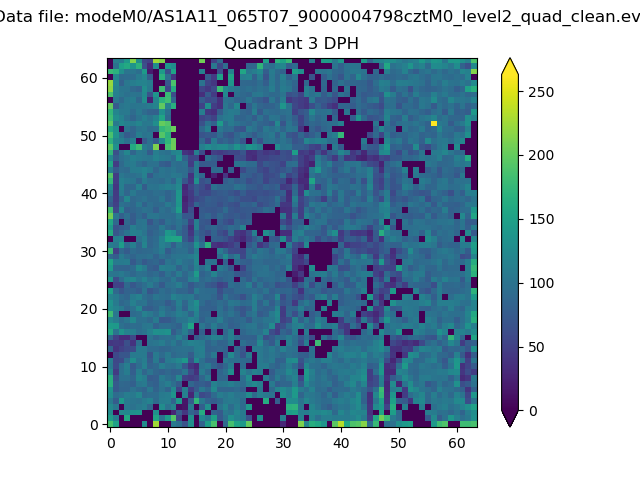 |
 |
Quadrant C |
| Plot type | Count rate plots | Images |
|---|---|---|
| Comparison with Poisson distribution Blue bars denote a histogram of data divided into 1 sec bins. Red curve is a Poisson curve with rate = median count rate of data. |
 |
 |
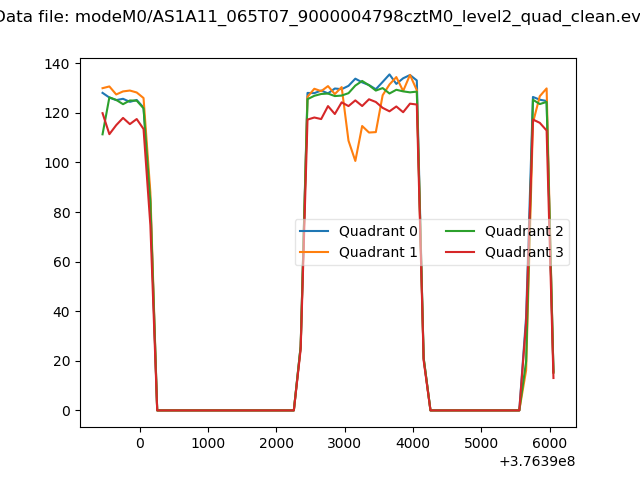
| Quadrant-wise count rates Data is divided into 100 sec bins |
 |
|
| Module-wise count rates for Quadrant A Data is divided into 100 sec bins |
 |
 |
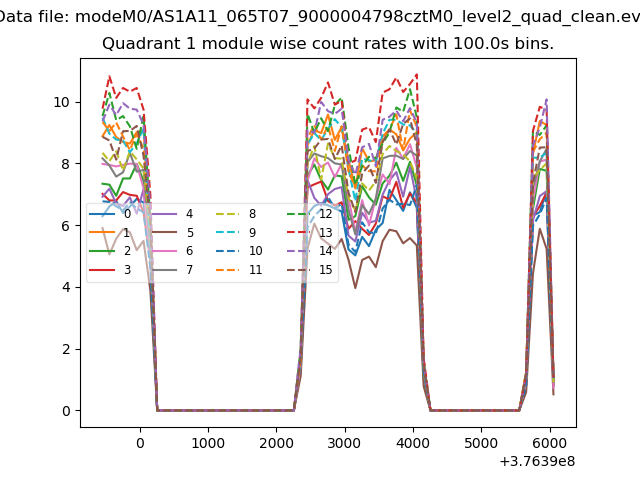
| Module-wise count rates for Quadrant B Data is divided into 100 sec bins |
 |
 |
| Module-wise count rates for Quadrant C Data is divided into 100 sec bins |
 |
 |
| Module-wise count rates for Quadrant D Data is divided into 100 sec bins |
 |
 |
| Parameter | Plot |
|---|---|
| CZT HV Monitor |  |
| D_VDD | 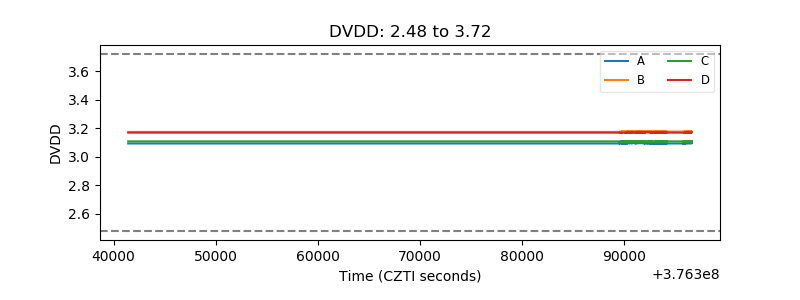 |
| Temperature 1 |  |
| Veto HV Monitor |  |
| Veto LLD |  |
| Alpha Counter |  |
| _CPM_Rate |  |
| CZT Counter | 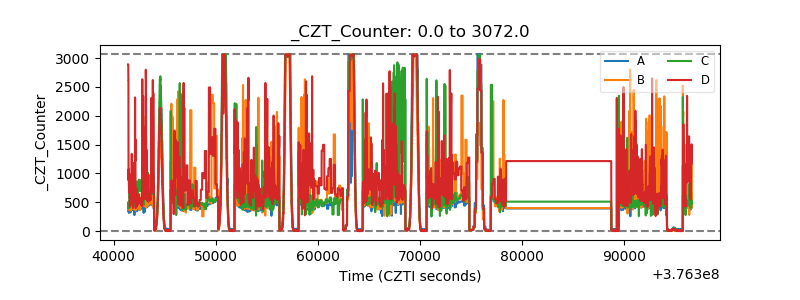 |
| +2.5 Volts monitor |  |
| +5 Volts monitor | 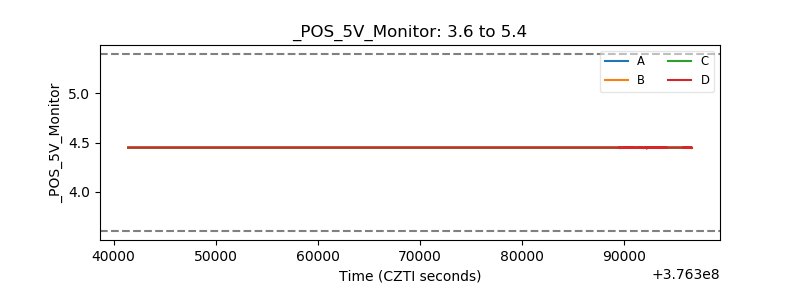 |
| _ROLL_ROT | 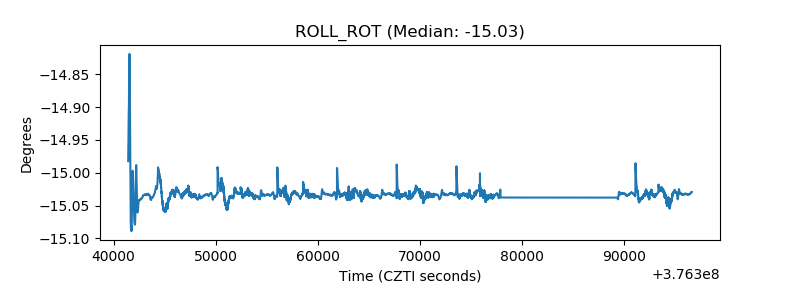 |
| _Roll_DEC | 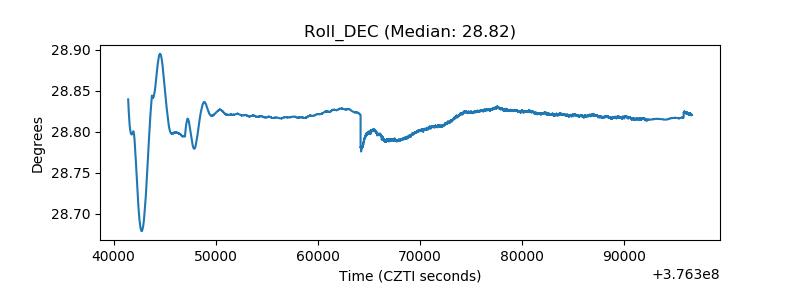 |
| _Roll_RA | 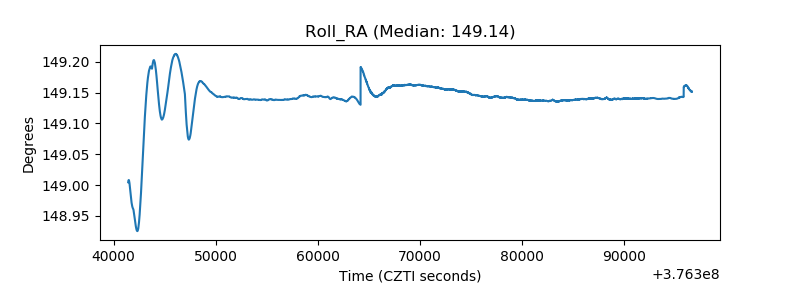 |
| Veto Counter |  |