| Param | Original file | Final file |
|---|---|---|
| Filename | modeM0/AS1A11_065T02_9000004796cztM0_level2_bc.evt | modeM0/AS1A11_065T02_9000004796cztM0_level2_quad_clean.evt |
| Size (bytes) | 868,075,200 | 264,879,360 |
| Size | 827.9 MB | 252.6 MB |
| Events in quadrant A | 3,803,538 | 1,786,098 |
| Events in quadrant B | 4,998,619 | 1,744,817 |
| Events in quadrant C | 4,675,142 | 1,743,790 |
| Events in quadrant D | 11,615,495 | 1,540,956 |
| Mode SS | |||
|---|---|---|---|
| Quadrant | BADHDUFLAG | Total packets | Discarded packets |
| A | 0 | 358 | 0 |
| B | 0 | 358 | 0 |
| C | 0 | 358 | 0 |
| D | 0 | 358 | 0 |
| Mode M9 | |||
|---|---|---|---|
| Quadrant | BADHDUFLAG | Total packets | Discarded packets |
| A | 0 | 55 | 0 |
| B | 0 | 55 | 0 |
| C | 0 | 55 | 0 |
| D | 0 | 55 | 0 |
| Mode M0 | |||
|---|---|---|---|
| Quadrant | BADHDUFLAG | Total packets | Discarded packets |
| A | 0 | 36509 | 0 |
| B | 0 | 41290 | 0 |
| C | 0 | 37817 | 0 |
| D | 0 | 68126 | 0 |
| Quadrant | Total seconds | Saturated seconds | Saturation percentage |
|---|---|---|---|
| A | 17509 | 26 | 0.148495% |
| B | 17509 | 491 | 2.804272% |
| C | 17509 | 143 | 0.816723% |
| D | 17509 | 2246 | 12.827689% |
Noise dominated data is calculated using 1-second bins in cleaned event files. If a bin has >2000 counts, and if more than 50% of those come from <1% of pixels, then it is considered to be noise-dominated and hence unusable.
| Quadrant | # 1 sec bins | Bins with >0 counts | Bins with >2000 counts | High rate bins dominated by noise | Noise dominated (total time) | Noise dominated (detector-on time) | Marked lightcurve |
|---|---|---|---|---|---|---|---|
| A | 23002 | 17511 | 1 | 1 | 0.00% | 0.01% | 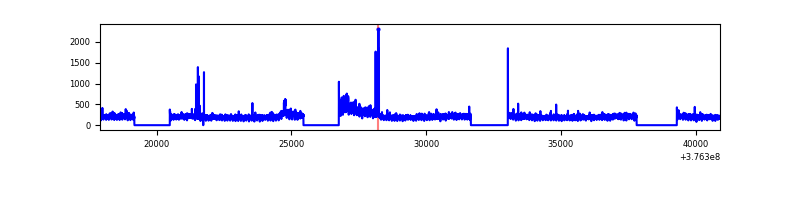 |
| B | 23002 | 17510 | 28 | 28 | 0.12% | 0.16% |  |
| C | 23002 | 17510 | 13 | 13 | 0.06% | 0.07% | 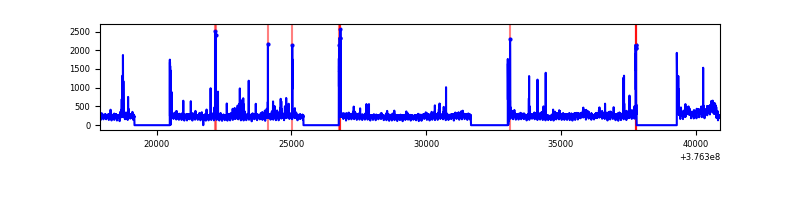 |
| D | 23002 | 17504 | 164 | 164 | 0.71% | 0.94% |  |
Top three noisy pixels from each quadrant. If the there are fewer than three noisy pixels in the level2.evt file, extra rows are filled as -1
| Pixel properties | Quadrant properties | ||||||
|---|---|---|---|---|---|---|---|
| Quadrant | DetID | PixID | Counts | Sigma | Mean | Median | Sigma |
| A | 7 | 192 | 319509 | 1607.91 | 878 | 863 | 198.2 |
| A | 9 | 143 | 31068 | 152.42 | 878 | 863 | 198.2 |
| A | 13 | 6 | 29726 | 145.64 | 878 | 863 | 198.2 |
| B | 5 | 172 | 952188 | 5487.39 | 859 | 840 | 173.4 |
| B | 5 | 200 | 207765 | 1193.55 | 859 | 840 | 173.4 |
| B | 0 | 213 | 101734 | 581.96 | 859 | 840 | 173.4 |
| C | 15 | 214 | 713124 | 3651.63 | 842 | 831 | 195.1 |
| C | 10 | 49 | 285224 | 1457.96 | 842 | 831 | 195.1 |
| C | 0 | 10 | 176639 | 901.29 | 842 | 831 | 195.1 |
| D | 8 | 195 | 4994767 | 25754.34 | 786 | 758 | 193.9 |
| D | 12 | 218 | 864671 | 4455.24 | 786 | 758 | 193.9 |
| D | 2 | 250 | 782600 | 4032.0 | 786 | 758 | 193.9 |
Histogram calculated using DETX and DETY for each event in the final _common_clean file
| Quadrant A |  |
 |
Quadrant B |
|---|---|---|---|
| Quadrant D |  |
 |
Quadrant C |
| Plot type | Count rate plots | Images |
|---|---|---|
| Comparison with Poisson distribution Blue bars denote a histogram of data divided into 1 sec bins. Red curve is a Poisson curve with rate = median count rate of data. |
 |
 |
| Quadrant-wise count rates Data is divided into 100 sec bins |
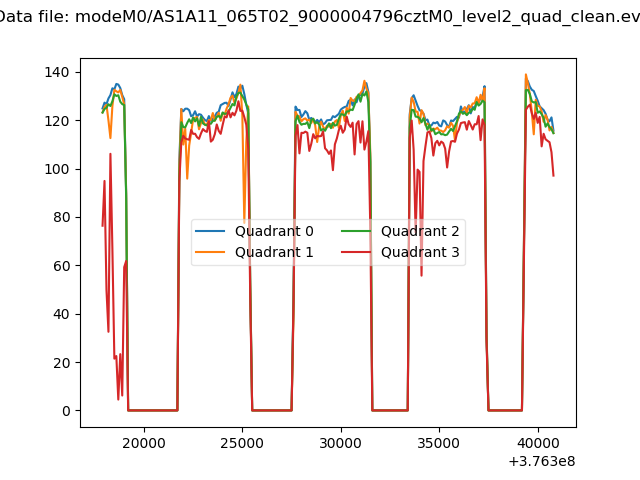 |
|
| Module-wise count rates for Quadrant A Data is divided into 100 sec bins |
 |
 |
| Module-wise count rates for Quadrant B Data is divided into 100 sec bins |
 |
 |
| Module-wise count rates for Quadrant C Data is divided into 100 sec bins |
 |
 |
| Module-wise count rates for Quadrant D Data is divided into 100 sec bins |
 |
 |
| Parameter | Plot |
|---|---|
| CZT HV Monitor |  |
| D_VDD |  |
| Temperature 1 |  |
| Veto HV Monitor | 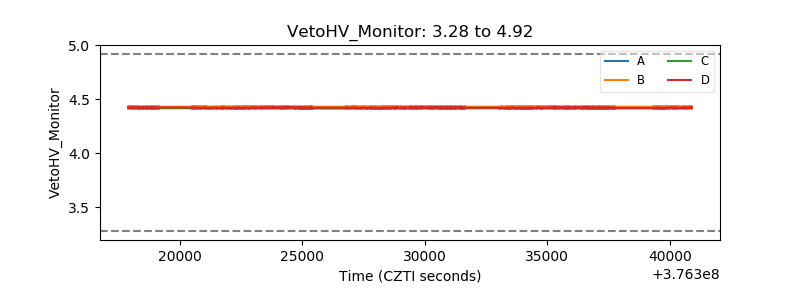 |
| Veto LLD |  |
| Alpha Counter |  |
| _CPM_Rate |  |
| CZT Counter |  |
| +2.5 Volts monitor |  |
| +5 Volts monitor |  |
| _ROLL_ROT |  |
| _Roll_DEC |  |
| _Roll_RA |  |
| Veto Counter |  |