| Param | Original file | Final file |
|---|---|---|
| Filename | modeM0/AS1A11_046T04_9000004792cztM0_level2_bc.evt | modeM0/AS1A11_046T04_9000004792cztM0_level2_quad_clean.evt |
| Size (bytes) | 4,236,465,600 | 1,282,000,320 |
| Size | 3.9 GB | 1.2 GB |
| Events in quadrant A | 19,590,709 | 8,732,633 |
| Events in quadrant B | 28,631,971 | 8,513,482 |
| Events in quadrant C | 20,849,686 | 8,579,133 |
| Events in quadrant D | 54,179,357 | 7,902,872 |
| Mode M0 | |||
|---|---|---|---|
| Quadrant | BADHDUFLAG | Total packets | Discarded packets |
| A | 0 | 154967 | 0 |
| B | 0 | 205904 | 0 |
| C | 0 | 161528 | 0 |
| D | 0 | 276229 | 0 |
| Mode M9 | |||
|---|---|---|---|
| Quadrant | BADHDUFLAG | Total packets | Discarded packets |
| A | 0 | 295 | 0 |
| B | 0 | 295 | 0 |
| C | 0 | 295 | 0 |
| D | 0 | 295 | 0 |
| Mode SS | |||
|---|---|---|---|
| Quadrant | BADHDUFLAG | Total packets | Discarded packets |
| A | 0 | 1522 | 0 |
| B | 0 | 1522 | 0 |
| C | 0 | 1522 | 0 |
| D | 0 | 1522 | 0 |
| Quadrant | Total seconds | Saturated seconds | Saturation percentage |
|---|---|---|---|
| A | 74438 | 79 | 0.106129% |
| B | 74438 | 4974 | 6.682071% |
| C | 74438 | 590 | 0.792606% |
| D | 74438 | 5803 | 7.795749% |
Noise dominated data is calculated using 1-second bins in cleaned event files. If a bin has >2000 counts, and if more than 50% of those come from <1% of pixels, then it is considered to be noise-dominated and hence unusable.
| Quadrant | # 1 sec bins | Bins with >0 counts | Bins with >2000 counts | High rate bins dominated by noise | Noise dominated (total time) | Noise dominated (detector-on time) | Marked lightcurve |
|---|---|---|---|---|---|---|---|
| A | 103923 | 74441 | 0 | 0 | 0.00% | 0.00% |  |
| B | 103923 | 74435 | 195 | 195 | 0.19% | 0.26% |  |
| C | 103923 | 74438 | 126 | 126 | 0.12% | 0.17% |  |
| D | 103923 | 74438 | 2174 | 2174 | 2.09% | 2.92% |  |
Top three noisy pixels from each quadrant. If the there are fewer than three noisy pixels in the level2.evt file, extra rows are filled as -1
| Pixel properties | Quadrant properties | ||||||
|---|---|---|---|---|---|---|---|
| Quadrant | DetID | PixID | Counts | Sigma | Mean | Median | Sigma |
| A | 15 | 47 | 4483799 | 5258.87 | 3859 | 3808 | 851.9 |
| A | 13 | 254 | 129355 | 147.37 | 3859 | 3808 | 851.9 |
| A | 13 | 6 | 125535 | 142.89 | 3859 | 3808 | 851.9 |
| B | 5 | 172 | 8838654 | 11778.68 | 3762 | 3684 | 750.1 |
| B | 5 | 255 | 2657426 | 3537.94 | 3762 | 3684 | 750.1 |
| B | 0 | 213 | 766017 | 1016.33 | 3762 | 3684 | 750.1 |
| C | 15 | 214 | 3050831 | 3612.07 | 3723 | 3697 | 843.6 |
| C | 1 | 23 | 966145 | 1140.89 | 3723 | 3697 | 843.6 |
| C | 0 | 10 | 824801 | 973.34 | 3723 | 3697 | 843.6 |
| D | 8 | 195 | 22121765 | 24831.3 | 3658 | 3548 | 890.7 |
| D | 1 | 52 | 8236366 | 9242.68 | 3658 | 3548 | 890.7 |
| D | 2 | 250 | 2624469 | 2942.41 | 3658 | 3548 | 890.7 |
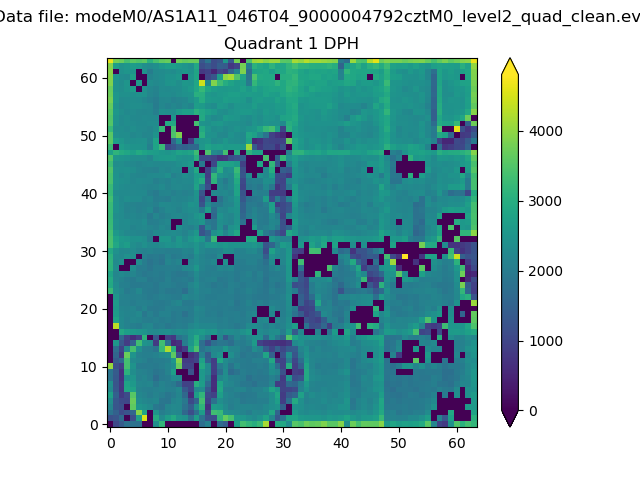
Histogram calculated using DETX and DETY for each event in the final _common_clean file
| Quadrant A |  |
 |
Quadrant B |
|---|---|---|---|
| Quadrant D |  |
 |
Quadrant C |
| Plot type | Count rate plots | Images |
|---|---|---|
| Comparison with Poisson distribution Blue bars denote a histogram of data divided into 1 sec bins. Red curve is a Poisson curve with rate = median count rate of data. |
 |
 |
| Quadrant-wise count rates Data is divided into 100 sec bins |
 |
|
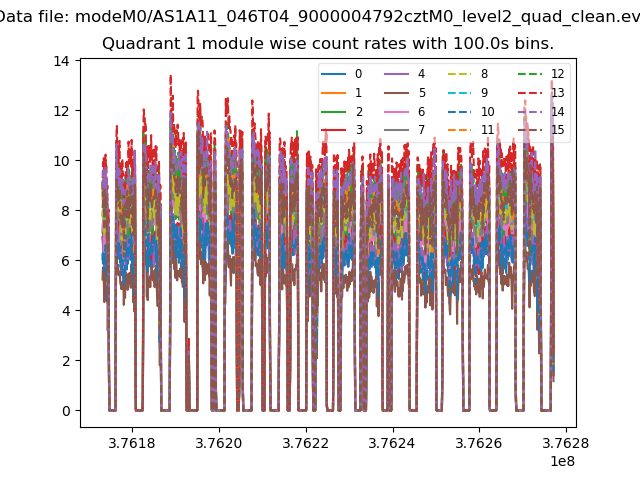
| Module-wise count rates for Quadrant A Data is divided into 100 sec bins |
 |
 |
| Module-wise count rates for Quadrant B Data is divided into 100 sec bins |
 |
 |
| Module-wise count rates for Quadrant C Data is divided into 100 sec bins |
 |
 |
| Module-wise count rates for Quadrant D Data is divided into 100 sec bins |
 |
 |
| Parameter | Plot |
|---|---|
| CZT HV Monitor | 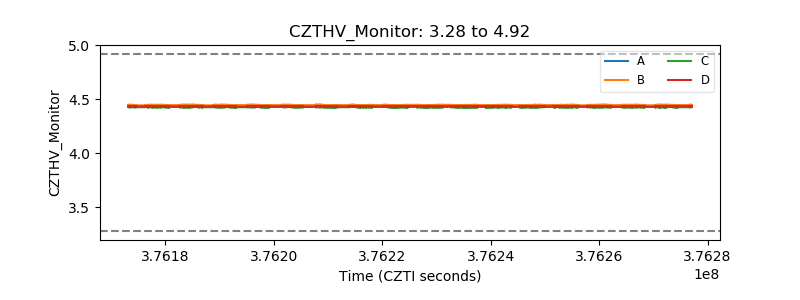 |
| D_VDD |  |
| Temperature 1 |  |
| Veto HV Monitor |  |
| Veto LLD |  |
| Alpha Counter | 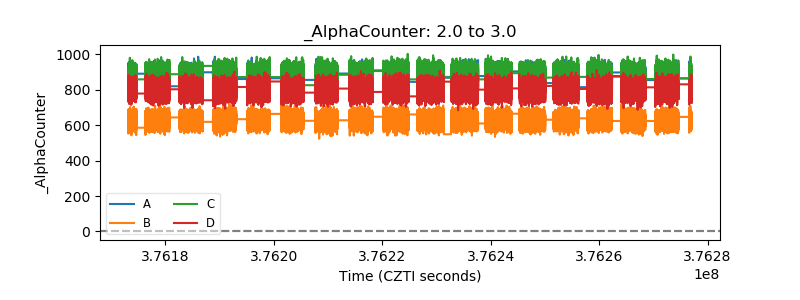 |
| _CPM_Rate |  |
| CZT Counter | 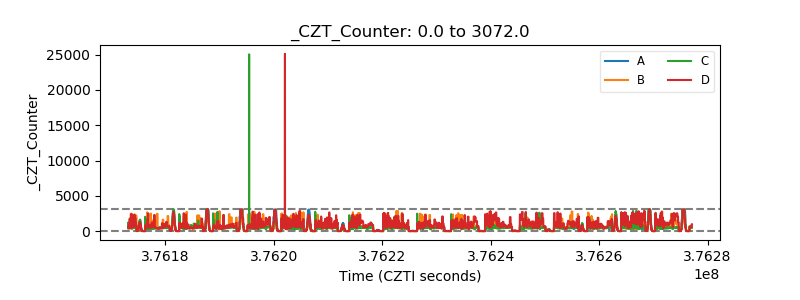 |
| +2.5 Volts monitor |  |
| +5 Volts monitor |  |
| _ROLL_ROT |  |
| _Roll_DEC | 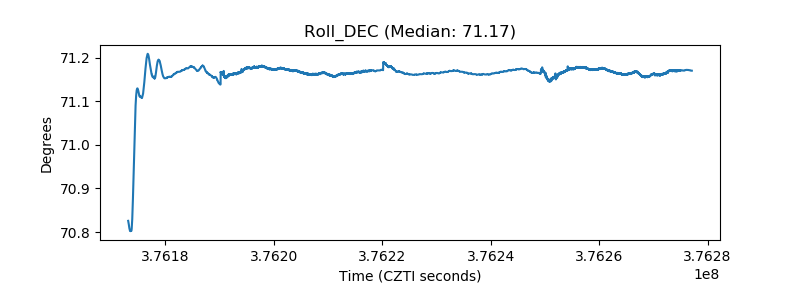 |
| _Roll_RA |  |
| Veto Counter |  |