| Param | Original file | Final file |
|---|---|---|
| Filename | modeM0/AS1C07_001T03_9000004790cztM0_level2_bc.evt | modeM0/AS1C07_001T03_9000004790cztM0_level2_quad_clean.evt |
| Size (bytes) | 4,387,524,480 | 1,294,050,240 |
| Size | 4.1 GB | 1.2 GB |
| Events in quadrant A | 17,660,077 | 8,763,679 |
| Events in quadrant B | 32,772,402 | 8,385,952 |
| Events in quadrant C | 23,609,820 | 8,439,828 |
| Events in quadrant D | 52,972,722 | 7,692,154 |
| Mode SS | |||
|---|---|---|---|
| Quadrant | BADHDUFLAG | Total packets | Discarded packets |
| A | 0 | 1758 | 0 |
| B | 0 | 1758 | 0 |
| C | 0 | 1758 | 0 |
| D | 0 | 1758 | 0 |
| Mode M0 | |||
|---|---|---|---|
| Quadrant | BADHDUFLAG | Total packets | Discarded packets |
| A | 0 | 173746 | 0 |
| B | 0 | 240549 | 0 |
| C | 0 | 185970 | 0 |
| D | 0 | 303477 | 0 |
| Mode M9 | |||
|---|---|---|---|
| Quadrant | BADHDUFLAG | Total packets | Discarded packets |
| A | 0 | 313 | 0 |
| B | 0 | 313 | 0 |
| C | 0 | 313 | 0 |
| D | 0 | 313 | 0 |
| Quadrant | Total seconds | Saturated seconds | Saturation percentage |
|---|---|---|---|
| A | 86270 | 72 | 0.083459% |
| B | 86270 | 6872 | 7.965689% |
| C | 86270 | 860 | 0.996870% |
| D | 86270 | 7206 | 8.352846% |
Noise dominated data is calculated using 1-second bins in cleaned event files. If a bin has >2000 counts, and if more than 50% of those come from <1% of pixels, then it is considered to be noise-dominated and hence unusable.
| Quadrant | # 1 sec bins | Bins with >0 counts | Bins with >2000 counts | High rate bins dominated by noise | Noise dominated (total time) | Noise dominated (detector-on time) | Marked lightcurve |
|---|---|---|---|---|---|---|---|
| A | 117339 | 86276 | 0 | 0 | 0.00% | 0.00% |  |
| B | 117339 | 86270 | 167 | 167 | 0.14% | 0.19% |  |
| C | 117339 | 86273 | 155 | 155 | 0.13% | 0.18% |  |
| D | 117339 | 86270 | 1004 | 1004 | 0.86% | 1.16% |  |
Top three noisy pixels from each quadrant. If the there are fewer than three noisy pixels in the level2.evt file, extra rows are filled as -1
| Pixel properties | Quadrant properties | ||||||
|---|---|---|---|---|---|---|---|
| Quadrant | DetID | PixID | Counts | Sigma | Mean | Median | Sigma |
| A | 15 | 47 | 261366 | 261.97 | 4459 | 4397 | 980.9 |
| A | 13 | 254 | 140022 | 138.26 | 4459 | 4397 | 980.9 |
| A | 13 | 6 | 123300 | 121.22 | 4459 | 4397 | 980.9 |
| B | 5 | 172 | 11282789 | 13185.24 | 4306 | 4208 | 855.4 |
| B | 5 | 255 | 1499671 | 1748.27 | 4306 | 4208 | 855.4 |
| B | 0 | 213 | 796552 | 926.29 | 4306 | 4208 | 855.4 |
| C | 15 | 214 | 3512477 | 3635.43 | 4259 | 4227 | 965.0 |
| C | 0 | 10 | 1282985 | 1325.12 | 4259 | 4227 | 965.0 |
| C | 14 | 254 | 584766 | 601.58 | 4259 | 4227 | 965.0 |
| D | 8 | 195 | 18756417 | 18714.24 | 4131 | 3998 | 1002.0 |
| D | 1 | 52 | 3780092 | 3768.41 | 4131 | 3998 | 1002.0 |
| D | 2 | 250 | 3627692 | 3616.32 | 4131 | 3998 | 1002.0 |
Histogram calculated using DETX and DETY for each event in the final _common_clean file
| Quadrant A |  |
 |
Quadrant B |
|---|---|---|---|
| Quadrant D |  |
 |
Quadrant C |
| Plot type | Count rate plots | Images |
|---|---|---|
| Comparison with Poisson distribution Blue bars denote a histogram of data divided into 1 sec bins. Red curve is a Poisson curve with rate = median count rate of data. |
 |
 |
| Quadrant-wise count rates Data is divided into 100 sec bins |
 |
|
| Module-wise count rates for Quadrant A Data is divided into 100 sec bins |
 |
 |
| Module-wise count rates for Quadrant B Data is divided into 100 sec bins |
 |
 |
| Module-wise count rates for Quadrant C Data is divided into 100 sec bins |
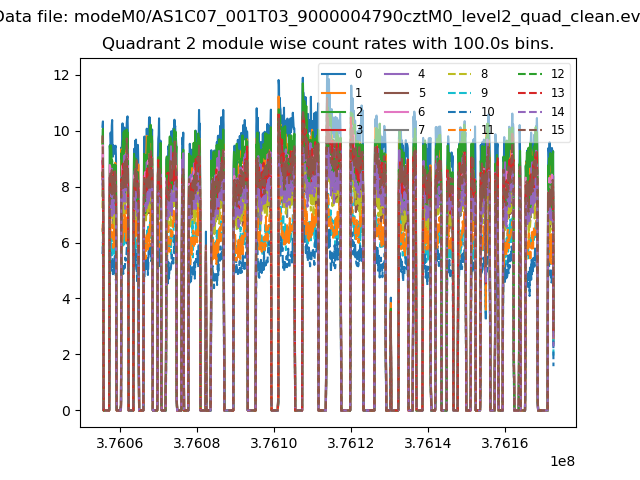 |
 |
| Module-wise count rates for Quadrant D Data is divided into 100 sec bins |
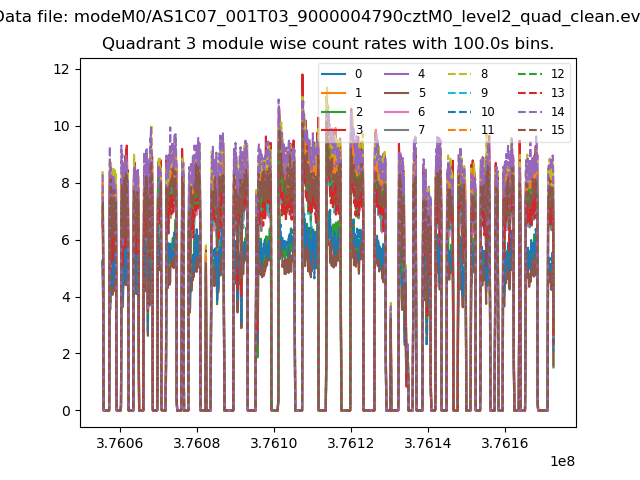 |
 |
| Parameter | Plot |
|---|---|
| CZT HV Monitor |  |
| D_VDD |  |
| Temperature 1 |  |
| Veto HV Monitor |  |
| Veto LLD |  |
| Alpha Counter |  |
| _CPM_Rate |  |
| CZT Counter |  |
| +2.5 Volts monitor |  |
| +5 Volts monitor | 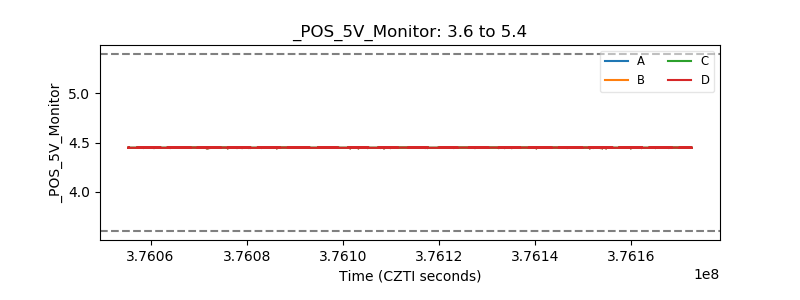 |
| _ROLL_ROT | 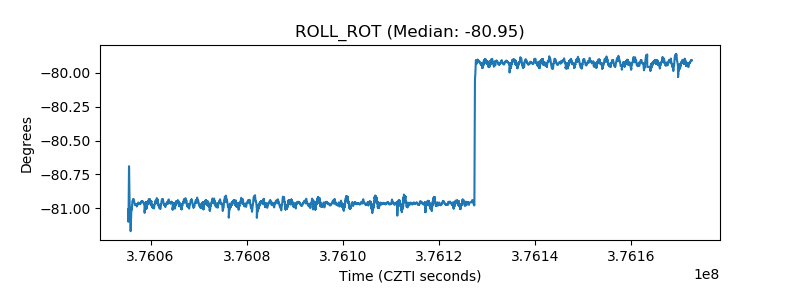 |
| _Roll_DEC | 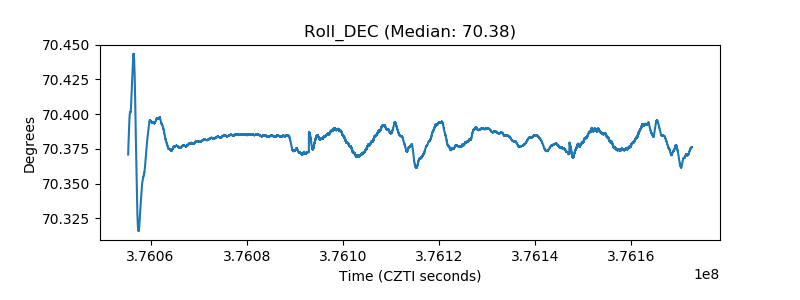 |
| _Roll_RA |  |
| Veto Counter |  |