| Param | Original file | Final file |
|---|---|---|
| Filename | modeM0/AS1A10_064T02_9000004788cztM0_level2_bc.evt | modeM0/AS1A10_064T02_9000004788cztM0_level2_quad_clean.evt |
| Size (bytes) | 6,014,482,560 | 1,489,521,600 |
| Size | 5.6 GB | 1.4 GB |
| Events in quadrant A | 24,309,606 | 9,663,503 |
| Events in quadrant B | 37,379,910 | 9,453,524 |
| Events in quadrant C | 33,818,960 | 9,523,610 |
| Events in quadrant D | 78,887,223 | 8,652,290 |
| Mode M9 | |||
|---|---|---|---|
| Quadrant | BADHDUFLAG | Total packets | Discarded packets |
| A | 0 | 402 | 0 |
| B | 0 | 402 | 0 |
| C | 0 | 401 | 0 |
| D | 0 | 404 | 0 |
| Mode M0 | |||
|---|---|---|---|
| Quadrant | BADHDUFLAG | Total packets | Discarded packets |
| A | 0 | 232512 | 0 |
| B | 0 | 309736 | 0 |
| C | 0 | 255996 | 0 |
| D | 0 | 428566 | 0 |
| Mode SS | |||
|---|---|---|---|
| Quadrant | BADHDUFLAG | Total packets | Discarded packets |
| A | 0 | 2338 | 0 |
| B | 0 | 2338 | 0 |
| C | 0 | 2335 | 0 |
| D | 0 | 2338 | 0 |
| Quadrant | Total seconds | Saturated seconds | Saturation percentage |
|---|---|---|---|
| A | 114190 | 118 | 0.103337% |
| B | 114174 | 10295 | 9.016939% |
| C | 114158 | 1399 | 1.225494% |
| D | 113933 | 10958 | 9.617933% |
Noise dominated data is calculated using 1-second bins in cleaned event files. If a bin has >2000 counts, and if more than 50% of those come from <1% of pixels, then it is considered to be noise-dominated and hence unusable.
| Quadrant | # 1 sec bins | Bins with >0 counts | Bins with >2000 counts | High rate bins dominated by noise | Noise dominated (total time) | Noise dominated (detector-on time) | Marked lightcurve |
|---|---|---|---|---|---|---|---|
| A | 169060 | 114547 | 10 | 10 | 0.01% | 0.01% | 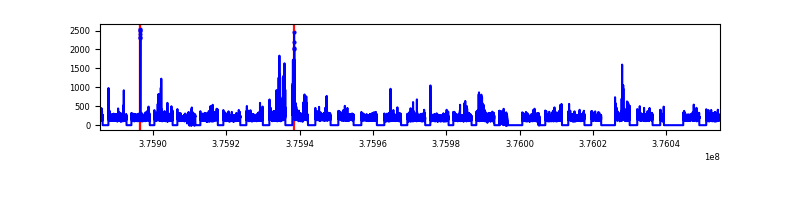 |
| B | 169060 | 113403 | 189 | 189 | 0.11% | 0.17% |  |
| C | 169060 | 114498 | 260 | 260 | 0.15% | 0.23% | 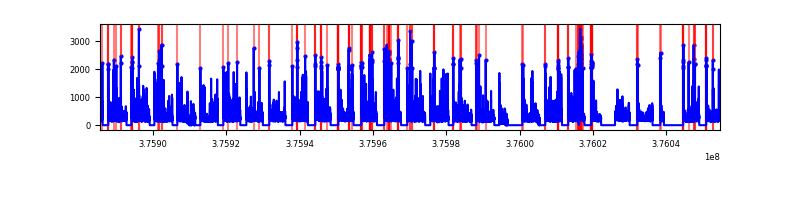 |
| D | 169059 | 114256 | 2024 | 2024 | 1.20% | 1.77% | 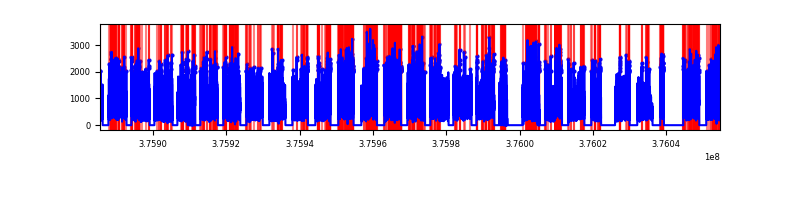 |
Top three noisy pixels from each quadrant. If the there are fewer than three noisy pixels in the level2.evt file, extra rows are filled as -1
| Pixel properties | Quadrant properties | ||||||
|---|---|---|---|---|---|---|---|
| Quadrant | DetID | PixID | Counts | Sigma | Mean | Median | Sigma |
| A | 12 | 16 | 488086 | 367.33 | 6026 | 5942 | 1312.6 |
| A | 15 | 169 | 206982 | 153.17 | 6026 | 5942 | 1312.6 |
| A | 13 | 254 | 169808 | 124.84 | 6026 | 5942 | 1312.6 |
| B | 5 | 172 | 7038386 | 6258.7 | 5715 | 5592 | 1123.7 |
| B | 0 | 219 | 3267381 | 2902.76 | 5715 | 5592 | 1123.7 |
| B | 5 | 255 | 1084378 | 960.04 | 5715 | 5592 | 1123.7 |
| C | 15 | 214 | 4639222 | 3545.44 | 5846 | 5818 | 1306.9 |
| C | 0 | 10 | 2064991 | 1575.66 | 5846 | 5818 | 1306.9 |
| C | 1 | 23 | 1375356 | 1047.96 | 5846 | 5818 | 1306.9 |
| D | 8 | 195 | 25163303 | 18107.15 | 5676 | 5482 | 1389.4 |
| D | 1 | 52 | 8521131 | 6129.07 | 5676 | 5482 | 1389.4 |
| D | 2 | 250 | 6887029 | 4952.94 | 5676 | 5482 | 1389.4 |
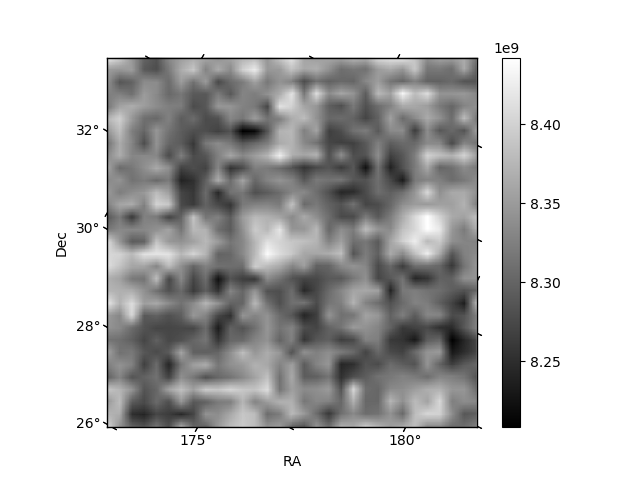
Histogram calculated using DETX and DETY for each event in the final _common_clean file
| Quadrant A |  |
 |
Quadrant B |
|---|---|---|---|
| Quadrant D |  |
 |
Quadrant C |
| Plot type | Count rate plots | Images |
|---|---|---|
| Comparison with Poisson distribution Blue bars denote a histogram of data divided into 1 sec bins. Red curve is a Poisson curve with rate = median count rate of data. |
 |
 |
| Quadrant-wise count rates Data is divided into 100 sec bins |
 |
|
| Module-wise count rates for Quadrant A Data is divided into 100 sec bins |
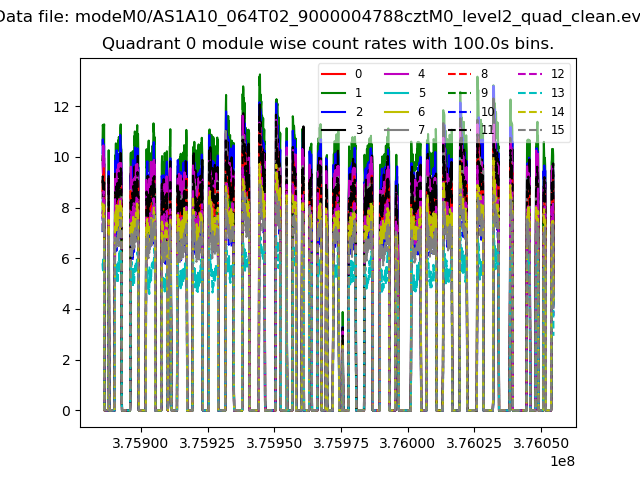 |
 |
| Module-wise count rates for Quadrant B Data is divided into 100 sec bins |
 |
 |
| Module-wise count rates for Quadrant C Data is divided into 100 sec bins |
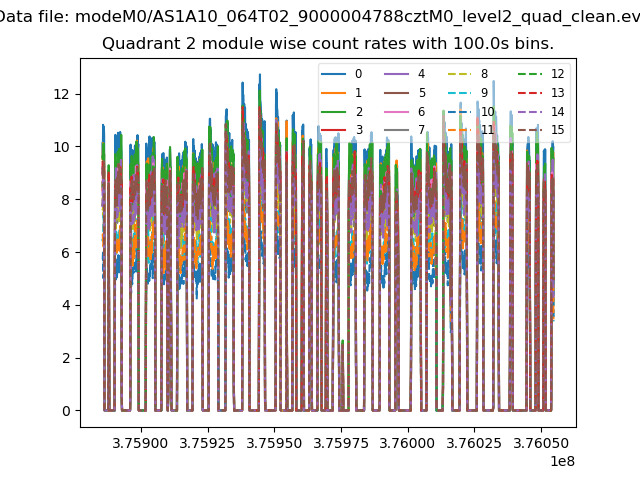 |
 |
| Module-wise count rates for Quadrant D Data is divided into 100 sec bins |
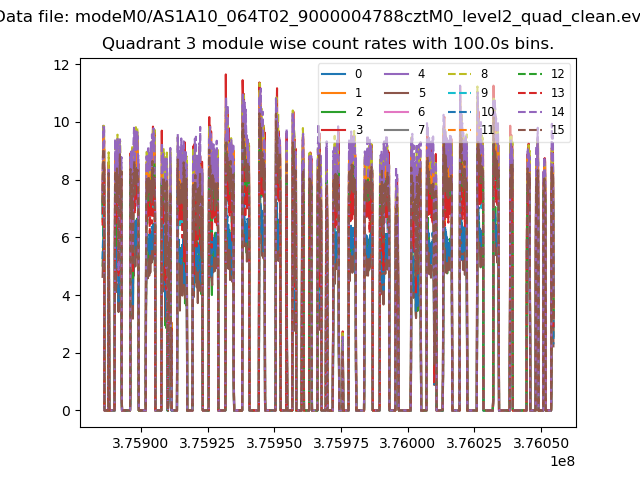 |
 |
| Parameter | Plot |
|---|---|
| CZT HV Monitor |  |
| D_VDD | 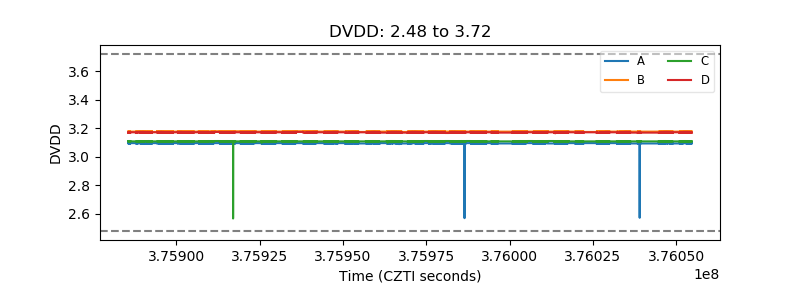 |
| Temperature 1 |  |
| Veto HV Monitor |  |
| Veto LLD | 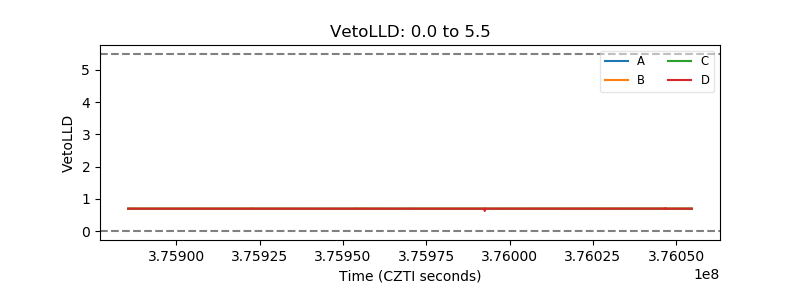 |
| Alpha Counter |  |
| _CPM_Rate |  |
| CZT Counter |  |
| +2.5 Volts monitor |  |
| +5 Volts monitor | 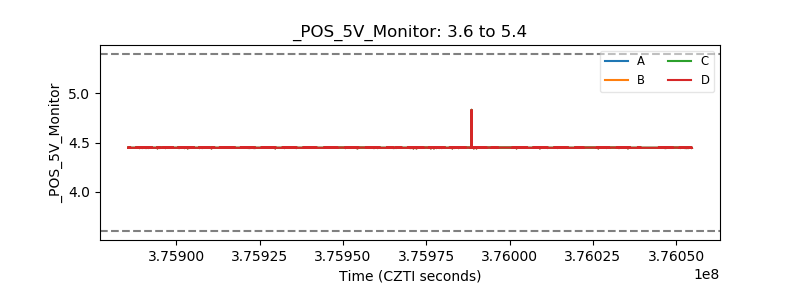 |
| _ROLL_ROT |  |
| _Roll_DEC |  |
| _Roll_RA |  |
| Veto Counter |  |