| Param | Original file | Final file |
|---|---|---|
| Filename | modeM0/AS1A10_090T11_9000004784cztM0_level2_bc.evt | modeM0/AS1A10_090T11_9000004784cztM0_level2_quad_clean.evt |
| Size (bytes) | 1,946,021,760 | 449,412,480 |
| Size | 1.8 GB | 428.6 MB |
| Events in quadrant A | 6,711,260 | 3,099,174 |
| Events in quadrant B | 11,805,138 | 2,981,835 |
| Events in quadrant C | 15,913,885 | 2,843,153 |
| Events in quadrant D | 22,617,655 | 2,775,730 |
| Mode M0 | |||
|---|---|---|---|
| Quadrant | BADHDUFLAG | Total packets | Discarded packets |
| A | 0 | 58966 | 0 |
| B | 0 | 83371 | 0 |
| C | 0 | 94535 | 0 |
| D | 0 | 116197 | 0 |
| Mode M9 | |||
|---|---|---|---|
| Quadrant | BADHDUFLAG | Total packets | Discarded packets |
| A | 0 | 122 | 0 |
| B | 0 | 122 | 0 |
| C | 0 | 122 | 0 |
| D | 0 | 123 | 0 |
| Mode SS | |||
|---|---|---|---|
| Quadrant | BADHDUFLAG | Total packets | Discarded packets |
| A | 0 | 566 | 0 |
| B | 0 | 566 | 0 |
| C | 0 | 566 | 0 |
| D | 0 | 566 | 0 |
| Quadrant | Total seconds | Saturated seconds | Saturation percentage |
|---|---|---|---|
| A | 27794 | 73 | 0.262647% |
| B | 27794 | 2293 | 8.249982% |
| C | 27794 | 3115 | 11.207455% |
| D | 27794 | 2764 | 9.944592% |
Noise dominated data is calculated using 1-second bins in cleaned event files. If a bin has >2000 counts, and if more than 50% of those come from <1% of pixels, then it is considered to be noise-dominated and hence unusable.
| Quadrant | # 1 sec bins | Bins with >0 counts | Bins with >2000 counts | High rate bins dominated by noise | Noise dominated (total time) | Noise dominated (detector-on time) | Marked lightcurve |
|---|---|---|---|---|---|---|---|
| A | 39662 | 27795 | 7 | 7 | 0.02% | 0.03% | 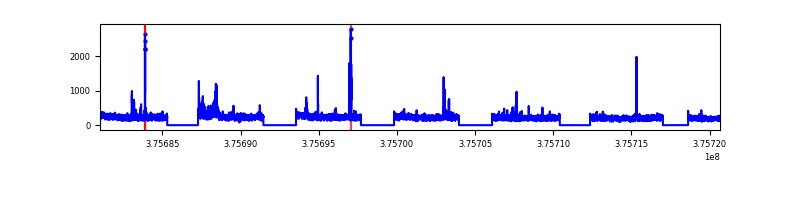 |
| B | 39661 | 27793 | 235 | 235 | 0.59% | 0.85% |  |
| C | 39661 | 27793 | 940 | 940 | 2.37% | 3.38% |  |
| D | 39661 | 27793 | 489 | 489 | 1.23% | 1.76% | 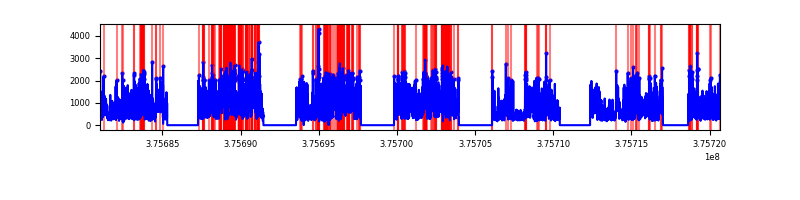 |
Top three noisy pixels from each quadrant. If the there are fewer than three noisy pixels in the level2.evt file, extra rows are filled as -1
| Pixel properties | Quadrant properties | ||||||
|---|---|---|---|---|---|---|---|
| Quadrant | DetID | PixID | Counts | Sigma | Mean | Median | Sigma |
| A | 0 | 254 | 217150 | 602.81 | 1645 | 1626 | 357.5 |
| A | 13 | 254 | 43399 | 116.84 | 1645 | 1626 | 357.5 |
| A | 13 | 6 | 42755 | 115.04 | 1645 | 1626 | 357.5 |
| B | 5 | 172 | 2194469 | 7036.55 | 1601 | 1574 | 311.6 |
| B | 0 | 219 | 2056519 | 6593.9 | 1601 | 1574 | 311.6 |
| B | 4 | 170 | 519670 | 1662.46 | 1601 | 1574 | 311.6 |
| C | 1 | 23 | 5477544 | 16292.73 | 1502 | 1504 | 336.1 |
| C | 10 | 49 | 2442599 | 7262.93 | 1502 | 1504 | 336.1 |
| C | 15 | 214 | 1169626 | 3475.48 | 1502 | 1504 | 336.1 |
| D | 8 | 195 | 9631991 | 24056.7 | 1535 | 1505 | 400.3 |
| D | 2 | 250 | 1450725 | 3620.11 | 1535 | 1505 | 400.3 |
| D | 1 | 52 | 1377857 | 3438.09 | 1535 | 1505 | 400.3 |
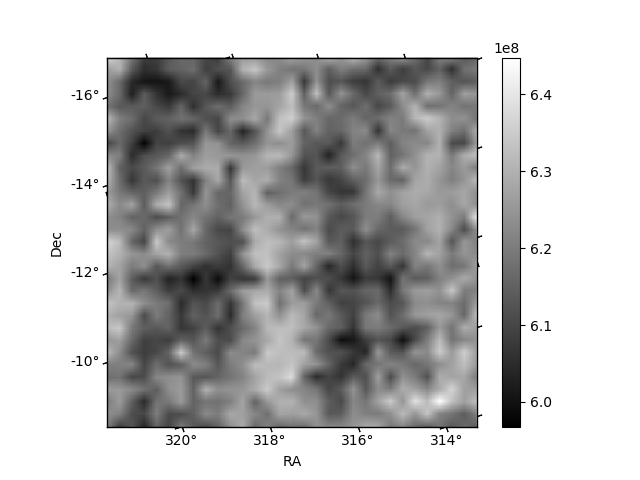
Histogram calculated using DETX and DETY for each event in the final _common_clean file
| Quadrant A |  |
 |
Quadrant B |
|---|---|---|---|
| Quadrant D | 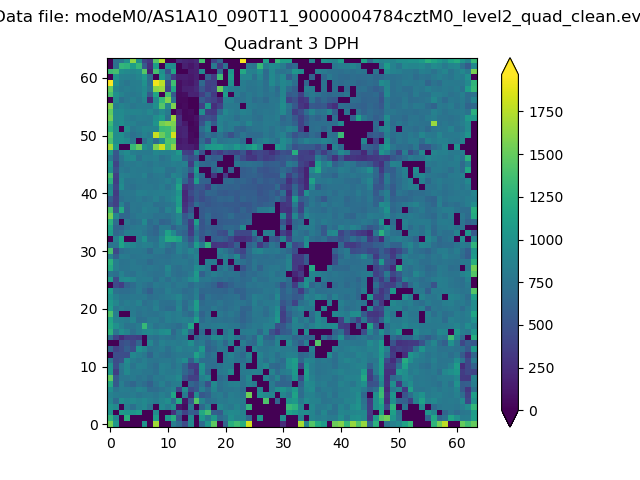 |
 |
Quadrant C |
| Plot type | Count rate plots | Images |
|---|---|---|
| Comparison with Poisson distribution Blue bars denote a histogram of data divided into 1 sec bins. Red curve is a Poisson curve with rate = median count rate of data. |
 |
 |
| Quadrant-wise count rates Data is divided into 100 sec bins |
 |
|
| Module-wise count rates for Quadrant A Data is divided into 100 sec bins |
 |
 |
| Module-wise count rates for Quadrant B Data is divided into 100 sec bins |
 |
 |
| Module-wise count rates for Quadrant C Data is divided into 100 sec bins |
 |
 |
| Module-wise count rates for Quadrant D Data is divided into 100 sec bins |
 |
 |
| Parameter | Plot |
|---|---|
| CZT HV Monitor |  |
| D_VDD |  |
| Temperature 1 | 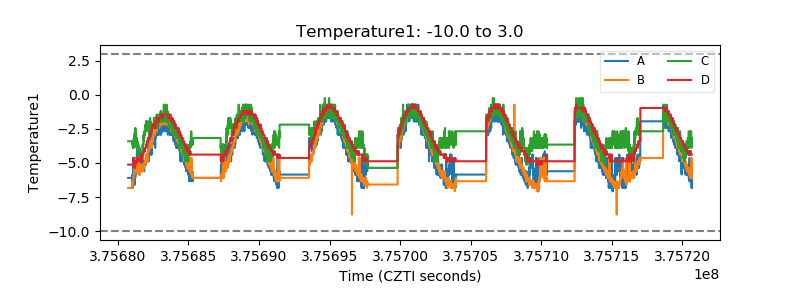 |
| Veto HV Monitor |  |
| Veto LLD |  |
| Alpha Counter |  |
| _CPM_Rate |  |
| CZT Counter |  |
| +2.5 Volts monitor |  |
| +5 Volts monitor | 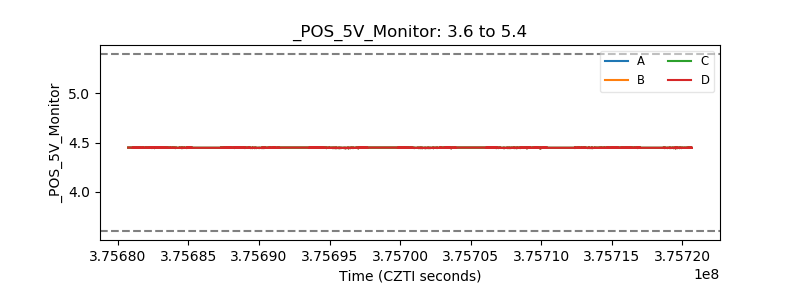 |
| _ROLL_ROT | 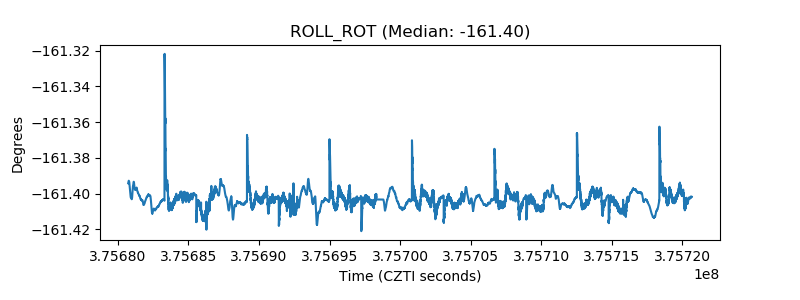 |
| _Roll_DEC |  |
| _Roll_RA |  |
| Veto Counter |  |