| Param | Original file | Final file |
|---|---|---|
| Filename | modeM0/AS1A10_058T15_9000004786cztM0_level2_bc.evt | modeM0/AS1A10_058T15_9000004786cztM0_level2_quad_clean.evt |
| Size (bytes) | 7,107,514,560 | 1,489,161,600 |
| Size | 6.6 GB | 1.4 GB |
| Events in quadrant A | 31,342,285 | 9,679,497 |
| Events in quadrant B | 44,119,488 | 9,397,683 |
| Events in quadrant C | 42,673,437 | 9,536,659 |
| Events in quadrant D | 89,368,289 | 8,653,266 |
| Mode M0 | |||
|---|---|---|---|
| Quadrant | BADHDUFLAG | Total packets | Discarded packets |
| A | 0 | 260110 | 0 |
| B | 0 | 323573 | 0 |
| C | 0 | 289492 | 0 |
| D | 0 | 471440 | 0 |
| Mode M9 | |||
|---|---|---|---|
| Quadrant | BADHDUFLAG | Total packets | Discarded packets |
| A | 0 | 437 | 0 |
| B | 0 | 437 | 0 |
| C | 0 | 437 | 0 |
| D | 0 | 438 | 0 |
| Mode SS | |||
|---|---|---|---|
| Quadrant | BADHDUFLAG | Total packets | Discarded packets |
| A | 0 | 2344 | 0 |
| B | 0 | 2342 | 0 |
| C | 0 | 2344 | 0 |
| D | 0 | 2340 | 0 |
| Quadrant | Total seconds | Saturated seconds | Saturation percentage |
|---|---|---|---|
| A | 114347 | 921 | 0.805443% |
| B | 114332 | 7398 | 6.470629% |
| C | 114262 | 3388 | 2.965115% |
| D | 114192 | 15126 | 13.246112% |
Noise dominated data is calculated using 1-second bins in cleaned event files. If a bin has >2000 counts, and if more than 50% of those come from <1% of pixels, then it is considered to be noise-dominated and hence unusable.
| Quadrant | # 1 sec bins | Bins with >0 counts | Bins with >2000 counts | High rate bins dominated by noise | Noise dominated (total time) | Noise dominated (detector-on time) | Marked lightcurve |
|---|---|---|---|---|---|---|---|
| A | 162858 | 114491 | 51 | 51 | 0.03% | 0.04% |  |
| B | 162858 | 114470 | 388 | 388 | 0.24% | 0.34% |  |
| C | 162858 | 114404 | 1321 | 1321 | 0.81% | 1.15% |  |
| D | 162858 | 114345 | 2800 | 2800 | 1.72% | 2.45% |  |
Top three noisy pixels from each quadrant. If the there are fewer than three noisy pixels in the level2.evt file, extra rows are filled as -1
| Pixel properties | Quadrant properties | ||||||
|---|---|---|---|---|---|---|---|
| Quadrant | DetID | PixID | Counts | Sigma | Mean | Median | Sigma |
| A | 15 | 169 | 6585384 | 4842.67 | 6279 | 6201 | 1358.6 |
| A | 13 | 254 | 157454 | 111.33 | 6279 | 6201 | 1358.6 |
| A | 12 | 16 | 134788 | 94.65 | 6279 | 6201 | 1358.6 |
| B | 5 | 172 | 8120164 | 6693.3 | 6200 | 6090 | 1212.3 |
| B | 0 | 219 | 5204175 | 4287.9 | 6200 | 6090 | 1212.3 |
| B | 5 | 200 | 1227337 | 1007.41 | 6200 | 6090 | 1212.3 |
| C | 1 | 23 | 7401984 | 5476.83 | 6062 | 6040 | 1350.4 |
| C | 15 | 214 | 4667557 | 3451.94 | 6062 | 6040 | 1350.4 |
| C | 15 | 208 | 2434743 | 1798.5 | 6062 | 6040 | 1350.4 |
| D | 8 | 195 | 27379478 | 18098.6 | 5819 | 5703 | 1512.5 |
| D | 1 | 52 | 12280559 | 8115.71 | 5819 | 5703 | 1512.5 |
| D | 2 | 250 | 7450926 | 4922.53 | 5819 | 5703 | 1512.5 |
Histogram calculated using DETX and DETY for each event in the final _common_clean file
| Quadrant A |  |
 |
Quadrant B |
|---|---|---|---|
| Quadrant D | 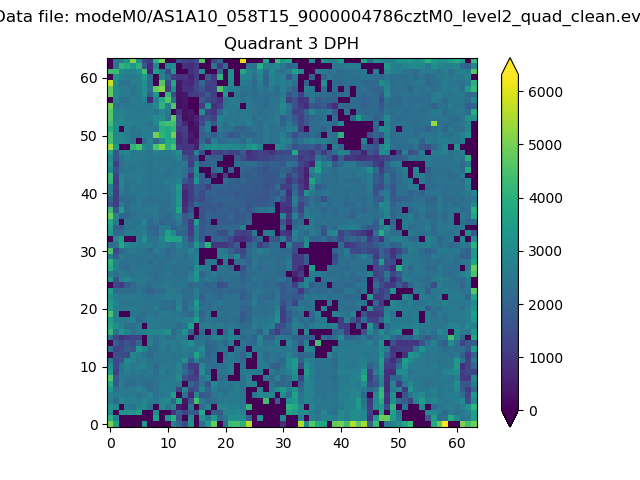 |
 |
Quadrant C |
| Plot type | Count rate plots | Images |
|---|---|---|
| Comparison with Poisson distribution Blue bars denote a histogram of data divided into 1 sec bins. Red curve is a Poisson curve with rate = median count rate of data. |
 |
 |
| Quadrant-wise count rates Data is divided into 100 sec bins |
 |
|
| Module-wise count rates for Quadrant A Data is divided into 100 sec bins |
 |
 |
| Module-wise count rates for Quadrant B Data is divided into 100 sec bins |
 |
 |
| Module-wise count rates for Quadrant C Data is divided into 100 sec bins |
 |
 |
| Module-wise count rates for Quadrant D Data is divided into 100 sec bins |
 |
 |
| Parameter | Plot |
|---|---|
| CZT HV Monitor |  |
| D_VDD |  |
| Temperature 1 |  |
| Veto HV Monitor |  |
| Veto LLD |  |
| Alpha Counter |  |
| _CPM_Rate |  |
| CZT Counter |  |
| +2.5 Volts monitor | 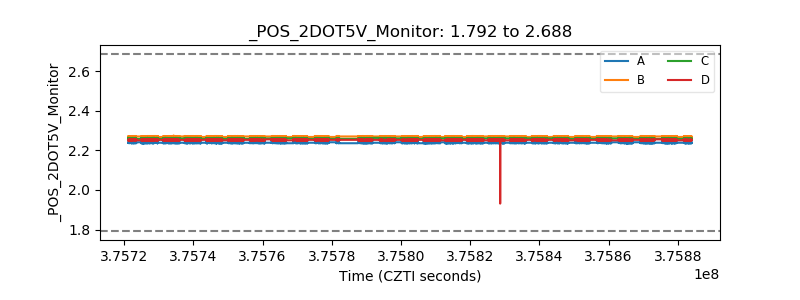 |
| +5 Volts monitor |  |
| _ROLL_ROT | 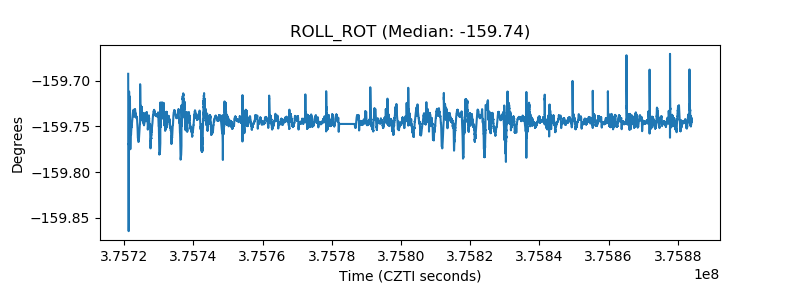 |
| _Roll_DEC |  |
| _Roll_RA |  |
| Veto Counter |  |