| Param | Original file | Final file |
|---|---|---|
| Filename | modeM0/AS1T04_071T01_9000004782cztM0_level2_bc.evt | modeM0/AS1T04_071T01_9000004782cztM0_level2_quad_clean.evt |
| Size (bytes) | 4,838,641,920 | 1,046,612,160 |
| Size | 4.5 GB | 998.1 MB |
| Events in quadrant A | 21,676,197 | 6,919,601 |
| Events in quadrant B | 34,006,638 | 6,417,656 |
| Events in quadrant C | 38,780,927 | 6,514,700 |
| Events in quadrant D | 46,639,436 | 6,352,223 |
| Mode M0 | |||
|---|---|---|---|
| Quadrant | BADHDUFLAG | Total packets | Discarded packets |
| A | 0 | 182459 | 0 |
| B | 0 | 241824 | 0 |
| C | 0 | 242232 | 0 |
| D | 0 | 264150 | 0 |
| Mode SS | |||
|---|---|---|---|
| Quadrant | BADHDUFLAG | Total packets | Discarded packets |
| A | 0 | 1646 | 0 |
| B | 0 | 1640 | 0 |
| C | 0 | 1640 | 0 |
| D | 0 | 1634 | 0 |
| Mode M9 | |||
|---|---|---|---|
| Quadrant | BADHDUFLAG | Total packets | Discarded packets |
| A | 0 | 279 | 0 |
| B | 0 | 281 | 0 |
| C | 0 | 277 | 0 |
| D | 0 | 276 | 0 |
| Quadrant | Total seconds | Saturated seconds | Saturation percentage |
|---|---|---|---|
| A | 80264 | 1434 | 1.786604% |
| B | 80092 | 9649 | 12.047395% |
| C | 79996 | 4145 | 5.181509% |
| D | 80006 | 2951 | 3.688473% |
Noise dominated data is calculated using 1-second bins in cleaned event files. If a bin has >2000 counts, and if more than 50% of those come from <1% of pixels, then it is considered to be noise-dominated and hence unusable.
| Quadrant | # 1 sec bins | Bins with >0 counts | Bins with >2000 counts | High rate bins dominated by noise | Noise dominated (total time) | Noise dominated (detector-on time) | Marked lightcurve |
|---|---|---|---|---|---|---|---|
| A | 109939 | 80612 | 31 | 31 | 0.03% | 0.04% |  |
| B | 109939 | 80439 | 862 | 862 | 0.78% | 1.07% |  |
| C | 109939 | 80357 | 966 | 966 | 0.88% | 1.20% |  |
| D | 109939 | 80407 | 361 | 361 | 0.33% | 0.45% |  |
Top three noisy pixels from each quadrant. If the there are fewer than three noisy pixels in the level2.evt file, extra rows are filled as -1
| Pixel properties | Quadrant properties | ||||||
|---|---|---|---|---|---|---|---|
| Quadrant | DetID | PixID | Counts | Sigma | Mean | Median | Sigma |
| A | 15 | 169 | 4370139 | 4655.03 | 4305 | 4252 | 937.9 |
| A | 0 | 254 | 303530 | 319.1 | 4305 | 4252 | 937.9 |
| A | 12 | 16 | 156509 | 162.34 | 4305 | 4252 | 937.9 |
| B | 5 | 172 | 8926515 | 10946.36 | 4110 | 4025 | 815.1 |
| B | 0 | 219 | 6570528 | 8055.97 | 4110 | 4025 | 815.1 |
| B | 5 | 200 | 1348437 | 1649.36 | 4110 | 4025 | 815.1 |
| C | 10 | 49 | 7876112 | 8554.38 | 4058 | 4044 | 920.2 |
| C | 1 | 23 | 7344692 | 7976.9 | 4058 | 4044 | 920.2 |
| C | 15 | 214 | 3454167 | 3749.16 | 4058 | 4044 | 920.2 |
| D | 8 | 195 | 20640510 | 18853.8 | 4113 | 4014 | 1094.6 |
| D | 2 | 250 | 2301556 | 2099.07 | 4113 | 4014 | 1094.6 |
| D | 12 | 6 | 1669200 | 1521.34 | 4113 | 4014 | 1094.6 |
Histogram calculated using DETX and DETY for each event in the final _common_clean file
| Quadrant A |  |
 |
Quadrant B |
|---|---|---|---|
| Quadrant D |  |
 |
Quadrant C |
| Plot type | Count rate plots | Images |
|---|---|---|
| Comparison with Poisson distribution Blue bars denote a histogram of data divided into 1 sec bins. Red curve is a Poisson curve with rate = median count rate of data. |
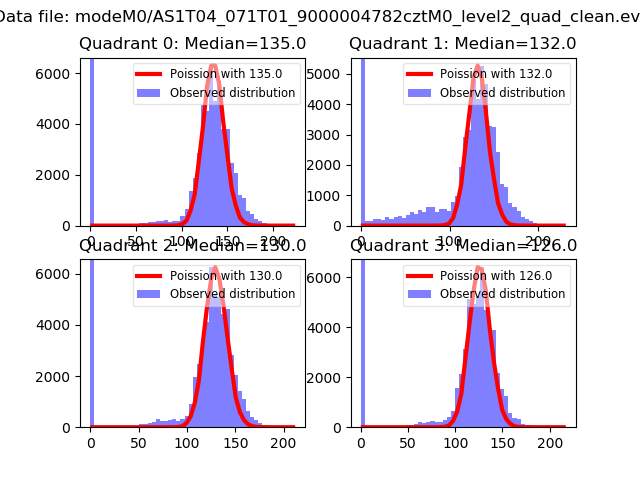 |
 |
| Quadrant-wise count rates Data is divided into 100 sec bins |
 |
|
| Module-wise count rates for Quadrant A Data is divided into 100 sec bins |
 |
 |
| Module-wise count rates for Quadrant B Data is divided into 100 sec bins |
 |
 |
| Module-wise count rates for Quadrant C Data is divided into 100 sec bins |
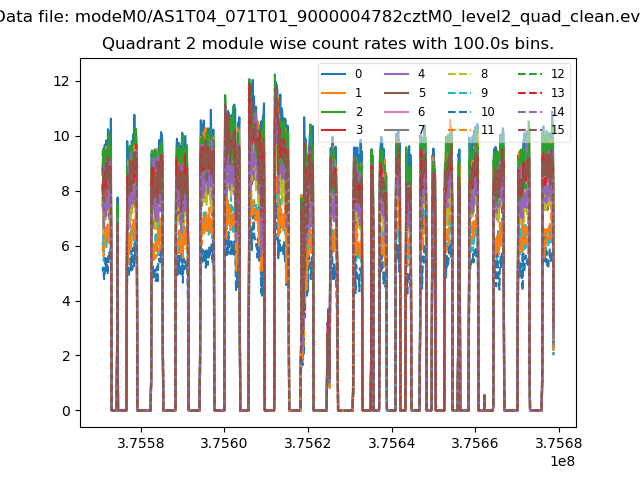 |
 |
| Module-wise count rates for Quadrant D Data is divided into 100 sec bins |
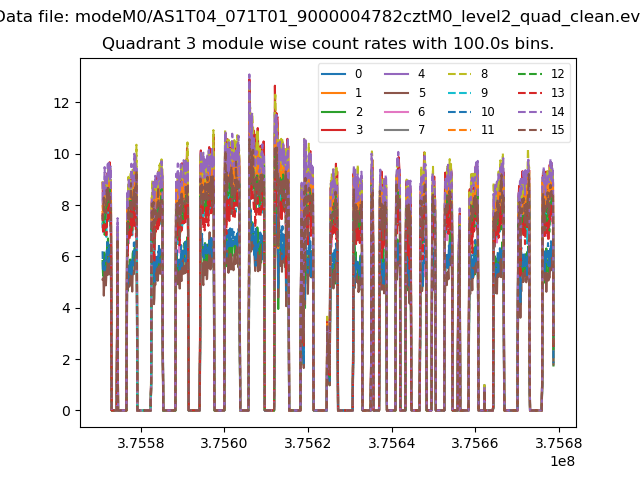 |
 |
| Parameter | Plot |
|---|---|
| CZT HV Monitor | 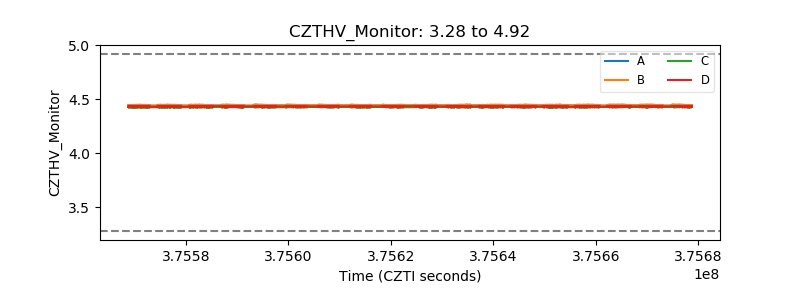 |
| D_VDD | 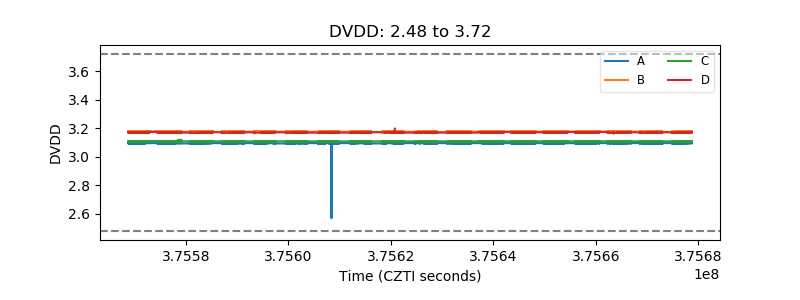 |
| Temperature 1 |  |
| Veto HV Monitor |  |
| Veto LLD |  |
| Alpha Counter |  |
| _CPM_Rate | 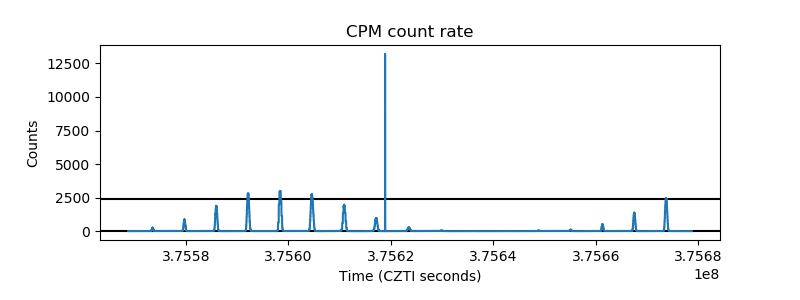 |
| CZT Counter | 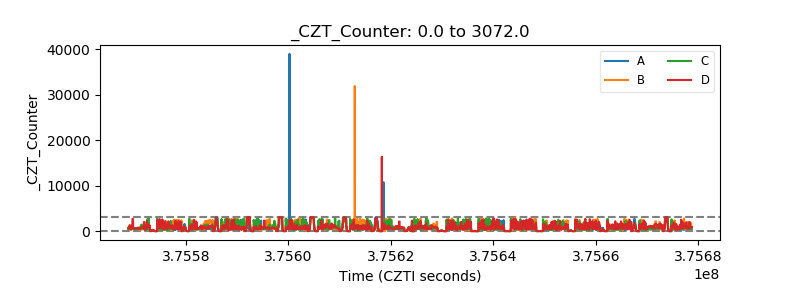 |
| +2.5 Volts monitor | 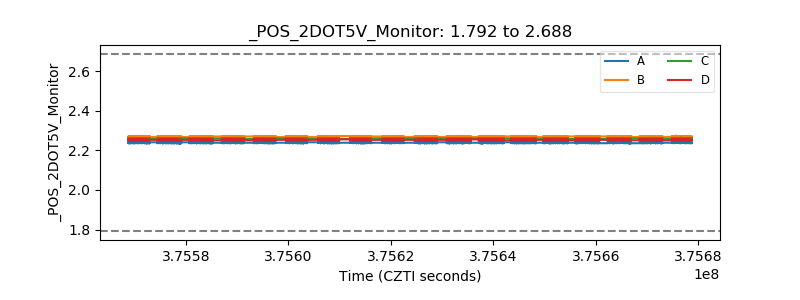 |
| +5 Volts monitor | 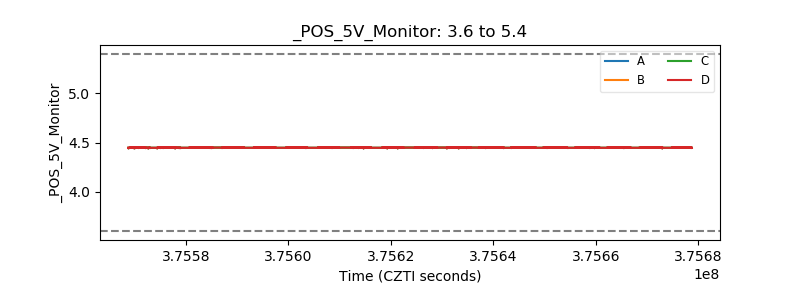 |
| _ROLL_ROT |  |
| _Roll_DEC |  |
| _Roll_RA | 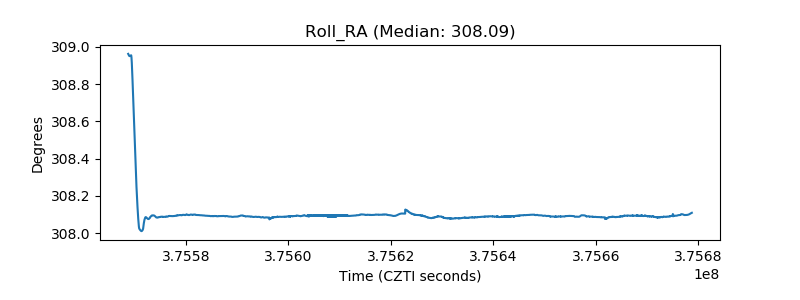 |
| Veto Counter | 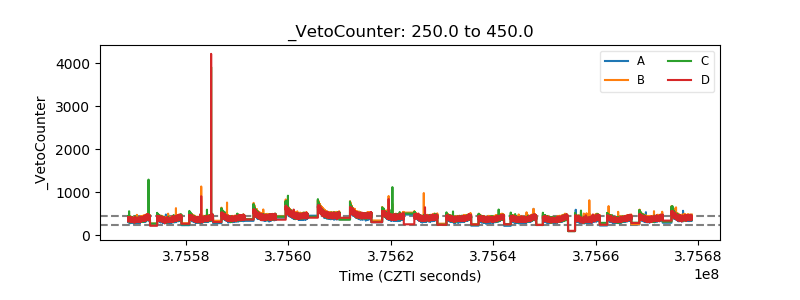 |