| Param | Original file | Final file |
|---|---|---|
| Filename | modeM0/AS1A11_047T10_9000004778cztM0_level2_bc.evt | modeM0/AS1A11_047T10_9000004778cztM0_level2_quad_clean.evt |
| Size (bytes) | 4,975,485,120 | 1,233,555,840 |
| Size | 4.6 GB | 1.1 GB |
| Events in quadrant A | 30,923,179 | 7,824,612 |
| Events in quadrant B | 34,830,885 | 7,916,139 |
| Events in quadrant C | 23,618,894 | 7,946,404 |
| Events in quadrant D | 55,189,346 | 7,498,106 |
| Mode M0 | |||
|---|---|---|---|
| Quadrant | BADHDUFLAG | Total packets | Discarded packets |
| A | 0 | 245278 | 0 |
| B | 0 | 256107 | 0 |
| C | 0 | 196321 | 0 |
| D | 0 | 308629 | 0 |
| Mode SS | |||
|---|---|---|---|
| Quadrant | BADHDUFLAG | Total packets | Discarded packets |
| A | 0 | 1840 | 0 |
| B | 0 | 1842 | 0 |
| C | 0 | 1842 | 0 |
| D | 0 | 1844 | 0 |
| Mode M9 | |||
|---|---|---|---|
| Quadrant | BADHDUFLAG | Total packets | Discarded packets |
| A | 0 | 329 | 0 |
| B | 0 | 329 | 0 |
| C | 0 | 329 | 0 |
| D | 0 | 330 | 0 |
| Quadrant | Total seconds | Saturated seconds | Saturation percentage |
|---|---|---|---|
| A | 90112 | 7451 | 8.268599% |
| B | 90107 | 7541 | 8.368939% |
| C | 90106 | 746 | 0.827914% |
| D | 90092 | 5478 | 6.080451% |
Noise dominated data is calculated using 1-second bins in cleaned event files. If a bin has >2000 counts, and if more than 50% of those come from <1% of pixels, then it is considered to be noise-dominated and hence unusable.
| Quadrant | # 1 sec bins | Bins with >0 counts | Bins with >2000 counts | High rate bins dominated by noise | Noise dominated (total time) | Noise dominated (detector-on time) | Marked lightcurve |
|---|---|---|---|---|---|---|---|
| A | 123321 | 90142 | 201 | 201 | 0.16% | 0.22% |  |
| B | 123321 | 90125 | 357 | 357 | 0.29% | 0.40% |  |
| C | 123321 | 90138 | 82 | 82 | 0.07% | 0.09% | 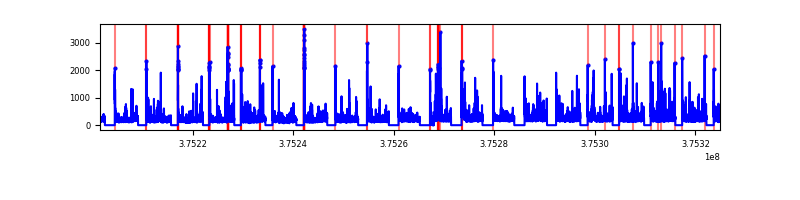 |
| D | 123321 | 90120 | 692 | 692 | 0.56% | 0.77% |  |
Top three noisy pixels from each quadrant. If the there are fewer than three noisy pixels in the level2.evt file, extra rows are filled as -1
| Pixel properties | Quadrant properties | ||||||
|---|---|---|---|---|---|---|---|
| Quadrant | DetID | PixID | Counts | Sigma | Mean | Median | Sigma |
| A | 15 | 169 | 12652719 | 12313.14 | 4643 | 4580 | 1027.2 |
| A | 13 | 6 | 162687 | 153.92 | 4643 | 4580 | 1027.2 |
| A | 13 | 254 | 147452 | 139.09 | 4643 | 4580 | 1027.2 |
| B | 5 | 172 | 11549545 | 12762.65 | 4563 | 4467 | 904.6 |
| B | 0 | 219 | 2007953 | 2214.78 | 4563 | 4467 | 904.6 |
| B | 5 | 200 | 1096008 | 1206.66 | 4563 | 4467 | 904.6 |
| C | 15 | 214 | 1458195 | 1394.54 | 4590 | 4560 | 1042.4 |
| C | 10 | 49 | 1443519 | 1380.46 | 4590 | 4560 | 1042.4 |
| C | 0 | 10 | 1215313 | 1161.53 | 4590 | 4560 | 1042.4 |
| D | 8 | 195 | 21934822 | 17974.11 | 4539 | 4435 | 1220.1 |
| D | 12 | 218 | 3375306 | 2762.76 | 4539 | 4435 | 1220.1 |
| D | 2 | 250 | 3214643 | 2631.08 | 4539 | 4435 | 1220.1 |
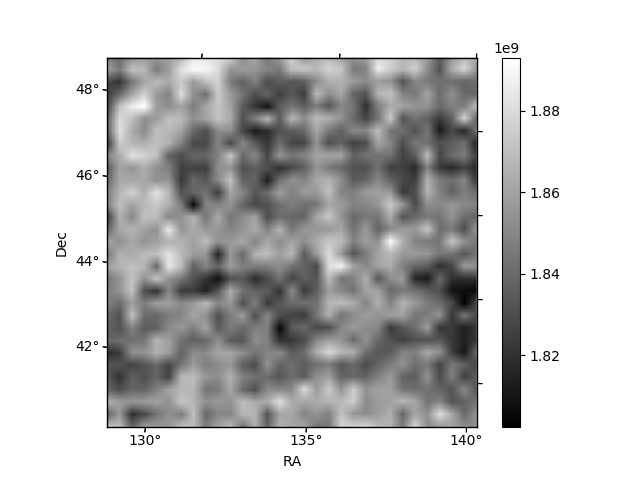
Histogram calculated using DETX and DETY for each event in the final _common_clean file
| Quadrant A |  |
 |
Quadrant B |
|---|---|---|---|
| Quadrant D |  |
 |
Quadrant C |
| Plot type | Count rate plots | Images |
|---|---|---|
| Comparison with Poisson distribution Blue bars denote a histogram of data divided into 1 sec bins. Red curve is a Poisson curve with rate = median count rate of data. |
 |
 |
| Quadrant-wise count rates Data is divided into 100 sec bins |
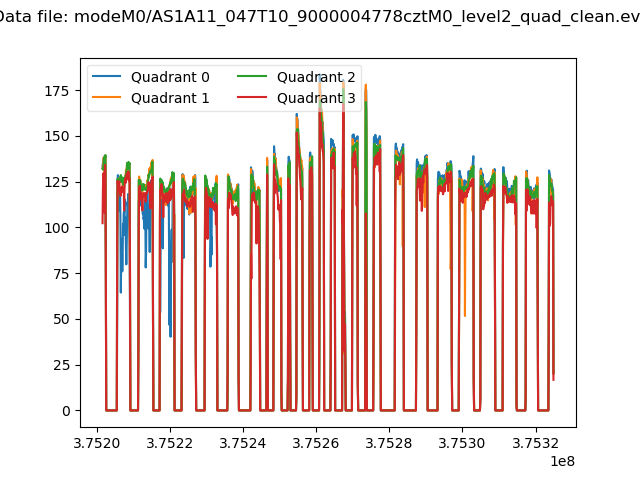 |
|
| Module-wise count rates for Quadrant A Data is divided into 100 sec bins |
 |
 |
| Module-wise count rates for Quadrant B Data is divided into 100 sec bins |
 |
 |
| Module-wise count rates for Quadrant C Data is divided into 100 sec bins |
 |
 |
| Module-wise count rates for Quadrant D Data is divided into 100 sec bins |
 |
 |
| Parameter | Plot |
|---|---|
| CZT HV Monitor |  |
| D_VDD | 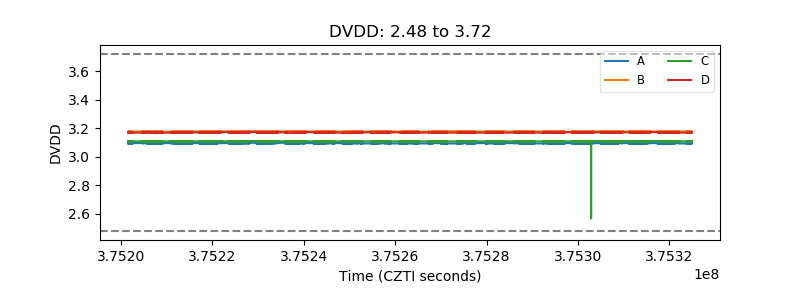 |
| Temperature 1 |  |
| Veto HV Monitor |  |
| Veto LLD | 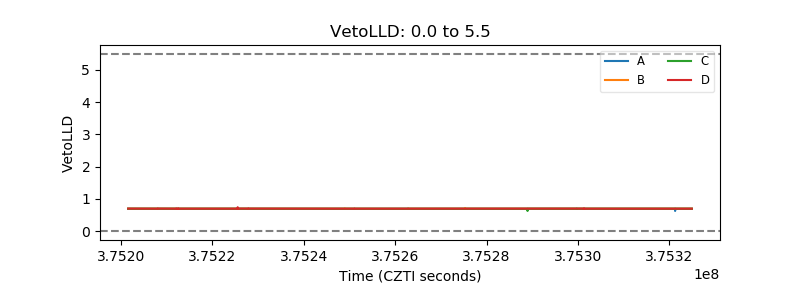 |
| Alpha Counter |  |
| _CPM_Rate |  |
| CZT Counter |  |
| +2.5 Volts monitor |  |
| +5 Volts monitor | 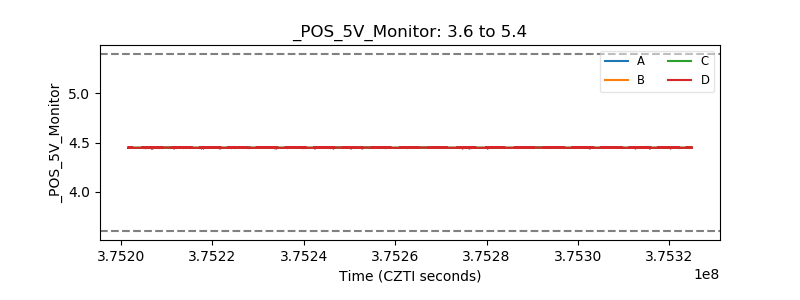 |
| _ROLL_ROT |  |
| _Roll_DEC |  |
| _Roll_RA |  |
| Veto Counter |  |