| Param | Original file | Final file |
|---|---|---|
| Filename | modeM0/AS1A11_046T01_9000004776cztM0_level2_bc.evt | modeM0/AS1A11_046T01_9000004776cztM0_level2_quad_clean.evt |
| Size (bytes) | 2,189,404,800 | 654,376,320 |
| Size | 2.0 GB | 624.1 MB |
| Events in quadrant A | 20,669,979 | 4,260,272 |
| Events in quadrant B | 13,790,836 | 4,501,065 |
| Events in quadrant C | 8,172,067 | 4,524,833 |
| Events in quadrant D | 21,401,705 | 4,236,883 |
| Mode SS | |||
|---|---|---|---|
| Quadrant | BADHDUFLAG | Total packets | Discarded packets |
| A | 0 | 684 | 0 |
| B | 0 | 684 | 0 |
| C | 0 | 684 | 0 |
| D | 0 | 684 | 0 |
| Mode M0 | |||
|---|---|---|---|
| Quadrant | BADHDUFLAG | Total packets | Discarded packets |
| A | 0 | 133880 | 0 |
| B | 0 | 94710 | 0 |
| C | 0 | 70361 | 0 |
| D | 0 | 117197 | 0 |
| Mode M9 | |||
|---|---|---|---|
| Quadrant | BADHDUFLAG | Total packets | Discarded packets |
| A | 0 | 149 | 0 |
| B | 0 | 149 | 0 |
| C | 0 | 149 | 0 |
| D | 0 | 149 | 0 |
| Quadrant | Total seconds | Saturated seconds | Saturation percentage |
|---|---|---|---|
| A | 33407 | 7575 | 22.674888% |
| B | 33407 | 2301 | 6.887778% |
| C | 33407 | 198 | 0.592690% |
| D | 33407 | 1856 | 5.555722% |
Noise dominated data is calculated using 1-second bins in cleaned event files. If a bin has >2000 counts, and if more than 50% of those come from <1% of pixels, then it is considered to be noise-dominated and hence unusable.
| Quadrant | # 1 sec bins | Bins with >0 counts | Bins with >2000 counts | High rate bins dominated by noise | Noise dominated (total time) | Noise dominated (detector-on time) | Marked lightcurve |
|---|---|---|---|---|---|---|---|
| A | 48261 | 33407 | 77 | 77 | 0.16% | 0.23% | 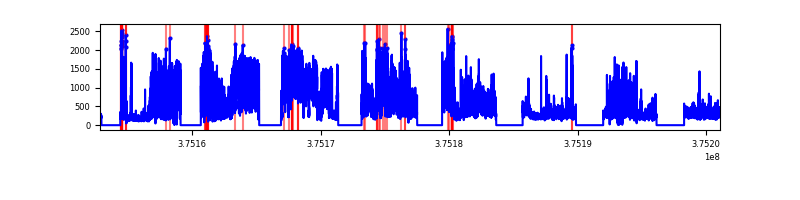 |
| B | 48261 | 33405 | 187 | 187 | 0.39% | 0.56% |  |
| C | 48261 | 33407 | 23 | 23 | 0.05% | 0.07% |  |
| D | 48261 | 33406 | 274 | 274 | 0.57% | 0.82% | 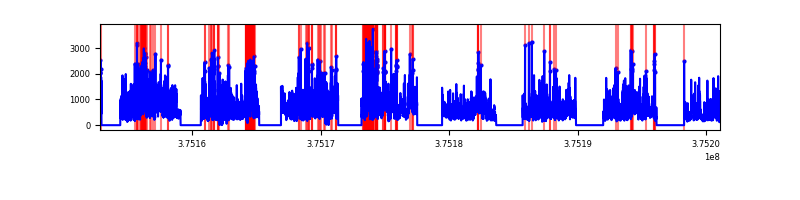 |
Top three noisy pixels from each quadrant. If the there are fewer than three noisy pixels in the level2.evt file, extra rows are filled as -1
| Pixel properties | Quadrant properties | ||||||
|---|---|---|---|---|---|---|---|
| Quadrant | DetID | PixID | Counts | Sigma | Mean | Median | Sigma |
| A | 15 | 169 | 13892981 | 37270.29 | 1724 | 1708 | 372.7 |
| A | 13 | 6 | 72704 | 190.48 | 1724 | 1708 | 372.7 |
| A | 13 | 254 | 51446 | 133.45 | 1724 | 1708 | 372.7 |
| B | 5 | 172 | 3883874 | 10940.65 | 1807 | 1773 | 354.8 |
| B | 4 | 170 | 841051 | 2365.28 | 1807 | 1773 | 354.8 |
| B | 5 | 200 | 683811 | 1922.14 | 1807 | 1773 | 354.8 |
| C | 0 | 10 | 548778 | 1345.61 | 1788 | 1781 | 406.5 |
| C | 10 | 49 | 287235 | 702.22 | 1788 | 1781 | 406.5 |
| C | 3 | 233 | 101659 | 245.7 | 1788 | 1781 | 406.5 |
| D | 8 | 195 | 9684884 | 21133.71 | 1783 | 1747 | 458.2 |
| D | 12 | 3 | 1191165 | 2595.94 | 1783 | 1747 | 458.2 |
| D | 2 | 250 | 829022 | 1805.55 | 1783 | 1747 | 458.2 |
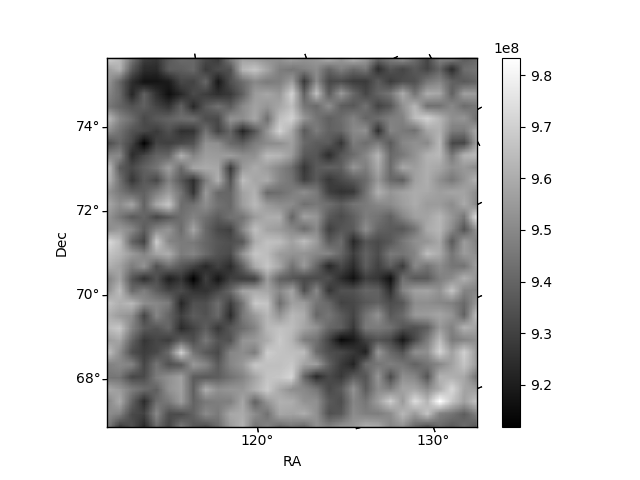
Histogram calculated using DETX and DETY for each event in the final _common_clean file
| Quadrant A |  |
 |
Quadrant B |
|---|---|---|---|
| Quadrant D |  |
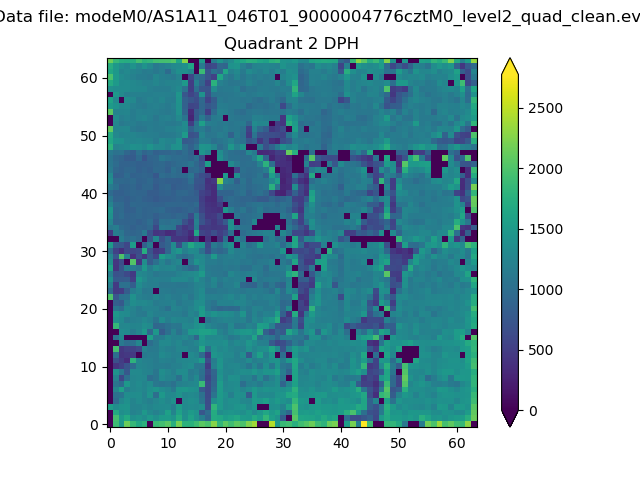 |
Quadrant C |
| Plot type | Count rate plots | Images |
|---|---|---|
| Comparison with Poisson distribution Blue bars denote a histogram of data divided into 1 sec bins. Red curve is a Poisson curve with rate = median count rate of data. |
 |
 |
| Quadrant-wise count rates Data is divided into 100 sec bins |
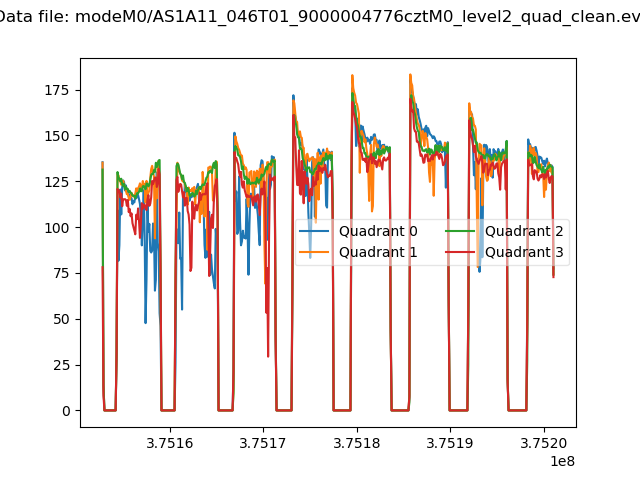 |
|
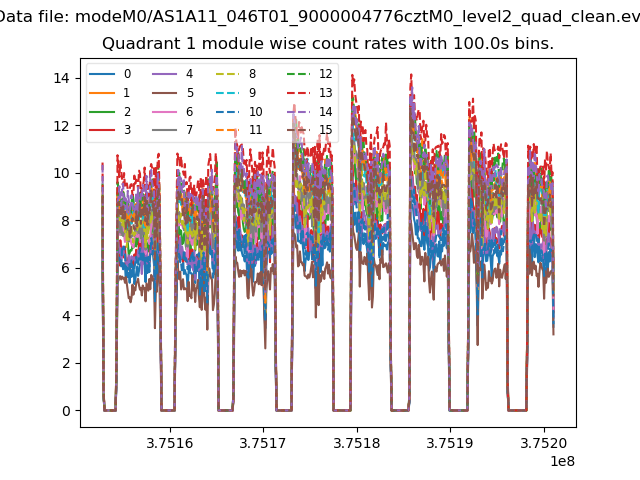
| Module-wise count rates for Quadrant A Data is divided into 100 sec bins |
 |
 |
| Module-wise count rates for Quadrant B Data is divided into 100 sec bins |
 |
 |
| Module-wise count rates for Quadrant C Data is divided into 100 sec bins |
 |
 |
| Module-wise count rates for Quadrant D Data is divided into 100 sec bins |
 |
 |
| Parameter | Plot |
|---|---|
| CZT HV Monitor | 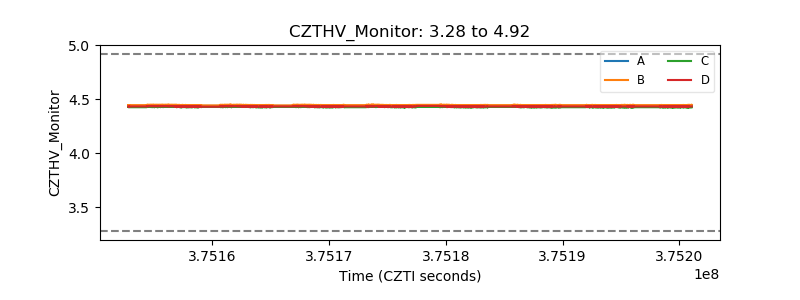 |
| D_VDD |  |
| Temperature 1 |  |
| Veto HV Monitor |  |
| Veto LLD |  |
| Alpha Counter |  |
| _CPM_Rate |  |
| CZT Counter |  |
| +2.5 Volts monitor | 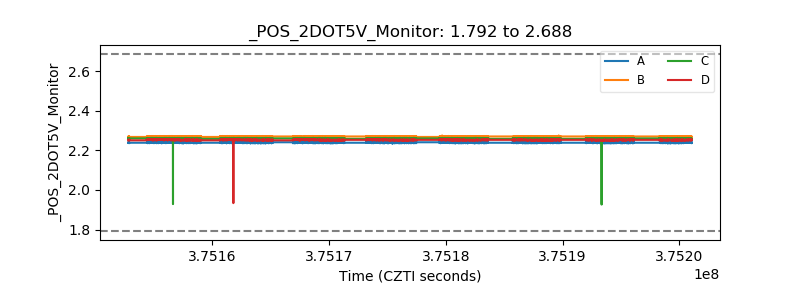 |
| +5 Volts monitor | 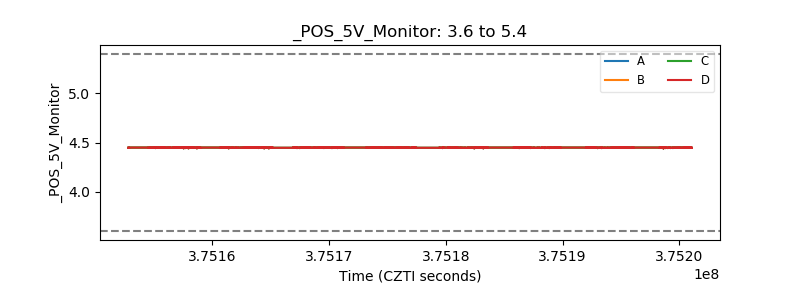 |
| _ROLL_ROT |  |
| _Roll_DEC |  |
| _Roll_RA | 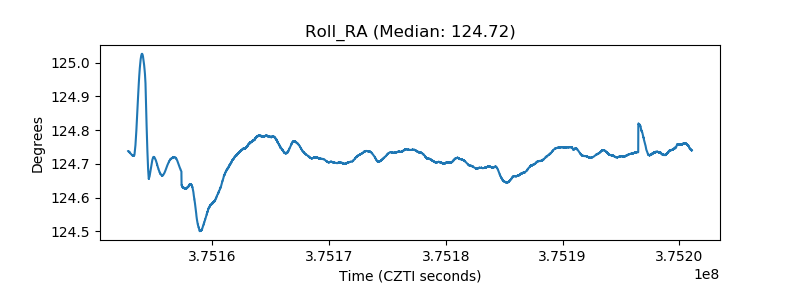 |
| Veto Counter |  |