| Param | Original file | Final file |
|---|---|---|
| Filename | modeM0/AS1A10_067T01_9000004774cztM0_level2_bc.evt | modeM0/AS1A10_067T01_9000004774cztM0_level2_quad_clean.evt |
| Size (bytes) | 1,149,197,760 | 168,851,520 |
| Size | 1.1 GB | 161.0 MB |
| Events in quadrant A | 11,599,281 | 807,350 |
| Events in quadrant B | 4,228,807 | 1,189,521 |
| Events in quadrant C | 3,439,950 | 1,183,664 |
| Events in quadrant D | 14,584,340 | 971,617 |
| Mode M9 | |||
|---|---|---|---|
| Quadrant | BADHDUFLAG | Total packets | Discarded packets |
| A | 0 | 25 | 0 |
| B | 0 | 25 | 0 |
| C | 0 | 25 | 0 |
| D | 0 | 25 | 0 |
| Mode SS | |||
|---|---|---|---|
| Quadrant | BADHDUFLAG | Total packets | Discarded packets |
| A | 0 | 284 | 0 |
| B | 0 | 284 | 0 |
| C | 0 | 284 | 0 |
| D | 0 | 284 | 0 |
| Mode M0 | |||
|---|---|---|---|
| Quadrant | BADHDUFLAG | Total packets | Discarded packets |
| A | 0 | 91450 | 0 |
| B | 0 | 34524 | 0 |
| C | 0 | 30294 | 0 |
| D | 0 | 72931 | 0 |
| Quadrant | Total seconds | Saturated seconds | Saturation percentage |
|---|---|---|---|
| A | 13854 | 9810 | 70.809874% |
| B | 13854 | 546 | 3.941100% |
| C | 13854 | 170 | 1.227082% |
| D | 13854 | 3727 | 26.901978% |
Noise dominated data is calculated using 1-second bins in cleaned event files. If a bin has >2000 counts, and if more than 50% of those come from <1% of pixels, then it is considered to be noise-dominated and hence unusable.
| Quadrant | # 1 sec bins | Bins with >0 counts | Bins with >2000 counts | High rate bins dominated by noise | Noise dominated (total time) | Noise dominated (detector-on time) | Marked lightcurve |
|---|---|---|---|---|---|---|---|
| A | 16480 | 13852 | 13 | 13 | 0.08% | 0.09% | 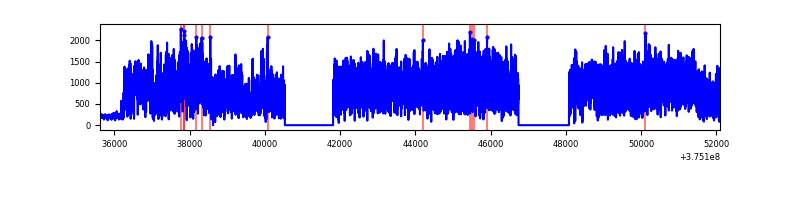 |
| B | 16480 | 13854 | 12 | 12 | 0.07% | 0.09% |  |
| C | 16480 | 13854 | 34 | 34 | 0.21% | 0.25% |  |
| D | 16479 | 13852 | 649 | 649 | 3.94% | 4.69% |  |
Top three noisy pixels from each quadrant. If the there are fewer than three noisy pixels in the level2.evt file, extra rows are filled as -1
| Pixel properties | Quadrant properties | ||||||
|---|---|---|---|---|---|---|---|
| Quadrant | DetID | PixID | Counts | Sigma | Mean | Median | Sigma |
| A | 15 | 169 | 9870609 | 98111.47 | 439 | 434 | 100.6 |
| A | 13 | 6 | 20886 | 203.3 | 439 | 434 | 100.6 |
| A | 13 | 254 | 14646 | 141.27 | 439 | 434 | 100.6 |
| B | 5 | 172 | 882516 | 6368.5 | 685 | 671 | 138.5 |
| B | 4 | 170 | 194196 | 1397.6 | 685 | 671 | 138.5 |
| B | 5 | 200 | 112627 | 808.52 | 685 | 671 | 138.5 |
| C | 1 | 23 | 273892 | 1772.17 | 675 | 671 | 154.2 |
| C | 10 | 49 | 146609 | 946.59 | 675 | 671 | 154.2 |
| C | 0 | 10 | 144267 | 931.4 | 675 | 671 | 154.2 |
| D | 8 | 195 | 5130571 | 33625.09 | 607 | 586 | 152.6 |
| D | 12 | 3 | 4329278 | 28372.92 | 607 | 586 | 152.6 |
| D | 2 | 250 | 544100 | 3562.53 | 607 | 586 | 152.6 |
Histogram calculated using DETX and DETY for each event in the final _common_clean file
| Quadrant A |  |
 |
Quadrant B |
|---|---|---|---|
| Quadrant D |  |
 |
Quadrant C |
| Plot type | Count rate plots | Images |
|---|---|---|
| Comparison with Poisson distribution Blue bars denote a histogram of data divided into 1 sec bins. Red curve is a Poisson curve with rate = median count rate of data. |
 |
 |
| Quadrant-wise count rates Data is divided into 100 sec bins |
 |
|
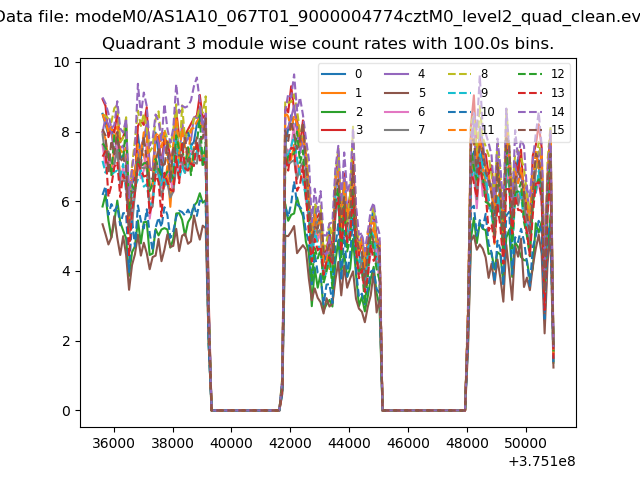
| Module-wise count rates for Quadrant A Data is divided into 100 sec bins |
 |
 |
| Module-wise count rates for Quadrant B Data is divided into 100 sec bins |
 |
 |
| Module-wise count rates for Quadrant C Data is divided into 100 sec bins |
 |
 |
| Module-wise count rates for Quadrant D Data is divided into 100 sec bins |
 |
 |
| Parameter | Plot |
|---|---|
| CZT HV Monitor |  |
| D_VDD |  |
| Temperature 1 |  |
| Veto HV Monitor |  |
| Veto LLD |  |
| Alpha Counter |  |
| _CPM_Rate |  |
| CZT Counter |  |
| +2.5 Volts monitor |  |
| +5 Volts monitor |  |
| _ROLL_ROT | 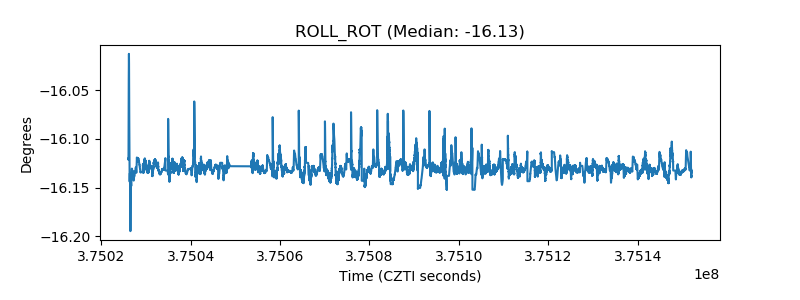 |
| _Roll_DEC | 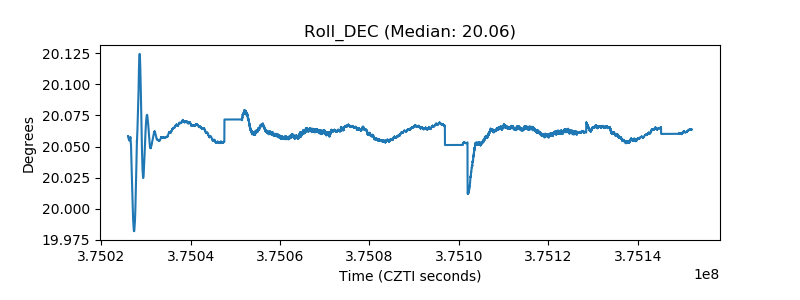 |
| _Roll_RA |  |
| Veto Counter |  |