| Param | Original file | Final file |
|---|---|---|
| Filename | modeM0/AS1T04_066T01_9000004772cztM0_level2_bc.evt | modeM0/AS1T04_066T01_9000004772cztM0_level2_quad_clean.evt |
| Size (bytes) | 2,648,689,920 | 585,132,480 |
| Size | 2.5 GB | 558.0 MB |
| Events in quadrant A | 9,251,986 | 3,938,834 |
| Events in quadrant B | 16,695,794 | 3,802,797 |
| Events in quadrant C | 9,859,046 | 3,821,523 |
| Events in quadrant D | 41,718,836 | 3,434,318 |
| Mode M0 | |||
|---|---|---|---|
| Quadrant | BADHDUFLAG | Total packets | Discarded packets |
| A | 0 | 82854 | 0 |
| B | 0 | 114912 | 0 |
| C | 0 | 84967 | 0 |
| D | 0 | 188552 | 0 |
| Mode SS | |||
|---|---|---|---|
| Quadrant | BADHDUFLAG | Total packets | Discarded packets |
| A | 0 | 814 | 0 |
| B | 0 | 814 | 0 |
| C | 0 | 814 | 0 |
| D | 0 | 814 | 0 |
| Mode M9 | |||
|---|---|---|---|
| Quadrant | BADHDUFLAG | Total packets | Discarded packets |
| A | 0 | 153 | 0 |
| B | 0 | 153 | 0 |
| C | 0 | 153 | 0 |
| D | 0 | 153 | 0 |
| Quadrant | Total seconds | Saturated seconds | Saturation percentage |
|---|---|---|---|
| A | 39670 | 58 | 0.146206% |
| B | 39670 | 2004 | 5.051676% |
| C | 39670 | 325 | 0.819259% |
| D | 39670 | 4977 | 12.546005% |
Noise dominated data is calculated using 1-second bins in cleaned event files. If a bin has >2000 counts, and if more than 50% of those come from <1% of pixels, then it is considered to be noise-dominated and hence unusable.
| Quadrant | # 1 sec bins | Bins with >0 counts | Bins with >2000 counts | High rate bins dominated by noise | Noise dominated (total time) | Noise dominated (detector-on time) | Marked lightcurve |
|---|---|---|---|---|---|---|---|
| A | 55084 | 39671 | 3 | 3 | 0.01% | 0.01% |  |
| B | 55084 | 39670 | 160 | 160 | 0.29% | 0.40% |  |
| C | 55084 | 39670 | 25 | 25 | 0.05% | 0.06% |  |
| D | 55084 | 39670 | 1306 | 1306 | 2.37% | 3.29% |  |
Top three noisy pixels from each quadrant. If the there are fewer than three noisy pixels in the level2.evt file, extra rows are filled as -1
| Pixel properties | Quadrant properties | ||||||
|---|---|---|---|---|---|---|---|
| Quadrant | DetID | PixID | Counts | Sigma | Mean | Median | Sigma |
| A | 15 | 47 | 443580 | 917.58 | 2230 | 2202 | 481.0 |
| A | 14 | 254 | 73843 | 148.93 | 2230 | 2202 | 481.0 |
| A | 13 | 6 | 72661 | 146.48 | 2230 | 2202 | 481.0 |
| B | 4 | 170 | 3012980 | 7117.65 | 2181 | 2140 | 423.0 |
| B | 5 | 172 | 2601300 | 6144.43 | 2181 | 2140 | 423.0 |
| B | 0 | 219 | 645471 | 1520.84 | 2181 | 2140 | 423.0 |
| C | 0 | 10 | 800069 | 1664.09 | 2139 | 2129 | 479.5 |
| C | 1 | 23 | 165502 | 340.71 | 2139 | 2129 | 479.5 |
| C | 15 | 159 | 118805 | 243.33 | 2139 | 2129 | 479.5 |
| D | 8 | 195 | 25595054 | 46379.45 | 2076 | 2032 | 551.8 |
| D | 2 | 250 | 2052603 | 3716.03 | 2076 | 2032 | 551.8 |
| D | 10 | 203 | 1601324 | 2898.22 | 2076 | 2032 | 551.8 |
Histogram calculated using DETX and DETY for each event in the final _common_clean file
| Quadrant A |  |
 |
Quadrant B |
|---|---|---|---|
| Quadrant D |  |
 |
Quadrant C |
| Plot type | Count rate plots | Images |
|---|---|---|
| Comparison with Poisson distribution Blue bars denote a histogram of data divided into 1 sec bins. Red curve is a Poisson curve with rate = median count rate of data. |
 |
 |
| Quadrant-wise count rates Data is divided into 100 sec bins |
 |
|
| Module-wise count rates for Quadrant A Data is divided into 100 sec bins |
 |
 |
| Module-wise count rates for Quadrant B Data is divided into 100 sec bins |
 |
 |
| Module-wise count rates for Quadrant C Data is divided into 100 sec bins |
 |
 |
| Module-wise count rates for Quadrant D Data is divided into 100 sec bins |
 |
 |
| Parameter | Plot |
|---|---|
| CZT HV Monitor |  |
| D_VDD |  |
| Temperature 1 |  |
| Veto HV Monitor | 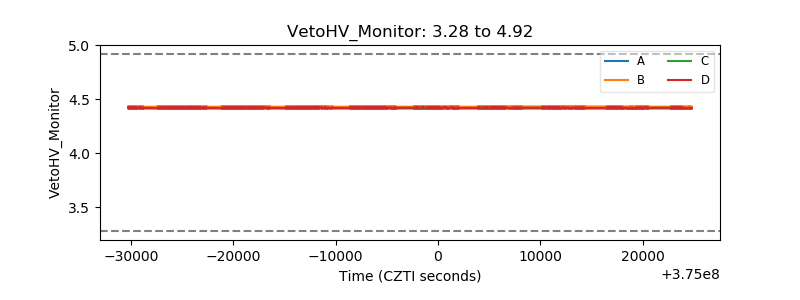 |
| Veto LLD |  |
| Alpha Counter |  |
| _CPM_Rate |  |
| CZT Counter |  |
| +2.5 Volts monitor |  |
| +5 Volts monitor |  |
| _ROLL_ROT |  |
| _Roll_DEC |  |
| _Roll_RA |  |
| Veto Counter |  |