| Param | Original file | Final file |
|---|---|---|
| Filename | modeM0/AS1A10_067T01_9000004770cztM0_level2_bc.evt | modeM0/AS1A10_067T01_9000004770cztM0_level2_quad_clean.evt |
| Size (bytes) | 3,812,195,520 | 907,378,560 |
| Size | 3.6 GB | 865.3 MB |
| Events in quadrant A | 15,328,320 | 5,855,437 |
| Events in quadrant B | 27,213,843 | 5,724,300 |
| Events in quadrant C | 20,290,176 | 5,685,323 |
| Events in quadrant D | 47,800,859 | 5,351,408 |
| Mode M9 | |||
|---|---|---|---|
| Quadrant | BADHDUFLAG | Total packets | Discarded packets |
| A | 0 | 270 | 0 |
| B | 0 | 270 | 0 |
| C | 0 | 270 | 0 |
| D | 0 | 270 | 0 |
| Mode M0 | |||
|---|---|---|---|
| Quadrant | BADHDUFLAG | Total packets | Discarded packets |
| A | 0 | 145513 | 0 |
| B | 0 | 201757 | 0 |
| C | 0 | 162237 | 0 |
| D | 0 | 256844 | 0 |
| Mode SS | |||
|---|---|---|---|
| Quadrant | BADHDUFLAG | Total packets | Discarded packets |
| A | 0 | 1448 | 0 |
| B | 0 | 1449 | 0 |
| C | 0 | 1452 | 0 |
| D | 0 | 1454 | 0 |
| Quadrant | Total seconds | Saturated seconds | Saturation percentage |
|---|---|---|---|
| A | 71024 | 109 | 0.153469% |
| B | 70973 | 5373 | 7.570485% |
| C | 71020 | 1360 | 1.914954% |
| D | 70890 | 3451 | 4.868106% |
Noise dominated data is calculated using 1-second bins in cleaned event files. If a bin has >2000 counts, and if more than 50% of those come from <1% of pixels, then it is considered to be noise-dominated and hence unusable.
| Quadrant | # 1 sec bins | Bins with >0 counts | Bins with >2000 counts | High rate bins dominated by noise | Noise dominated (total time) | Noise dominated (detector-on time) | Marked lightcurve |
|---|---|---|---|---|---|---|---|
| A | 98090 | 71191 | 5 | 5 | 0.01% | 0.01% |  |
| B | 98090 | 71160 | 291 | 291 | 0.30% | 0.41% |  |
| C | 98090 | 71196 | 518 | 518 | 0.53% | 0.73% |  |
| D | 98090 | 71112 | 449 | 449 | 0.46% | 0.63% |  |
Top three noisy pixels from each quadrant. If the there are fewer than three noisy pixels in the level2.evt file, extra rows are filled as -1
| Pixel properties | Quadrant properties | ||||||
|---|---|---|---|---|---|---|---|
| Quadrant | DetID | PixID | Counts | Sigma | Mean | Median | Sigma |
| A | 14 | 254 | 171205 | 199.43 | 3862 | 3805 | 839.4 |
| A | 13 | 254 | 117565 | 135.53 | 3862 | 3805 | 839.4 |
| A | 13 | 6 | 95806 | 109.61 | 3862 | 3805 | 839.4 |
| B | 5 | 172 | 7855843 | 10797.2 | 3703 | 3627 | 727.2 |
| B | 0 | 219 | 1283778 | 1760.27 | 3703 | 3627 | 727.2 |
| B | 5 | 31 | 700746 | 958.57 | 3703 | 3627 | 727.2 |
| C | 1 | 23 | 2859135 | 3406.52 | 3713 | 3692 | 838.2 |
| C | 0 | 10 | 1373201 | 1633.81 | 3713 | 3692 | 838.2 |
| C | 9 | 187 | 491211 | 581.61 | 3713 | 3692 | 838.2 |
| D | 8 | 195 | 19494622 | 20044.18 | 3695 | 3612 | 972.4 |
| D | 2 | 250 | 4227386 | 4343.65 | 3695 | 3612 | 972.4 |
| D | 12 | 218 | 1739162 | 1784.81 | 3695 | 3612 | 972.4 |
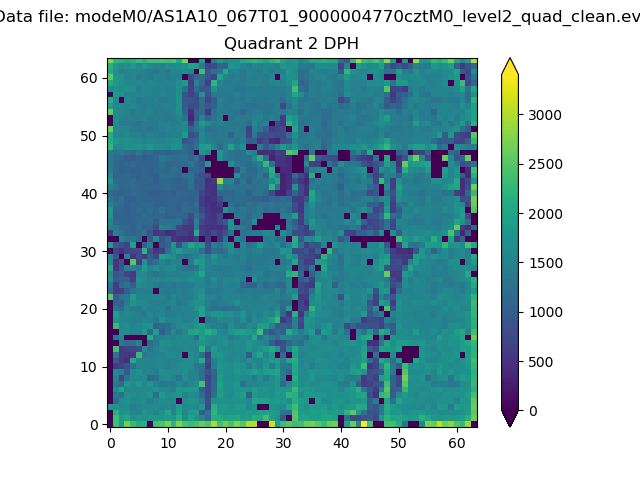
Histogram calculated using DETX and DETY for each event in the final _common_clean file
| Quadrant A | 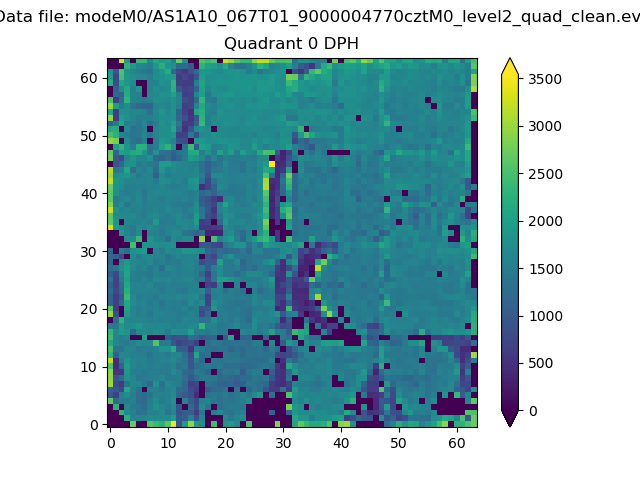 |
 |
Quadrant B |
|---|---|---|---|
| Quadrant D |  |
 |
Quadrant C |
| Plot type | Count rate plots | Images |
|---|---|---|
| Comparison with Poisson distribution Blue bars denote a histogram of data divided into 1 sec bins. Red curve is a Poisson curve with rate = median count rate of data. |
 |
 |
| Quadrant-wise count rates Data is divided into 100 sec bins |
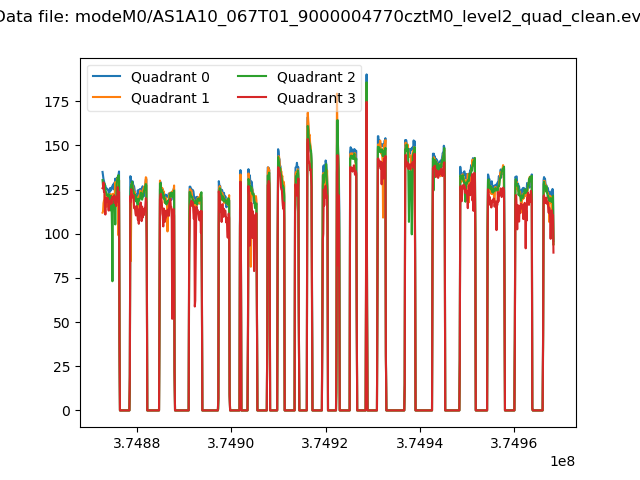 |
|
| Module-wise count rates for Quadrant A Data is divided into 100 sec bins |
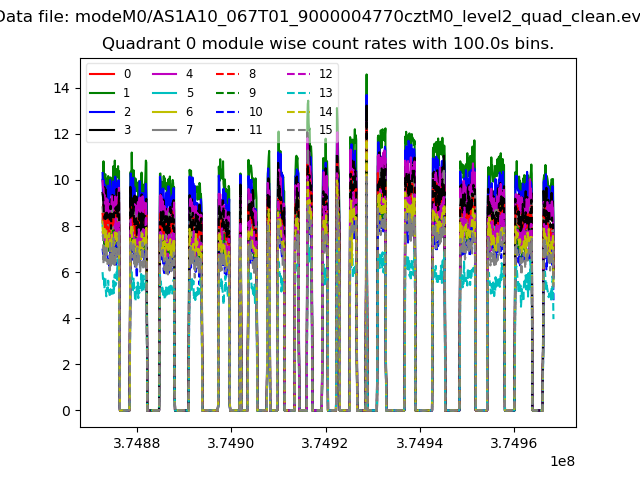 |
 |
| Module-wise count rates for Quadrant B Data is divided into 100 sec bins |
 |
 |
| Module-wise count rates for Quadrant C Data is divided into 100 sec bins |
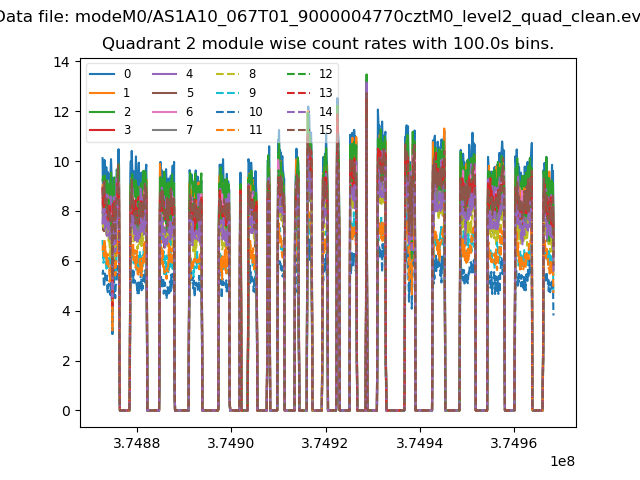 |
 |
| Module-wise count rates for Quadrant D Data is divided into 100 sec bins |
 |
 |
| Parameter | Plot |
|---|---|
| CZT HV Monitor |  |
| D_VDD |  |
| Temperature 1 |  |
| Veto HV Monitor |  |
| Veto LLD |  |
| Alpha Counter |  |
| _CPM_Rate |  |
| CZT Counter | 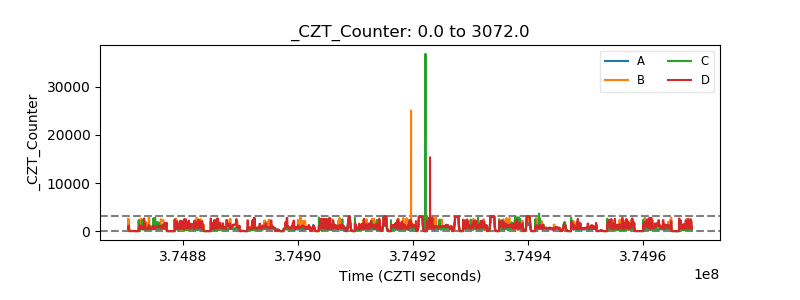 |
| +2.5 Volts monitor | 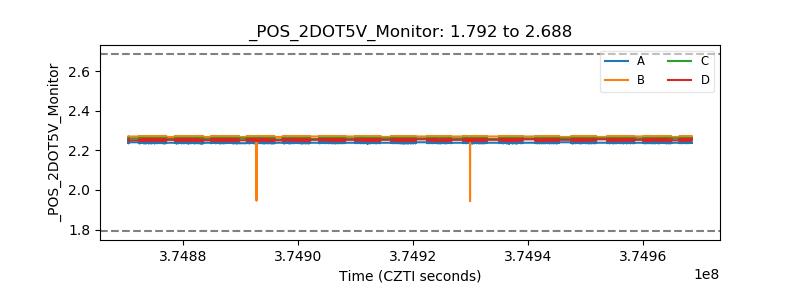 |
| +5 Volts monitor | 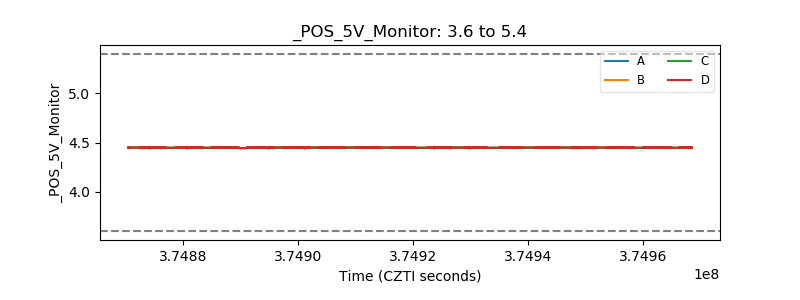 |
| _ROLL_ROT |  |
| _Roll_DEC |  |
| _Roll_RA | 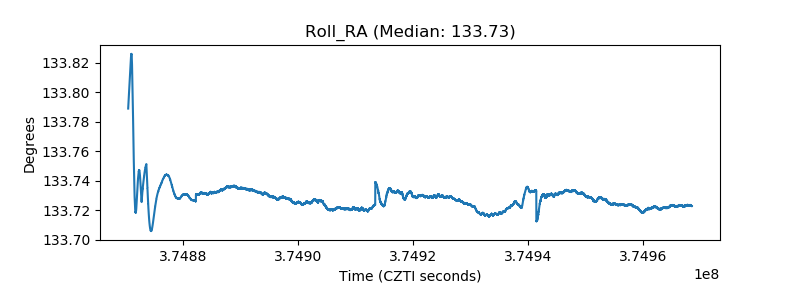 |
| Veto Counter | 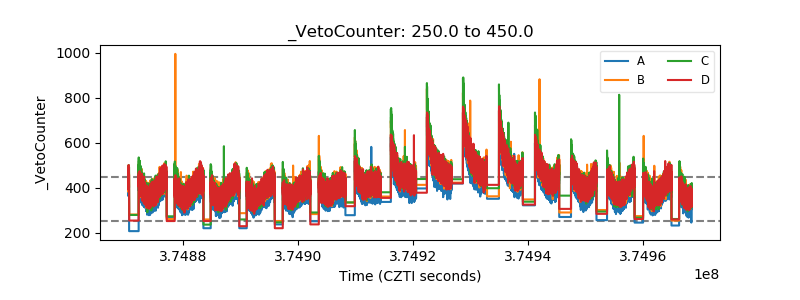 |