| Param | Original file | Final file |
|---|---|---|
| Filename | modeM0/AS1A11_080T02_9000004768cztM0_level2_bc.evt | modeM0/AS1A11_080T02_9000004768cztM0_level2_quad_clean.evt |
| Size (bytes) | 6,877,955,520 | 1,697,613,120 |
| Size | 6.4 GB | 1.6 GB |
| Events in quadrant A | 28,236,275 | 10,844,829 |
| Events in quadrant B | 49,061,033 | 10,701,782 |
| Events in quadrant C | 34,523,235 | 10,735,998 |
| Events in quadrant D | 87,496,740 | 10,069,878 |
| Mode M9 | |||
|---|---|---|---|
| Quadrant | BADHDUFLAG | Total packets | Discarded packets |
| A | 0 | 511 | 0 |
| B | 0 | 511 | 0 |
| C | 0 | 511 | 0 |
| D | 0 | 512 | 0 |
| Mode SS | |||
|---|---|---|---|
| Quadrant | BADHDUFLAG | Total packets | Discarded packets |
| A | 0 | 2700 | 0 |
| B | 0 | 2700 | 0 |
| C | 0 | 2700 | 0 |
| D | 0 | 2700 | 0 |
| Mode M0 | |||
|---|---|---|---|
| Quadrant | BADHDUFLAG | Total packets | Discarded packets |
| A | 0 | 268802 | 0 |
| B | 0 | 375534 | 0 |
| C | 0 | 290495 | 0 |
| D | 0 | 473337 | 0 |
| Quadrant | Total seconds | Saturated seconds | Saturation percentage |
|---|---|---|---|
| A | 132349 | 168 | 0.126937% |
| B | 132350 | 9431 | 7.125803% |
| C | 132352 | 1930 | 1.458233% |
| D | 132353 | 7574 | 5.722575% |
Noise dominated data is calculated using 1-second bins in cleaned event files. If a bin has >2000 counts, and if more than 50% of those come from <1% of pixels, then it is considered to be noise-dominated and hence unusable.
| Quadrant | # 1 sec bins | Bins with >0 counts | Bins with >2000 counts | High rate bins dominated by noise | Noise dominated (total time) | Noise dominated (detector-on time) | Marked lightcurve |
|---|---|---|---|---|---|---|---|
| A | 188376 | 132360 | 1 | 1 | 0.00% | 0.00% |  |
| B | 188376 | 132351 | 373 | 373 | 0.20% | 0.28% |  |
| C | 188376 | 132352 | 382 | 382 | 0.20% | 0.29% |  |
| D | 188376 | 132350 | 1432 | 1432 | 0.76% | 1.08% |  |
Top three noisy pixels from each quadrant. If the there are fewer than three noisy pixels in the level2.evt file, extra rows are filled as -1
| Pixel properties | Quadrant properties | ||||||
|---|---|---|---|---|---|---|---|
| Quadrant | DetID | PixID | Counts | Sigma | Mean | Median | Sigma |
| A | 13 | 6 | 229697 | 142.54 | 7143 | 7040 | 1562.1 |
| A | 13 | 254 | 227638 | 141.22 | 7143 | 7040 | 1562.1 |
| A | 14 | 234 | 128925 | 78.03 | 7143 | 7040 | 1562.1 |
| B | 5 | 172 | 10640747 | 7825.88 | 6938 | 6797 | 1358.8 |
| B | 0 | 219 | 4115321 | 3023.6 | 6938 | 6797 | 1358.8 |
| B | 5 | 31 | 1807929 | 1325.51 | 6938 | 6797 | 1358.8 |
| C | 0 | 10 | 2404314 | 1531.3 | 6917 | 6883 | 1565.6 |
| C | 9 | 187 | 1928978 | 1227.69 | 6917 | 6883 | 1565.6 |
| C | 1 | 241 | 973077 | 617.13 | 6917 | 6883 | 1565.6 |
| D | 8 | 195 | 30164408 | 17607.85 | 6787 | 6646 | 1712.7 |
| D | 10 | 203 | 8313237 | 4849.87 | 6787 | 6646 | 1712.7 |
| D | 2 | 250 | 4401725 | 2566.1 | 6787 | 6646 | 1712.7 |
Histogram calculated using DETX and DETY for each event in the final _common_clean file
| Quadrant A |  |
 |
Quadrant B |
|---|---|---|---|
| Quadrant D |  |
 |
Quadrant C |
| Plot type | Count rate plots | Images |
|---|---|---|
| Comparison with Poisson distribution Blue bars denote a histogram of data divided into 1 sec bins. Red curve is a Poisson curve with rate = median count rate of data. |
 |
 |
| Quadrant-wise count rates Data is divided into 100 sec bins |
 |
|
| Module-wise count rates for Quadrant A Data is divided into 100 sec bins |
 |
 |
| Module-wise count rates for Quadrant B Data is divided into 100 sec bins |
 |
 |
| Module-wise count rates for Quadrant C Data is divided into 100 sec bins |
 |
 |
| Module-wise count rates for Quadrant D Data is divided into 100 sec bins |
 |
 |
| Parameter | Plot |
|---|---|
| CZT HV Monitor |  |
| D_VDD | 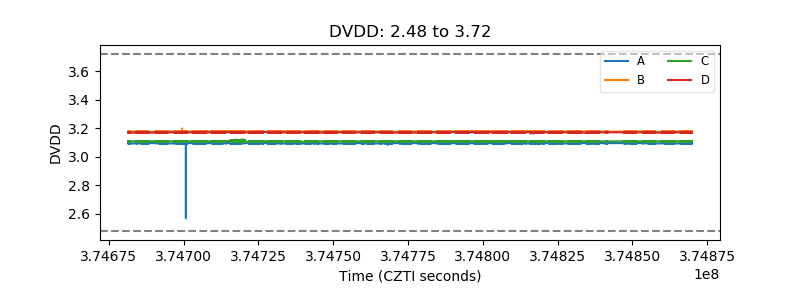 |
| Temperature 1 |  |
| Veto HV Monitor |  |
| Veto LLD |  |
| Alpha Counter |  |
| _CPM_Rate |  |
| CZT Counter |  |
| +2.5 Volts monitor | 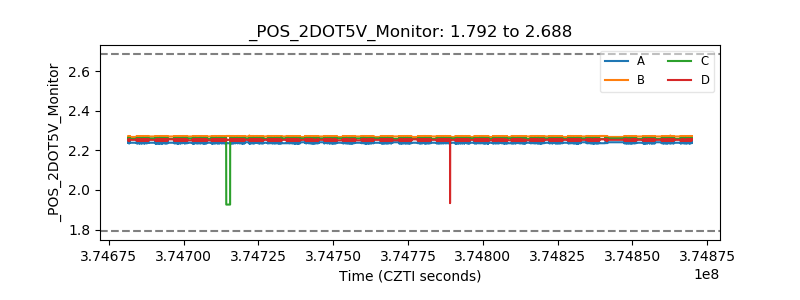 |
| +5 Volts monitor |  |
| _ROLL_ROT |  |
| _Roll_DEC |  |
| _Roll_RA | 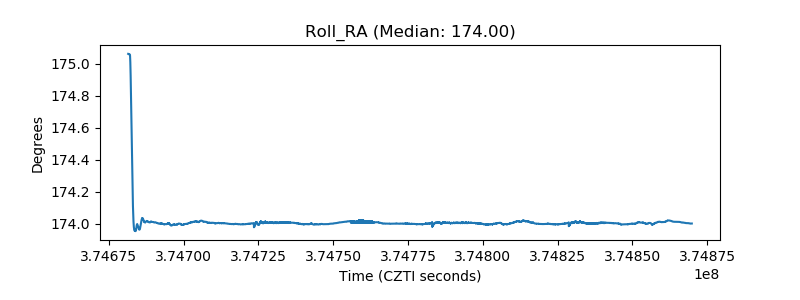 |
| Veto Counter |  |