| Param | Original file | Final file |
|---|---|---|
| Filename | modeM0/AS1A11_096T01_9000004766cztM0_level2_bc.evt | modeM0/AS1A11_096T01_9000004766cztM0_level2_quad_clean.evt |
| Size (bytes) | 8,814,456,000 | 2,108,315,520 |
| Size | 8.2 GB | 2.0 GB |
| Events in quadrant A | 35,849,688 | 13,591,112 |
| Events in quadrant B | 60,202,816 | 13,534,728 |
| Events in quadrant C | 46,182,409 | 13,228,783 |
| Events in quadrant D | 113,468,100 | 12,156,998 |
| Mode SS | |||
|---|---|---|---|
| Quadrant | BADHDUFLAG | Total packets | Discarded packets |
| A | 0 | 3388 | 0 |
| B | 0 | 3392 | 0 |
| C | 0 | 3386 | 0 |
| D | 0 | 3390 | 0 |
| Mode M0 | |||
|---|---|---|---|
| Quadrant | BADHDUFLAG | Total packets | Discarded packets |
| A | 0 | 339314 | 0 |
| B | 0 | 446997 | 0 |
| C | 0 | 375180 | 0 |
| D | 0 | 632986 | 0 |
| Mode M9 | |||
|---|---|---|---|
| Quadrant | BADHDUFLAG | Total packets | Discarded packets |
| A | 0 | 595 | 0 |
| B | 0 | 595 | 0 |
| C | 0 | 595 | 0 |
| D | 0 | 595 | 0 |
| Quadrant | Total seconds | Saturated seconds | Saturation percentage |
|---|---|---|---|
| A | 165636 | 202 | 0.121954% |
| B | 165632 | 9285 | 5.605801% |
| C | 165667 | 2673 | 1.613478% |
| D | 165537 | 18606 | 11.239783% |
Noise dominated data is calculated using 1-second bins in cleaned event files. If a bin has >2000 counts, and if more than 50% of those come from <1% of pixels, then it is considered to be noise-dominated and hence unusable.
| Quadrant | # 1 sec bins | Bins with >0 counts | Bins with >2000 counts | High rate bins dominated by noise | Noise dominated (total time) | Noise dominated (detector-on time) | Marked lightcurve |
|---|---|---|---|---|---|---|---|
| A | 233310 | 166022 | 4 | 4 | 0.00% | 0.00% |  |
| B | 233310 | 166056 | 367 | 367 | 0.16% | 0.22% | 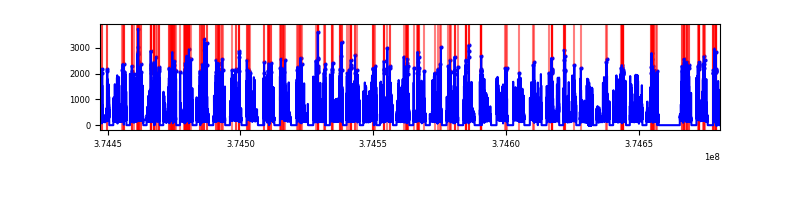 |
| C | 233310 | 166036 | 386 | 386 | 0.17% | 0.23% |  |
| D | 233310 | 165896 | 2584 | 2584 | 1.11% | 1.56% |  |
Top three noisy pixels from each quadrant. If the there are fewer than three noisy pixels in the level2.evt file, extra rows are filled as -1
| Pixel properties | Quadrant properties | ||||||
|---|---|---|---|---|---|---|---|
| Quadrant | DetID | PixID | Counts | Sigma | Mean | Median | Sigma |
| A | 13 | 254 | 293583 | 144.71 | 9042 | 8928 | 1967.0 |
| A | 13 | 6 | 292288 | 144.05 | 9042 | 8928 | 1967.0 |
| A | 14 | 235 | 130019 | 61.56 | 9042 | 8928 | 1967.0 |
| B | 5 | 172 | 12180243 | 7028.74 | 8869 | 8694 | 1731.7 |
| B | 0 | 219 | 5294756 | 3052.56 | 8869 | 8694 | 1731.7 |
| B | 0 | 189 | 1851704 | 1064.29 | 8869 | 8694 | 1731.7 |
| C | 7 | 221 | 4094488 | 2059.96 | 8699 | 8650 | 1983.5 |
| C | 0 | 10 | 3223293 | 1620.73 | 8699 | 8650 | 1983.5 |
| C | 1 | 241 | 2442747 | 1227.2 | 8699 | 8650 | 1983.5 |
| D | 8 | 195 | 34268935 | 16802.21 | 8288 | 8117 | 2039.1 |
| D | 2 | 250 | 10448841 | 5120.35 | 8288 | 8117 | 2039.1 |
| D | 2 | 249 | 7475603 | 3662.21 | 8288 | 8117 | 2039.1 |
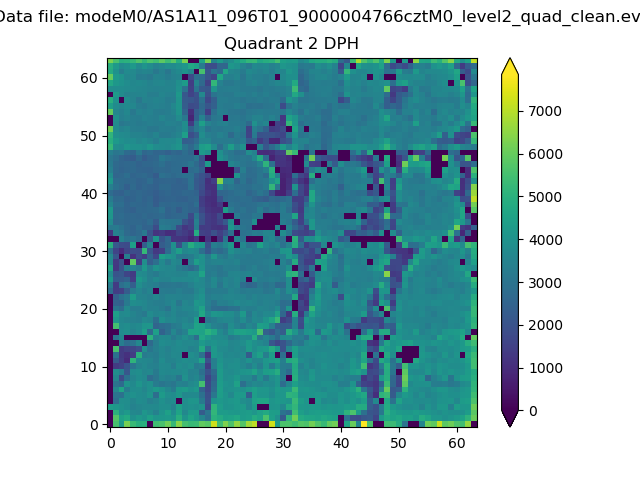
Histogram calculated using DETX and DETY for each event in the final _common_clean file
| Quadrant A |  |
 |
Quadrant B |
|---|---|---|---|
| Quadrant D |  |
 |
Quadrant C |
| Plot type | Count rate plots | Images |
|---|---|---|
| Comparison with Poisson distribution Blue bars denote a histogram of data divided into 1 sec bins. Red curve is a Poisson curve with rate = median count rate of data. |
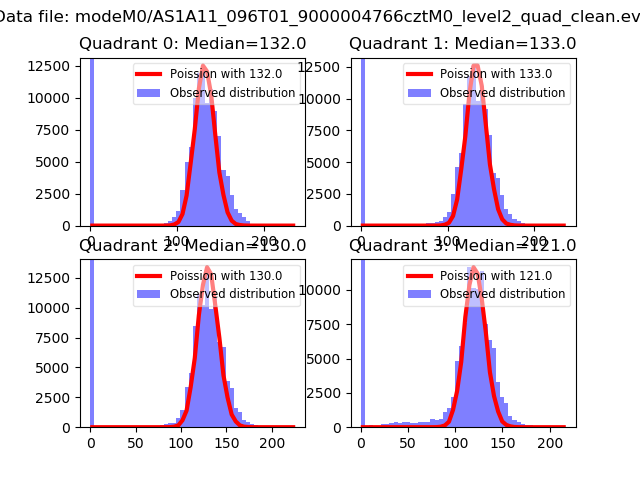 |
 |
| Quadrant-wise count rates Data is divided into 100 sec bins |
 |
|
| Module-wise count rates for Quadrant A Data is divided into 100 sec bins |
 |
 |
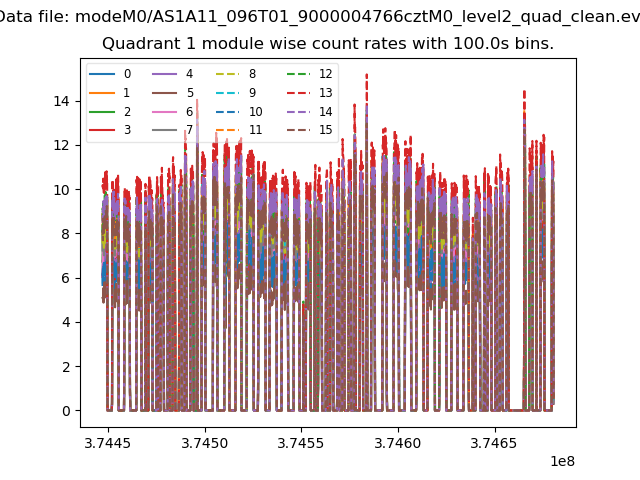
| Module-wise count rates for Quadrant B Data is divided into 100 sec bins |
 |
 |
| Module-wise count rates for Quadrant C Data is divided into 100 sec bins |
 |
 |
| Module-wise count rates for Quadrant D Data is divided into 100 sec bins |
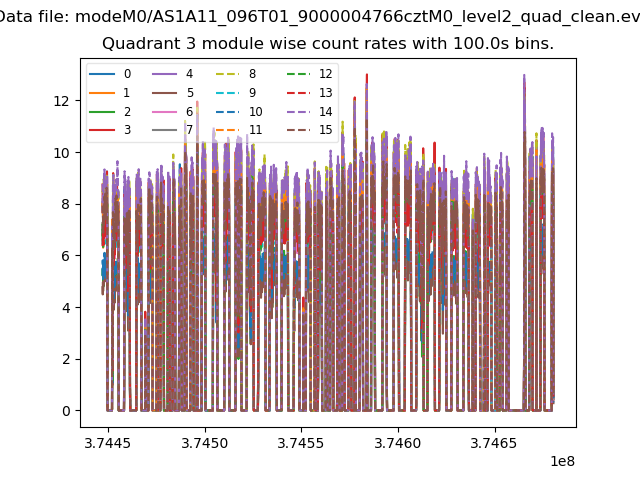 |
 |
| Parameter | Plot |
|---|---|
| CZT HV Monitor | 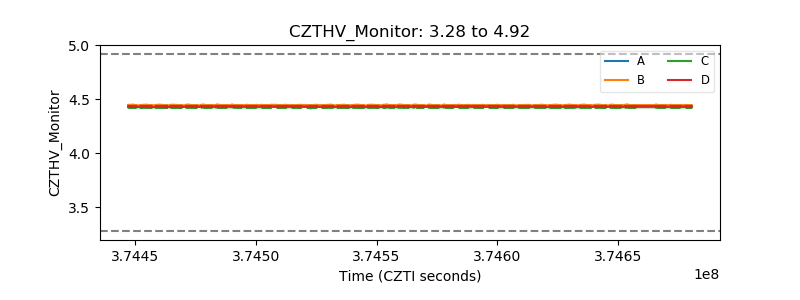 |
| D_VDD |  |
| Temperature 1 | 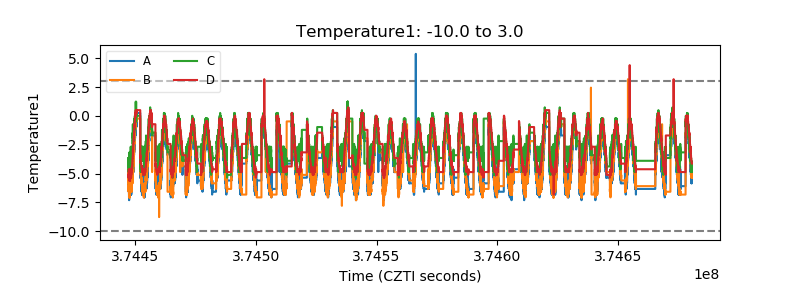 |
| Veto HV Monitor |  |
| Veto LLD |  |
| Alpha Counter |  |
| _CPM_Rate |  |
| CZT Counter |  |
| +2.5 Volts monitor |  |
| +5 Volts monitor | 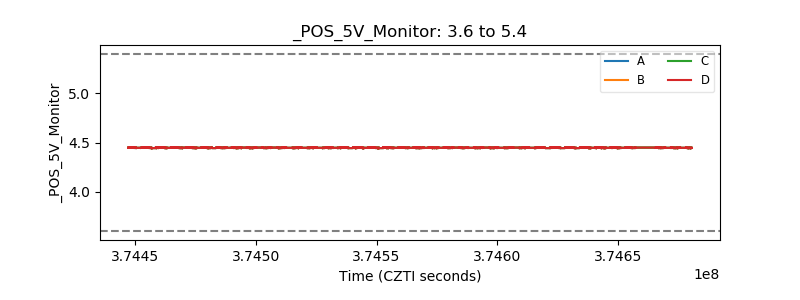 |
| _ROLL_ROT |  |
| _Roll_DEC |  |
| _Roll_RA |  |
| Veto Counter |  |