| Param | Original file | Final file |
|---|---|---|
| Filename | modeM0/AS1A11_030T01_9000004760cztM0_level2_bc.evt | modeM0/AS1A11_030T01_9000004760cztM0_level2_quad_clean.evt |
| Size (bytes) | 4,117,299,840 | 595,863,360 |
| Size | 3.8 GB | 568.3 MB |
| Events in quadrant A | 9,583,834 | 4,202,884 |
| Events in quadrant B | 12,709,282 | 4,204,265 |
| Events in quadrant C | 22,026,188 | 3,770,097 |
| Events in quadrant D | 77,338,363 | 2,788,473 |
| Mode M9 | |||
|---|---|---|---|
| Quadrant | BADHDUFLAG | Total packets | Discarded packets |
| A | 0 | 187 | 0 |
| B | 0 | 187 | 0 |
| C | 0 | 187 | 0 |
| D | 0 | 187 | 0 |
| Mode M0 | |||
|---|---|---|---|
| Quadrant | BADHDUFLAG | Total packets | Discarded packets |
| A | 0 | 91184 | 0 |
| B | 0 | 105451 | 0 |
| C | 0 | 151086 | 0 |
| D | 0 | 298768 | 0 |
| Mode SS | |||
|---|---|---|---|
| Quadrant | BADHDUFLAG | Total packets | Discarded packets |
| A | 0 | 916 | 0 |
| B | 0 | 916 | 0 |
| C | 0 | 916 | 0 |
| D | 0 | 916 | 0 |
| Quadrant | Total seconds | Saturated seconds | Saturation percentage |
|---|---|---|---|
| A | 44757 | 52 | 0.116183% |
| B | 44757 | 1584 | 3.539111% |
| C | 44757 | 6505 | 14.534039% |
| D | 44757 | 25462 | 56.889425% |
Noise dominated data is calculated using 1-second bins in cleaned event files. If a bin has >2000 counts, and if more than 50% of those come from <1% of pixels, then it is considered to be noise-dominated and hence unusable.
| Quadrant | # 1 sec bins | Bins with >0 counts | Bins with >2000 counts | High rate bins dominated by noise | Noise dominated (total time) | Noise dominated (detector-on time) | Marked lightcurve |
|---|---|---|---|---|---|---|---|
| A | 63104 | 44759 | 0 | 0 | 0.00% | 0.00% |  |
| B | 63104 | 44756 | 42 | 42 | 0.07% | 0.09% | 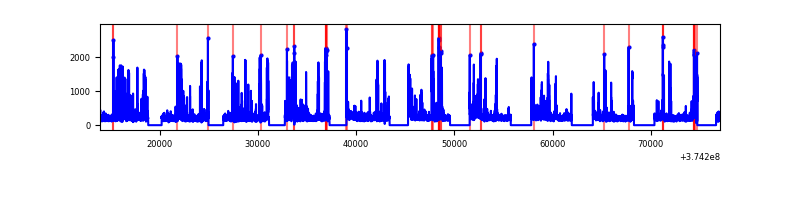 |
| C | 63104 | 44757 | 630 | 630 | 1.00% | 1.41% | 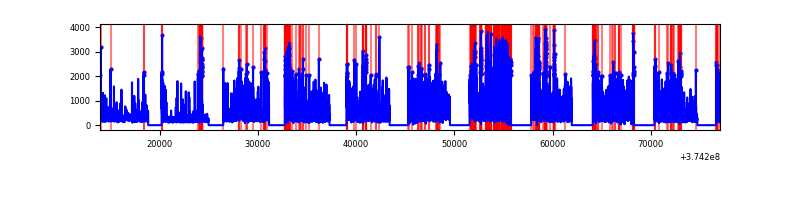 |
| D | 63104 | 44755 | 20173 | 20173 | 31.97% | 45.07% | 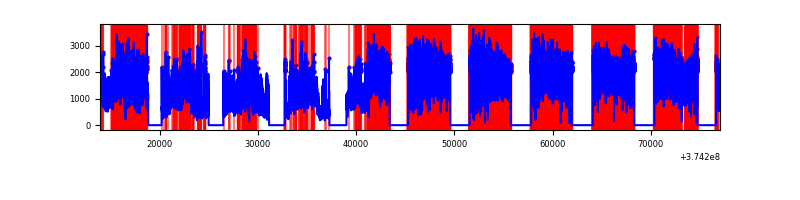 |
Top three noisy pixels from each quadrant. If the there are fewer than three noisy pixels in the level2.evt file, extra rows are filled as -1
| Pixel properties | Quadrant properties | ||||||
|---|---|---|---|---|---|---|---|
| Quadrant | DetID | PixID | Counts | Sigma | Mean | Median | Sigma |
| A | 13 | 254 | 77084 | 139.86 | 2450 | 2413 | 533.9 |
| A | 15 | 169 | 62687 | 112.89 | 2450 | 2413 | 533.9 |
| A | 13 | 6 | 43613 | 77.17 | 2450 | 2413 | 533.9 |
| B | 5 | 172 | 2379199 | 4996.43 | 2439 | 2390 | 475.7 |
| B | 5 | 200 | 213661 | 444.13 | 2439 | 2390 | 475.7 |
| B | 0 | 189 | 178692 | 370.61 | 2439 | 2390 | 475.7 |
| C | 8 | 111 | 6653864 | 13423.11 | 2190 | 2176 | 495.5 |
| C | 1 | 23 | 2990276 | 6029.99 | 2190 | 2176 | 495.5 |
| C | 7 | 221 | 1650877 | 3327.08 | 2190 | 2176 | 495.5 |
| D | 7 | 223 | 57999794 | 116210.55 | 1857 | 1820 | 499.1 |
| D | 8 | 195 | 6442348 | 12904.89 | 1857 | 1820 | 499.1 |
| D | 2 | 250 | 1378788 | 2759.03 | 1857 | 1820 | 499.1 |
Histogram calculated using DETX and DETY for each event in the final _common_clean file
| Quadrant A |  |
 |
Quadrant B |
|---|---|---|---|
| Quadrant D | 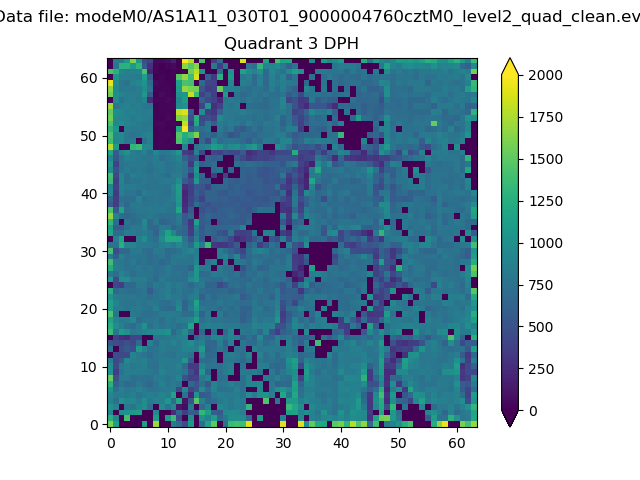 |
 |
Quadrant C |
| Plot type | Count rate plots | Images |
|---|---|---|
| Comparison with Poisson distribution Blue bars denote a histogram of data divided into 1 sec bins. Red curve is a Poisson curve with rate = median count rate of data. |
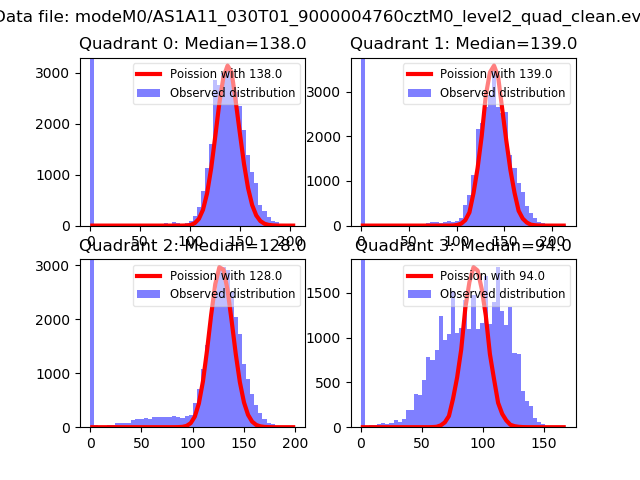 |
 |
| Quadrant-wise count rates Data is divided into 100 sec bins |
 |
|
| Module-wise count rates for Quadrant A Data is divided into 100 sec bins |
 |
 |
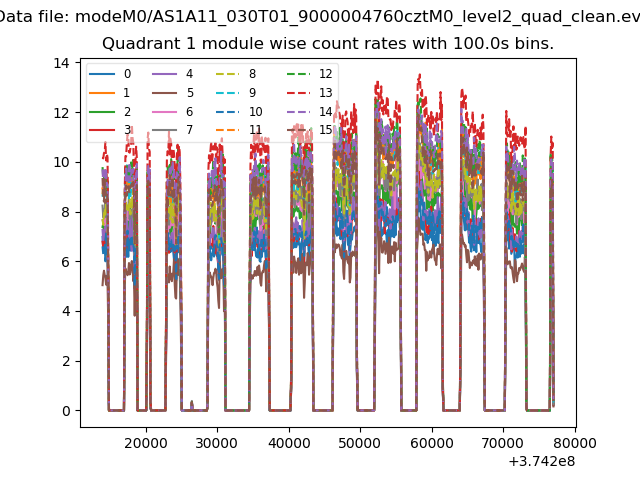
| Module-wise count rates for Quadrant B Data is divided into 100 sec bins |
 |
 |
| Module-wise count rates for Quadrant C Data is divided into 100 sec bins |
 |
 |
| Module-wise count rates for Quadrant D Data is divided into 100 sec bins |
 |
 |
| Parameter | Plot |
|---|---|
| CZT HV Monitor |  |
| D_VDD | 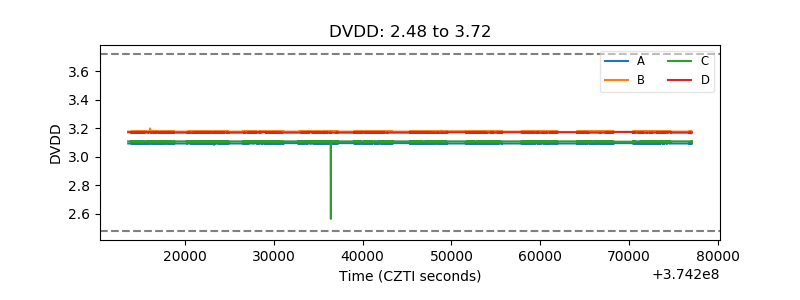 |
| Temperature 1 |  |
| Veto HV Monitor |  |
| Veto LLD | 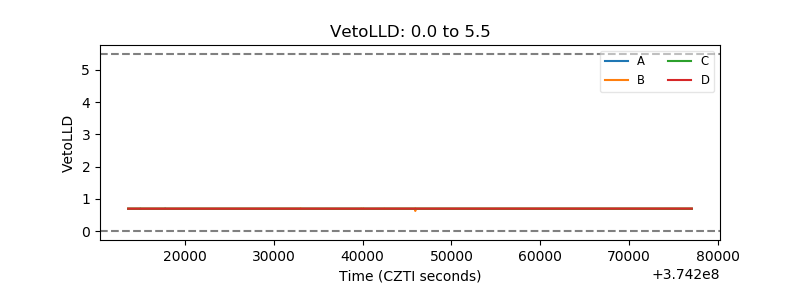 |
| Alpha Counter |  |
| _CPM_Rate |  |
| CZT Counter |  |
| +2.5 Volts monitor | 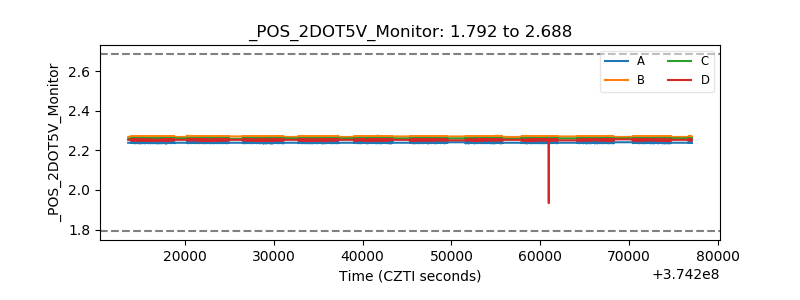 |
| +5 Volts monitor |  |
| _ROLL_ROT |  |
| _Roll_DEC |  |
| _Roll_RA |  |
| Veto Counter |  |