| Param | Original file | Final file |
|---|---|---|
| Filename | modeM0/AS1A11_008T06_9000004762cztM0_level2_bc.evt | modeM0/AS1A11_008T06_9000004762cztM0_level2_quad_clean.evt |
| Size (bytes) | 6,460,447,680 | 1,127,396,160 |
| Size | 6.0 GB | 1.0 GB |
| Events in quadrant A | 18,608,706 | 7,721,124 |
| Events in quadrant B | 29,008,915 | 7,424,060 |
| Events in quadrant C | 34,572,357 | 7,036,166 |
| Events in quadrant D | 107,482,331 | 5,906,762 |
| Mode M9 | |||
|---|---|---|---|
| Quadrant | BADHDUFLAG | Total packets | Discarded packets |
| A | 0 | 316 | 0 |
| B | 0 | 316 | 0 |
| C | 0 | 316 | 0 |
| D | 0 | 316 | 0 |
| Mode SS | |||
|---|---|---|---|
| Quadrant | BADHDUFLAG | Total packets | Discarded packets |
| A | 0 | 1804 | 0 |
| B | 0 | 1804 | 0 |
| C | 0 | 1804 | 0 |
| D | 0 | 1804 | 0 |
| Mode M0 | |||
|---|---|---|---|
| Quadrant | BADHDUFLAG | Total packets | Discarded packets |
| A | 0 | 179462 | 0 |
| B | 0 | 225787 | 0 |
| C | 0 | 259663 | 0 |
| D | 0 | 473905 | 0 |
| Quadrant | Total seconds | Saturated seconds | Saturation percentage |
|---|---|---|---|
| A | 88195 | 103 | 0.116787% |
| B | 88195 | 4582 | 5.195306% |
| C | 88195 | 8668 | 9.828222% |
| D | 88195 | 29363 | 33.293271% |
Noise dominated data is calculated using 1-second bins in cleaned event files. If a bin has >2000 counts, and if more than 50% of those come from <1% of pixels, then it is considered to be noise-dominated and hence unusable.
| Quadrant | # 1 sec bins | Bins with >0 counts | Bins with >2000 counts | High rate bins dominated by noise | Noise dominated (total time) | Noise dominated (detector-on time) | Marked lightcurve |
|---|---|---|---|---|---|---|---|
| A | 133224 | 88197 | 2 | 2 | 0.00% | 0.00% |  |
| B | 133224 | 88192 | 183 | 183 | 0.14% | 0.21% |  |
| C | 133224 | 88182 | 467 | 467 | 0.35% | 0.53% |  |
| D | 133224 | 88173 | 16501 | 16501 | 12.39% | 18.71% |  |
Top three noisy pixels from each quadrant. If the there are fewer than three noisy pixels in the level2.evt file, extra rows are filled as -1
| Pixel properties | Quadrant properties | ||||||
|---|---|---|---|---|---|---|---|
| Quadrant | DetID | PixID | Counts | Sigma | Mean | Median | Sigma |
| A | 15 | 169 | 183552 | 175.15 | 4677 | 4602 | 1021.7 |
| A | 13 | 254 | 155107 | 147.31 | 4677 | 4602 | 1021.7 |
| A | 13 | 6 | 135280 | 127.9 | 4677 | 4602 | 1021.7 |
| B | 5 | 172 | 7360716 | 8181.95 | 4573 | 4482 | 899.1 |
| B | 0 | 189 | 1137279 | 1259.95 | 4573 | 4482 | 899.1 |
| B | 5 | 200 | 620687 | 685.37 | 4573 | 4482 | 899.1 |
| C | 8 | 111 | 8941001 | 9071.89 | 4320 | 4297 | 985.1 |
| C | 7 | 221 | 3410730 | 3457.96 | 4320 | 4297 | 985.1 |
| C | 0 | 10 | 1917456 | 1942.1 | 4320 | 4297 | 985.1 |
| D | 7 | 223 | 58449167 | 58164.87 | 3977 | 3883 | 1004.8 |
| D | 8 | 195 | 14277495 | 14205.13 | 3977 | 3883 | 1004.8 |
| D | 12 | 218 | 5377052 | 5347.39 | 3977 | 3883 | 1004.8 |
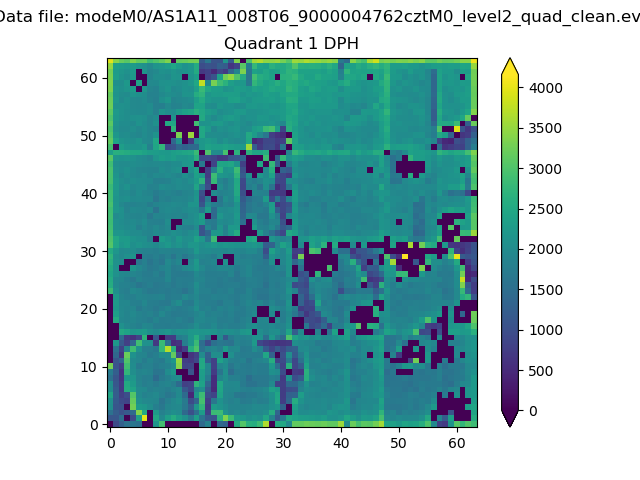
Histogram calculated using DETX and DETY for each event in the final _common_clean file
| Quadrant A |  |
 |
Quadrant B |
|---|---|---|---|
| Quadrant D |  |
 |
Quadrant C |
| Plot type | Count rate plots | Images |
|---|---|---|
| Comparison with Poisson distribution Blue bars denote a histogram of data divided into 1 sec bins. Red curve is a Poisson curve with rate = median count rate of data. |
 |
 |
| Quadrant-wise count rates Data is divided into 100 sec bins |
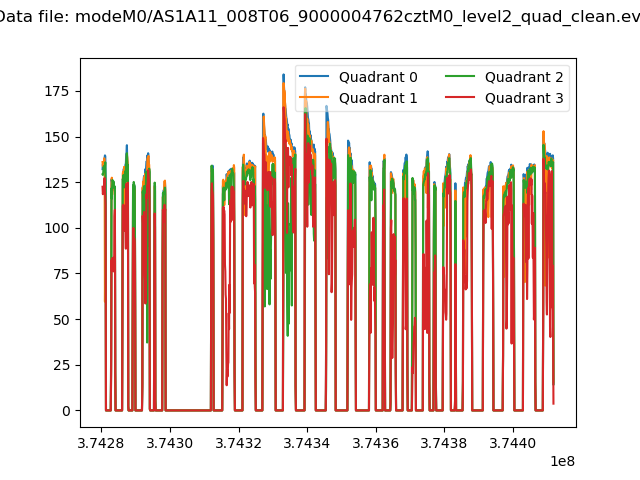 |
|
| Module-wise count rates for Quadrant A Data is divided into 100 sec bins |
 |
 |
| Module-wise count rates for Quadrant B Data is divided into 100 sec bins |
 |
 |
| Module-wise count rates for Quadrant C Data is divided into 100 sec bins |
 |
 |
| Module-wise count rates for Quadrant D Data is divided into 100 sec bins |
 |
 |
| Parameter | Plot |
|---|---|
| CZT HV Monitor |  |
| D_VDD |  |
| Temperature 1 | 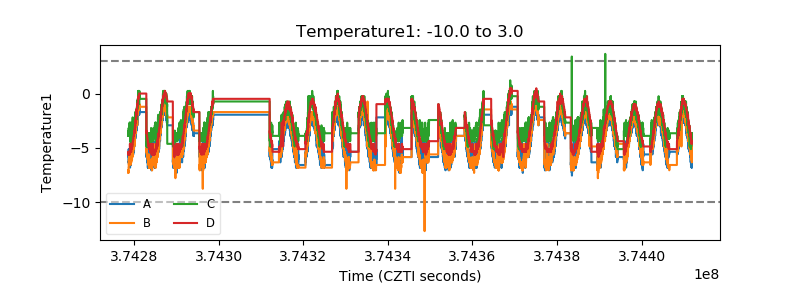 |
| Veto HV Monitor |  |
| Veto LLD |  |
| Alpha Counter |  |
| _CPM_Rate | 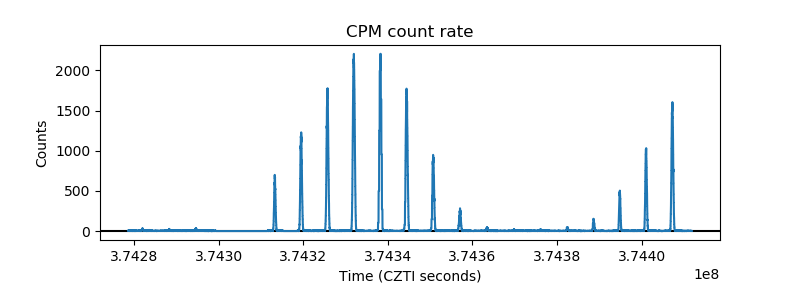 |
| CZT Counter |  |
| +2.5 Volts monitor |  |
| +5 Volts monitor |  |
| _ROLL_ROT |  |
| _Roll_DEC |  |
| _Roll_RA |  |
| Veto Counter | 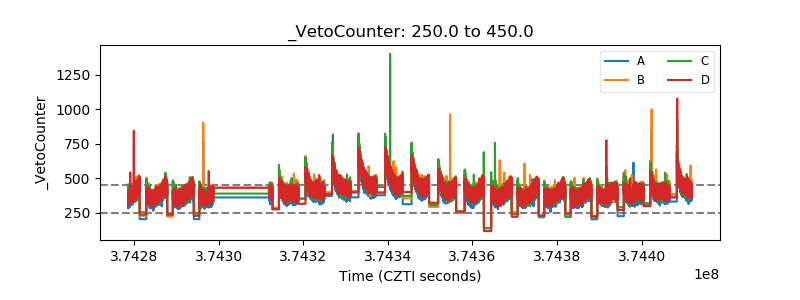 |